1468
Whole-brain amide CEST at 3T with a steady-state radial MRI acquisition1F.M. Kirby Research Center for Functional Brain Imagin, Kennedy Krieger Institute, Baltimore, MD, United States, 2Russell H. Morgan Department of Radiology and Radiological Science, Johns Hopkins University School of Medicine, Baltimore, MD, United States, 3Department of Biomedical Engineering, Johns Hopkins University, Baltimore, MD, United States, 4Department of Biomedical Engineering, City University of Hong Kong, Hong Kong, China, 5BioMedical Engineering and Imaging Institute, Icahn School of Medicine at Mount Sinai, New York, NY, United States
Synopsis
We aim to develop an acquisition and processing pipeline for amideCEST mapping on human brain at 3T. This includes steady-state radial CEST (starCEST) using PROPELLOR-based sampling to acquire Z-spectra that are robust to brain motions and one multi-linear singular value decomposition (MLSVD) post-processing for enhancing the CEST SNR. Finally, the amideCEST peak was quantified using the polynomial and Lorentzian line-shape fitting (PLOF) approach.The amideCEST contrast extracted by the PLOF method trended towards a stronger gray matter (GM) signal (1.33% ± 0.34%) than white matter (WM) (0.92% ± 0.09%; p=0.06, n=4).
Purpose
The successful acquisition of amideCEST signal requires sufficient signal-to-noise ratio (SNR) and image stability. Many efforts have been devoted to optimizing saturation parameters to increase CEST contracts1-4, but improvements have been limited. Reducing the noise caused by subject physiological and physical motions can also improve CEST SNR. This has been shown using motion insensitive self-gated radial sampling CEST 5,6 and/or some post-processing methods by exploiting the redundancy of CEST images between different saturation offsets 7-11.In this work, we aimed to combine the fast radial acquisition method of periodically rotated overlapping parallel lines with enhanced reconstruction (PROPELLER) 12,13, with steady state saturation for amideCEST imaging on the human brain at 3T (starCEST). To further improve the starCEST SNR, multilinear singular value decomposition (MLSVD) 14 was applied. The extraction of amideCEST signals from in vivo Z-spectra is another challenging issue for 3T MRI. Recently, more evidence has suggested that the amide peak is discernible even at 3T MR fields when using low B1 strengths 15-18. Also, there is a smooth merging of background signals from semi-solid magnetization transfer contrast (MTC), direct saturation (DS) and faster exchanging metabolite protons. Hence, the polynomial and Lorentzian line-shape Fitting (PLOF) approach4,19,20 that was proposed to extract and quantify CEST signals with discernible peaks should be well-suited for amideCEST quantification imaging at 3T.Methods
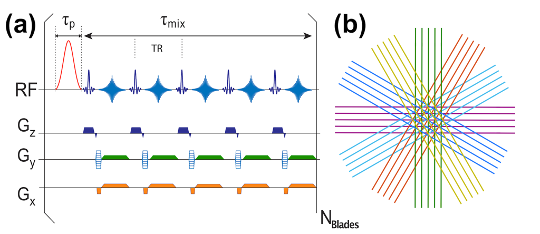
All human scans were acquired on a 3T Philips Elition system (Philips Healthcare) using a quadrature transmit body coil and a 32-channel head coil. The study was approved by the local IRB and all volunteers signed informed consent. Figure 1 depicts the starCEST sequence based on the MultiVane Philips version of this sequence. The pulse width of the sinc-gauss saturation pulses was set to 50 ms. Images were acquired at 5 × 3 × 3 mm3 resolution using 15 slices and a FOV of 220 × 220mm2 The oversampling rate was 150% for MultiVane, and 12 blade lines in one blade were collected unless specified. Furthermore, 37 saturation frequency offsets from 1 to 7.8 ppm with 0.2-ppm increment were acquired for amideCEST imaging with a total acquisition time of 4min40s. The amideCEST signal was extracted using the PLOF method with an improved background function by including one Lorentzian function to account for the water direct saturation 4, 19-21. MLSVD denoising was applied with truncation numbers 49, 49 and 10.Results and Discussion
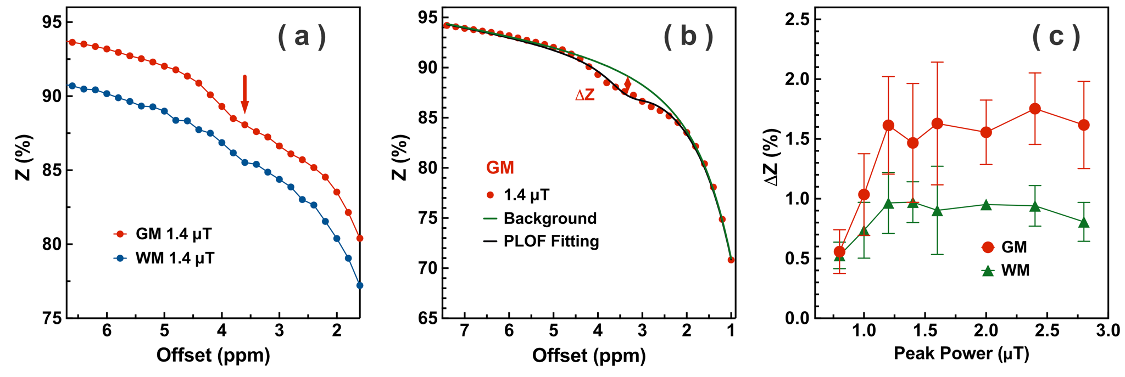
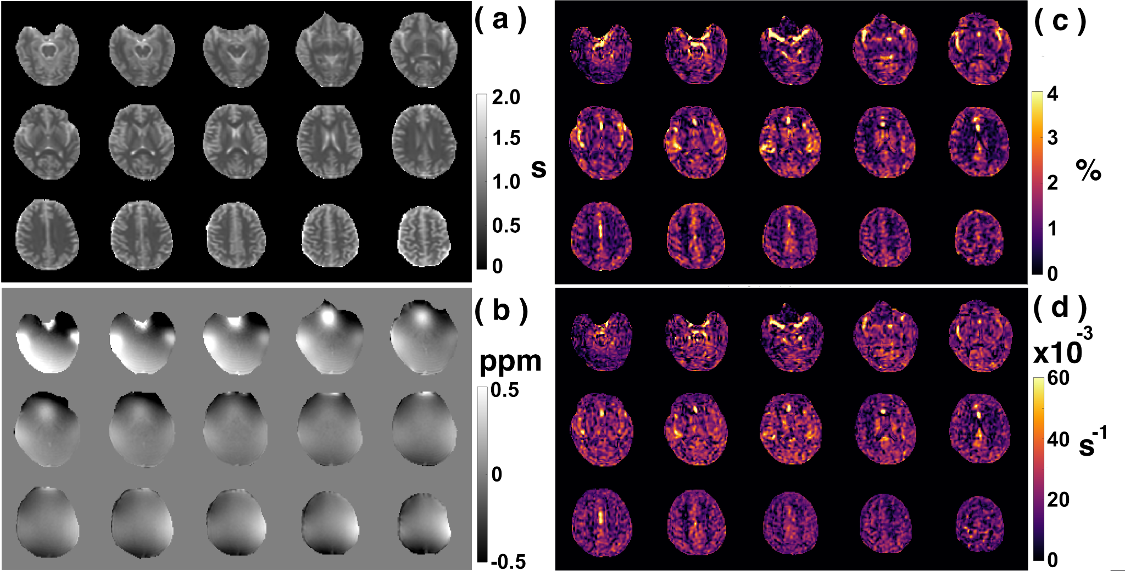
Examples of starCEST Z-spectra between 1.6 and 6.7 ppm for gray matter (GM) and white matter (WM) are depicted in Fig. 2a. The Z-spectra demonstrate obvious differences in the amide peak for GM and WM. The B1-dependent amideCEST signal is shown in Fig. 2c. The optimum B1 to discern an amide signal was 1.2 µT for WM and between 1.2-1.6 µT for GM. The amideCEST signal (ΔZamide) was about constant between 1.2 and 2.4 µT (1.6-1.7%) for GM. In order to make the sequence robust to the B1 variation in the brain, the peak saturation power was therefore set to 1.4 µT in the following studies.Figure 3 depicts T1, B0, ΔZamide and Ramide (relaxation rate in the rotating frame) maps of the brain of a typical subject. The B0 inhomogeneity over the whole brain was in the range of -0.7–0.7 ppm. Some inhomogeneity areas appeared at the two ends of the slice package. The ΔZamide and Ramide maps were calculated with the PLOF method by including the B0 map and the measured T1 maps. Discernable WM and GM amide CEST effects were observed in the ΔZamide maps, consistent with the appearance of the Z-spectra (Fig. 2a). Correction for the MTC/DS background and T1 impacts, the WM and GM contrast in the Ramide maps diminished significantly.
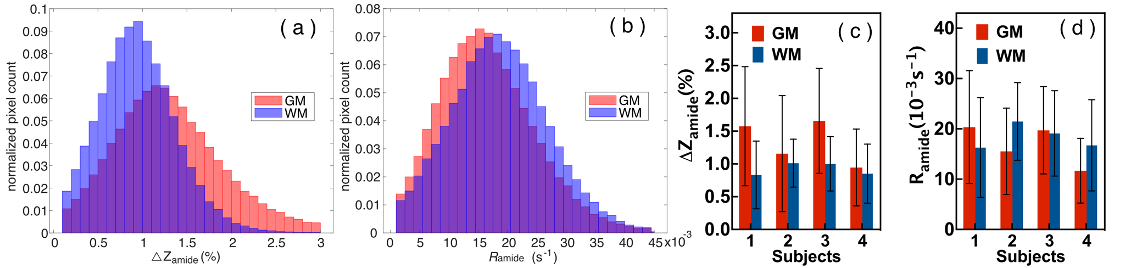
In order to quantify the amideCEST values, Figure 4 depicts histograms of the amideCEST signal difference and rotating frame relaxation rates in WM and GM for all subjects (n=4). The regions of interest for GM and WM were extracted from the T1 maps with a cut-off value of 0.8 s. The mean and standard deviation of the amideCEST signals were 1.33 ± 0.34% (GM) and 0.92% ± 0.09% (WM) (p=0.06, n=4) for ΔZamide, respectively (Fig. 4a). While this average indicates nonsignificant contrast, an apparent difference in GM and WM was visible in the ΔZamide maps (Fig. 3c) as well as with the GM and WM Z-spectra (Fig. 2a). In the Ramide images, the averages also showed no significant difference (GM:17 ± 4*10-3 s-1 ; WM:18 ± 2*10-3 s-1;p=0.5, n=4, Fig. 4b), consistent with the low contrast in the Ramide maps (Fig. 3d). Reproducibility was investigated for the same protocol across different subjects, and the results are plotted in Figs. 4c,d. The intersubject coefficients of variation (COV) were 25% (GM) and 10% (WM) (n = 4) for amideCEST (Fig. 4c).
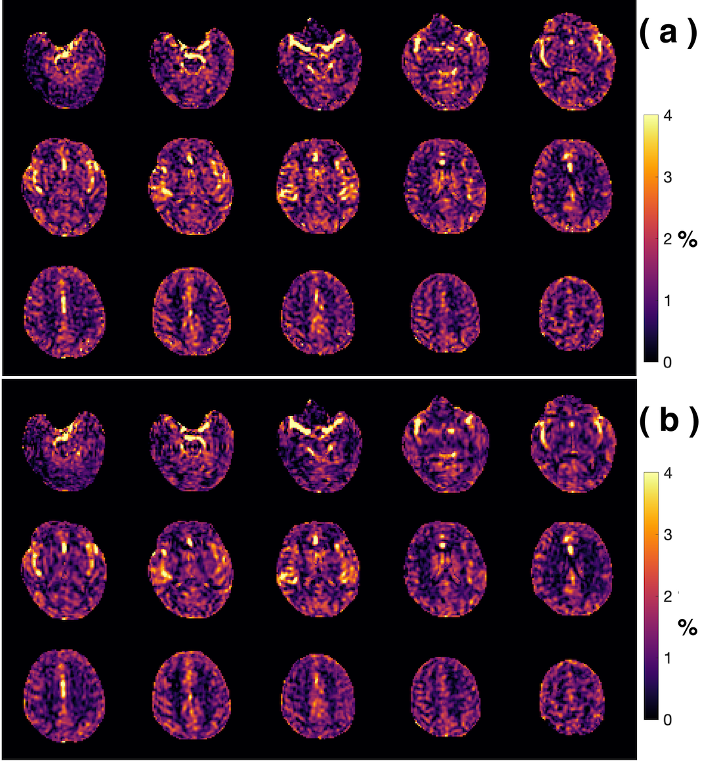
The amideCEST maps closely resemble to those obtained by suppressing MTC with variable delay multi-pulsed method 22. The MLSVD method was used to enhance the overall SNR as illustrated by the comparison study in Fig. 5.
Conclusion
We have demonstrated that a multi-slice starCEST method can be used for human amideCEST imaging with a clinically feasible scan time at 3T.Acknowledgements
Grant support from NIH: P41EB015909, R01HL149742, R03NS109664, R21NS118079, R21AG065794 and DOD W81XWH-18-1-0797. We thank Caigui Lin for performing some pilot studies.References
1. Sun PZ, Wang E, Cheung JS, et al. Simulation and optimization of pulsed radio frequency irradiation scheme for chemical exchange saturation transfer (CEST) MRI-demonstration of pH-weighted pulsed-amide proton CEST MRI in an animal model of acute cerebral ischemia. Magn Reson Med. 2011; 66(4):1042-8. doi:10.1002/mrm.22894
2. Sun PZ, Benner T, Kumar A, et al. Investigation of optimizing and translating pH-sensitive pulsed-chemical exchange saturation transfer (CEST) imaging to a 3T clinical scanner. Magn Reson Med. 2008; 60(4):834-41. doi:10.1002/mrm.21714
3. Zu Z, Li K, Janve VA, et al. Optimizing pulsed-chemical exchange saturation transfer imaging sequences. Magn Reson Med. 2011; 66(4):1100-8. doi:10.1002/mrm.22884
4. Chen L, Wei Z, Cai S, et al. High-resolution creatine mapping of mouse brain at 11.7 T using non-steady-state chemical exchange saturation transfer. NMR Biomed. 2019; 32(11):e4168. doi:10.1002/nbm.4168
5. Chen L, Wei Z, Chan KWY, et al. Protein aggregation linked to Alzheimer's disease revealed by saturation transfer MRI. Neuroimage. 2018; 188:380-90. doi:10.1016/j.neuroimage.2018.12.018
6. Zhou Y, van Zijl PCM, Xu X, et al. Magnetic resonance imaging of glycogen using its magnetic coupling with water. Proc Natl Acad Sci U S A. 2020; 117(6):3144-9. doi:10.1073/pnas.1909921117
7. Breitling J, Deshmane A, Goerke S, et al. Adaptive denoising for chemical exchange saturation transfer MR imaging. NMR Biomed. 2019; 32(11):e4133. doi:10.1002/nbm.4133
8. Bie C, Liang Y, Zhang L, et al. Motion correction of chemical exchange saturation transfer MRI series using robust principal component analysis (RPCA) and PCA. Quant Imaging Med Surg. 2019; 9(10):1697-713. doi:10.21037/qims.2019.09.14
9. Breitling J, Deshmane A, Goerke S, et al. Adaptive denoising for chemical exchange saturation transfer MR imaging. NMR Biomed. 2019:e4133. doi:10.1002/nbm.4133
10. Wech T, Kostler H. Robust motion correction in CEST imaging exploiting low-rank approximation of the z-spectrum. Magn Reson Med. 2018; 80(5):1979-88. doi:10.1002/mrm.27206
11. Dopfert J, Witte C, Kunth M, et al. Sensitivity enhancement of (Hyper-)CEST image series by exploiting redundancies in the spectral domain. Contrast Media Mol Imaging. 2014; 9(1):100-7. doi:10.1002/cmmi.1543
12. Pipe JG. Motion correction with PROPELLER MRI: application to head motion and free-breathing cardiac imaging. Magn Reson Med. 1999; 42(5):963-9. doi:10.1002/(sici)1522-2594(199911)42:5<963::aid-mrm17>3.0.co;2-l
13. Pipe JG, Gibbs WN, Li Z, et al. Revised motion estimation algorithm for PROPELLER MRI. Magn Reson Med. 2014; 72(2):430-7. doi:10.1002/mrm.24929
14. Chen L, Cao S, Koehler RC, et al. High-sensitivity CEST mapping using a spatiotemporal correlation-enhanced method. Magn Reson Med. 2020:10.1002/mrm.28380. doi:10.1002/mrm.28380
15. Zhou IY, Lu D, Ji Y, et al. Determination of multipool contributions to endogenous amide proton transfer effects in global ischemia with high spectral resolution in vivo chemical exchange saturation transfer MRI. Magn Reson Med. 2019; 81(1):645-52. doi:10.1002/mrm.27385
16. Deshmane A, Zaiss M, Lindig T, et al. 3D gradient echo snapshot CEST MRI with low power saturation for human studies at 3T. Magn Reson Med. 2019; 81(4):2412-23. doi:10.1002/mrm.27569
17. Jin T, Wang P, Hitchens TK, et al. Enhancing sensitivity of pH-weighted MRI with combination of amide and guanidyl CEST. Neuroimage. 2017; 157:341-50. doi:10.1016/j.neuroimage.2017.06.007
18. Zong X, Wang P, Kim SG, et al. Sensitivity and source of amine-proton exchange and amide-proton transfer magnetic resonance imaging in cerebral ischemia. Magn Reson Med. 2014; 71(1):118-32. doi:10.1002/mrm.24639
19. Chen L, Barker PB, Weiss RG, et al. Creatine and phosphocreatine mapping of mouse skeletal muscle by a polynomial and Lorentzian line-shape fitting CEST method. Magn Reson Med. 2019; 81(1):69-78. doi:10.1002/mrm.27514
20. Chen L, Zeng H, Xu X, et al. Investigation of the contribution of total creatine to the CEST Z-spectrum of brain using a knockout mouse model. NMR Biomed. 2017; 30(12):e3834. doi:10.1002/nbm.3834
21. Chen L, Schar M, Chan KWY, et al. In vivo imaging of phosphocreatine with artificial neural networks. Nat Commun. 2020; 11(1):1072. doi:10.1038/s41467-020-14874-0
22. Xu X, Yadav NN, Zeng HF, et al. Magnetization Transfer Contrast-Suppressed Imaging of Amide Proton Transfer and Relayed Nuclear Overhauser Enhancement Chemical Exchange Saturation Transfer Effects in the Human Brain at 7T. Magn. Reson. Med. 2016; 75(1):88-96. doi:10.1002/mrm.25990
Figures