1467
A comparison of several tumor endogenous pH mapping methods using CEST at 11.7T
Ying Liu1,2, Botao Zhao1,2, and Xiao-Yong Zhang1,2
1Institute of Science and Technology for Brain-Inspired Intelligence, Fudan University, Shanghai, China, 2Key Laboratory of Computational Neuroscience and Brain-Inspired Intelligence (Fudan University), Ministry of Education, Shanghai, China
1Institute of Science and Technology for Brain-Inspired Intelligence, Fudan University, Shanghai, China, 2Key Laboratory of Computational Neuroscience and Brain-Inspired Intelligence (Fudan University), Ministry of Education, Shanghai, China
Synopsis
CEST-MRI has emerged as a noninvasive pH imaging technique based on the pH-dependence of the prototropic exchange rates. In this work, we compared several recently published CEST pH imaging methods and proton exchange rate value in rat glioma models at 11.7T. All of these pH-weighted contrasts show a pH correlation and have significantly different signal intensities between the tumor region and the surrounding normal tissue. Our results demonstrated that pH enhanced method and APT imaging are not concentration-independent while the sensitivity of AACID is affected by the weak amine signals at 2.7ppm.
Introduction
Chemical exchange saturation transfer (CEST) MRI has emerged as a noninvasive pH imaging technique for several kinds of diseases such as tumor, relying on the pH-dependence of the prototropic exchange rates1,2. Recently, several endogenous CEST methods including corrected amide proton transfer (APT) imaging3,4, amine and amide concentration-independent detection (AACID)5,6, and pH enhanced method with the combination of amide and guanidyl CEST (pHenh)7 have been exploited to obtain pH maps and hold great clinical potentials. In the present work, we aimed to compare the performance of these pH-weighted contrasts with exchange rate value and relative proton concentration using multi-pool Lorentzian fit8 and omega plot method9,10 in rat glioma models at 11.7T.Materials and Methods
Animal model: All experimental protocols were approved by the Animal Ethics Committee of Fudan University. A total of 6 Male Sprague Dawley rats (180−200 g) were purchased from Shanghai Slac Lab Animal Ltd (Shanghai, China). C6 rat glioblastoma cells were stereotaxically injected into the right cerebral hemisphere to establish glioma model.Data Acquisition: MRI experiments were performed at 11.7T BioSpec 117/16 USR MRI system with a surface coil for receiving (Bruker BioSpin, Ettlingen, Germany). T2-weighted images of the whole brain were acquired using a Rapid Acquisition with Relaxation Enhancement (RARE) sequence with the following parameters: TR/TE, 3500/30 ms; RARE factor, 8; spatial resolution, 0.125 × 0.125 × 0.8 mm3. Single-slice CEST images were obtained by a continuous wave (CW) RF irradiation (B1=0.6, 0.8, 1.1, 1.5, 2.0μT) followed by a RARE sequence to readout with parameters: TR/TE=5000/41ms, RARE factor, 24; spatial resolution, 0.33 × 0.33 × 2 mm3. Saturation offsets were distributed between –30 and 30ppm with denser sampling between –5 and 5ppm and S0 was set at 200 ppm. T1 value was measured using the same RARE sequence with 6 different inversion times (5500ms, 3000ms, 1500ms, 800ms, 500ms, and 300ms).
Data analysis: After normalization, B0 correction, and adaptive denoising11, the Z- spectra were fitted as a linear combination of multiple Lorentzian functions12. Then the exchange rate (kb) and labile proton ratio (fb) were estimated using the omega plot method10 with multi-pool fitted 1/MTRRex values at 2.0 ppm. And several recently published pH-weighted contrasts including pHenh7 with B1=1.1μT at 3.6ppm and B1=0.6μT at 2ppm, AACID5 with B1=1.1μT, and APT resolved from multi-pool model4 with B1=1.1μT were also calculated for comparison.
Results and Discussion
Fig. 1a presents representative normalized Z spectra from a normal region of interest with varied B1 from 0.6 μT to 2.0μT. Fig. 1b shows the corresponding six-pool Lorentzian fitting results and the subtracted residual (dark stem plot) at B1=1.0μT. Individual CEST contributions (amide, amine, NOE (-1.6), NOE (-3.5), DS, and MT) were isolated well from the entire Z-spectrum. As shown in Fig. 1c, the omega plot analysis display the expected linear relationship between the 1/MTRRex and 1/ ω12. And the exchange rate values appear lower in the tumor region (kb= 416.81±18.14) than in the normal tissue (kb=511.25±26.90), indicating lower pH values in tumor according to the previous reports13,14. Fig. 2 illustrates example maps of the exchange rate (Fig. 2b), proton ratio (Fig. 2c), and the commonly used pH-weighted MRI (Fig. 2d-e). Tumor with hyper-intensive signals in the T2W image (Fig.2a) was delineated by the red dotted line. Notably, signal intensity in the tumor region shows a clear difference compared to the surrounding normal tissue among all of these contrast maps. The variation trends of pHenh, AACID, and APT values in these experiments agree well with the original literature researches4,5,7. Fig. 3 shows the scatter distributions and Person correlation coefficients among the fb, kb with the other three pH-weighted contrasts of all voxels from 6 mice brain. Signals from tumor region were isolated using the red points. A significant negative correlation was observed among pHenh with both kb and fb (Fig. 3a, d), which may reflect that pH enhanced method is not concentration-independent for pH imaging. Fig. 3b & 3e show that AACID approach allows the removal of the concentration but relatively less sensitive to pH detection, which may due to the weak amine signals at 2.7ppm. As shown in the last column (Fig. 3c, f), APT effects have a strong correlation with the proton ratio and a weaker correlation with the exchange rate, indicating that accurate pH values cannot be calculated using this method due to the varied concentration of labile protons in tumors.Conclusion
This work investigated the association between several recently published endogenous CEST pH-weighted imaging methods (corrected APT, AACID, pHenh) and direct exchange rate value and relative proton concentration using DS-removed omega plot method in rat glioma models at 11.7T. All of these pH-weighted contrast maps show a pH correlation and have significantly different signal intensities between the tumor region and the surrounding normal tissue. Our results demonstrated that pH enhanced method and APT imaging are not concentration-independent while the sensitivity of AACID is affected by the weak amine signals at 2.7ppm.Acknowledgements
This work was supported by grants from the National Natural Science Foundation of China (81873893), Three-year action plan for key global partners (IDH6282008/050/001/004), and Shanghai Municipal Science and Technology Major Project (2018SHZDZX01).References
- Longo, D. L. et al. In Vivo Imaging of Tumor Metabolism and Acidosis by Combining PET and MRI-CEST pH Imaging. Cancer Res. 76, 6463–6470 (2016).
- Anemone, A., Consolino, L., Arena, F., Capozza, M. & Longo, D. L. Imaging tumor acidosis: a survey of the available techniques for mapping in vivo tumor pH. Cancer Metastasis Rev. 1–25 (2019) doi:10.1007/s10555-019-09782-9.
- Sun, P. Z., Wang, E. & Cheung, J. S. Imaging acute ischemic tissue acidosis with pH-sensitive endogenous amide proton transfer (APT) MRI-Correction of tissue relaxation and concomitant RF irradiation effects toward mapping quantitative cerebral tissue pH. Neuroimage 60, 1–6 (2012).
- Wu, Y. et al. pH-sensitive amide proton transfer effect dominates the magnetization transfer asymmetry contrast during acute ischemia-quantification of multipool contribution to in vivo CEST MRI. Magn. Reson. Med. 79, 1602–1608 (2018).
- McVicar, N. et al. Quantitative tissue pH measurement during cerebral ischemia using amine and amide concentration-independent detection (AACID) with MRI. J. Cereb. Blood Flow Metab. 34, 690–8 (2014).
- Albatany, M., Li, A., Meakin, S. & Bartha, R. Dichloroacetate induced intracellular acidification in glioblastoma: in vivo detection using AACID-CEST MRI at 9.4 Tesla. J. Neurooncol. 136, 255–262 (2018).
- Jin, T., Wang, P., Hitchens, T. K. & Kim, S.-G. Enhancing sensitivity of pH-weighted MRI with combination of amide and guanidyl CEST. Neuroimage 157, 341–350 (2017).
- Zaiss, M. et al. A combined analytical solution for chemical exchange saturation transfer and semi-solid magnetization transfer. NMR Biomed. 28, 217–230 (2015).
- Zaiss, M. et al. QUESP and QUEST revisited – fast and accurate quantitative CEST experiments. Magn. Reson. Med. 79, 1708–1721 (2018).
- Meissner, J. E. et al. Quantitative pulsed CEST-MRI using Ω-plots. NMR Biomed. 28, 1196–1208 (2015).
- Breitling, J. et al. Adaptive denoising for chemical exchange saturation transfer MR imaging. NMR Biomed. 32, 1–14 (2019).
- Zaiss, M. et al. A combined analytical solution for chemical exchange saturation transfer and semi-solid magnetization transfer. (2014) doi:10.1002/nbm.3237.
- Sun, P. Z., Xiao, G., Zhou, I. Y., Guo, Y. & Wu, R. A method for accurate pH mapping with chemical exchange saturation transfer (CEST) MRI. Contrast Media Mol. Imaging 11, 195–202 (2016).
- Wu, R., Xiao, G., Zhou, I. Y., Ran, C. & Sun, P. Z. Quantitative chemical exchange saturation transfer (qCEST) MRI - omega plot analysis of RF-spillover-corrected inverse CEST ratio asymmetry for simultaneous determination of labile proton ratio and exchange rate. NMR Biomed. 28, 376–383 (2015).
Figures
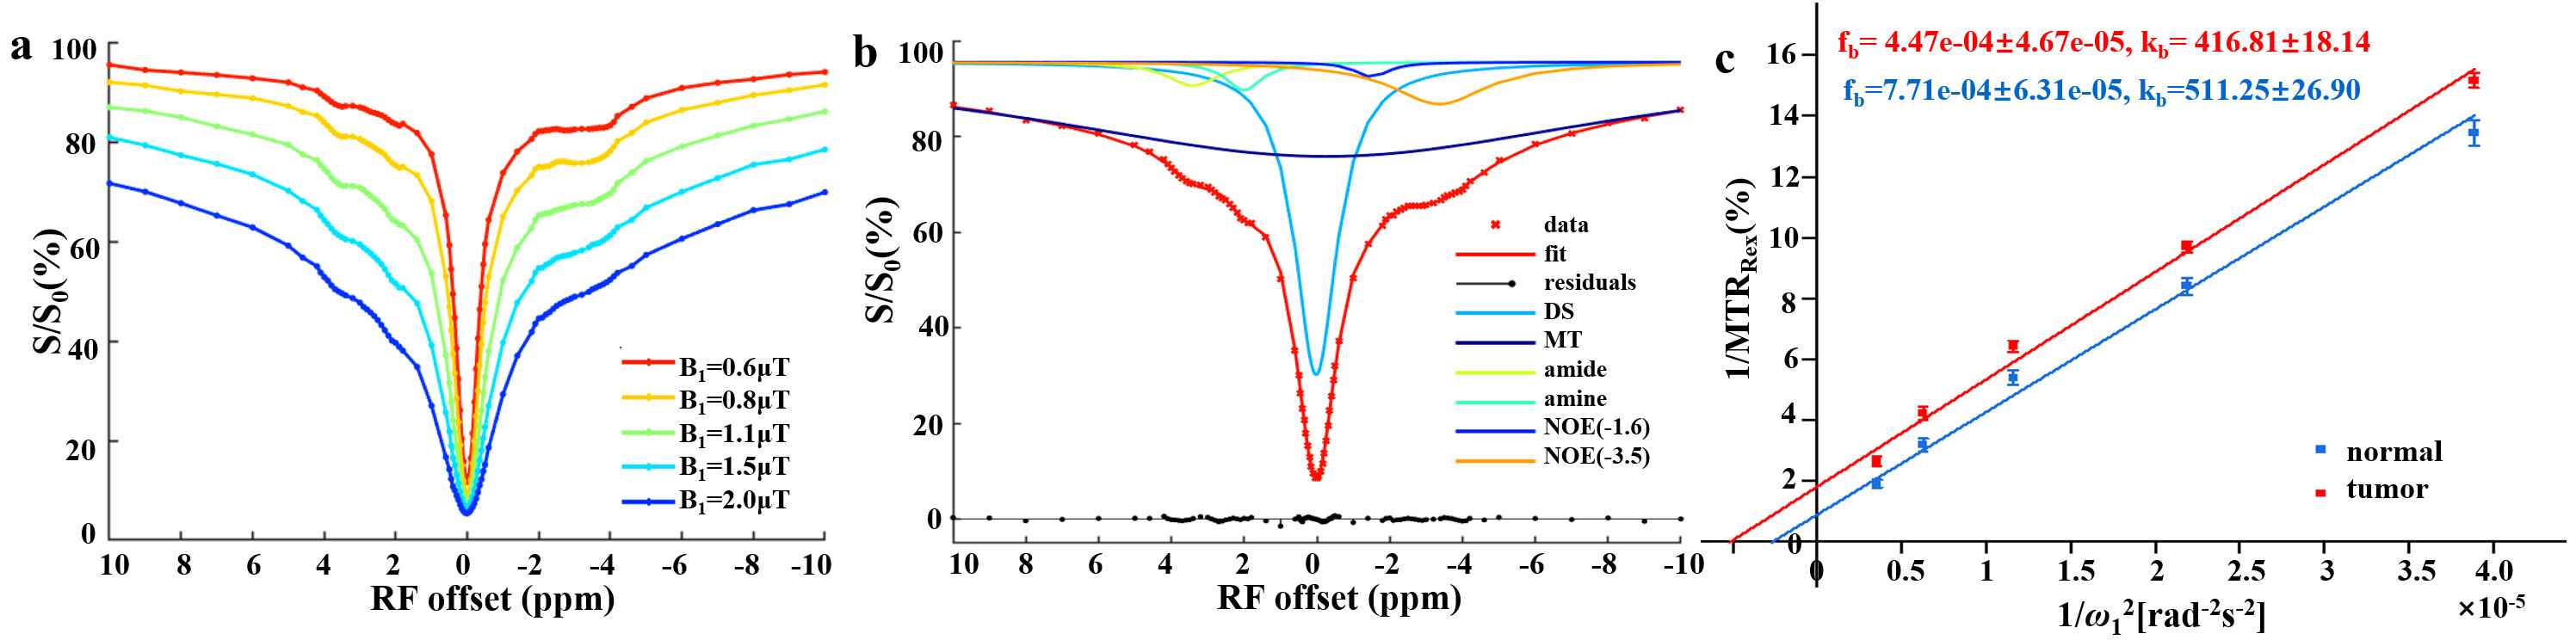
Fig. 1. (a) Representative Z spectra of one mouse brain from
normal tissue with B1 varied between 0.6–2μT. (b) Corresponding six-pool
Lorentzian fitting results at B1=1.0μT. (c) Typical omega plot analysis of
1/MTRRex versus 1/ ω12 for tumor region (red) and normal tissue (blue) of one
mouse brain.
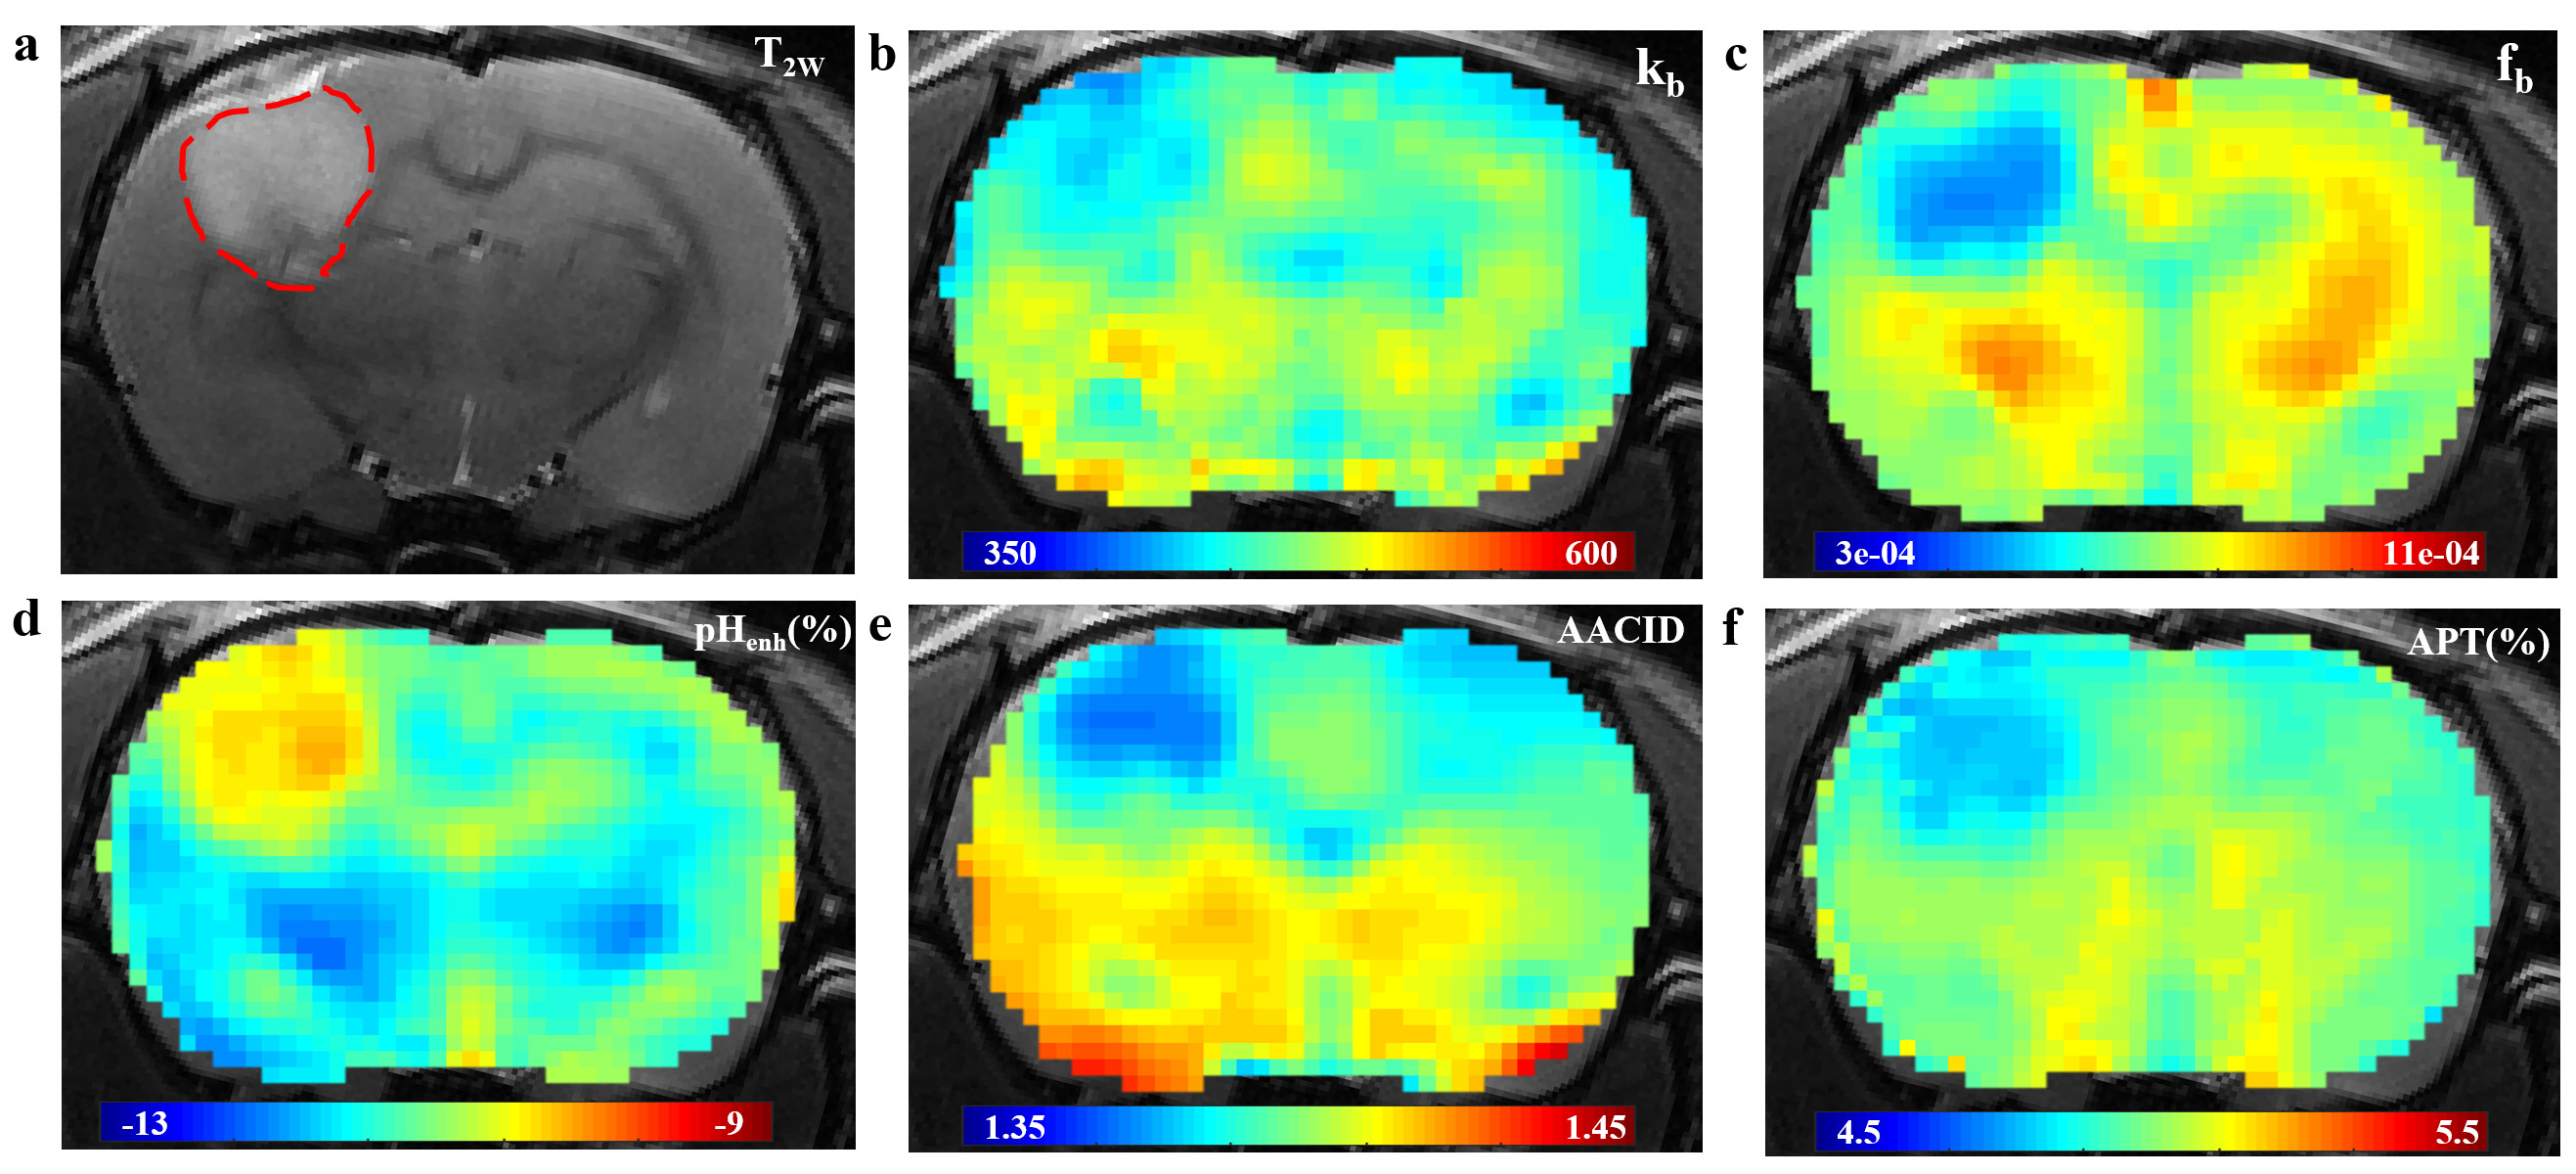
Fig. 2. Representative examples of structural
image and CEST maps of one mouse brain. (a)T2W image with tumor
region delineated by the red dotted line. (b), (c) Representative proton
exchange rate and labile proton ratio maps. (d), (e), (f) pH weighted contrasts
calculated using pH enhanced method, AACID method and amide proton transfer
(APT) MRI.
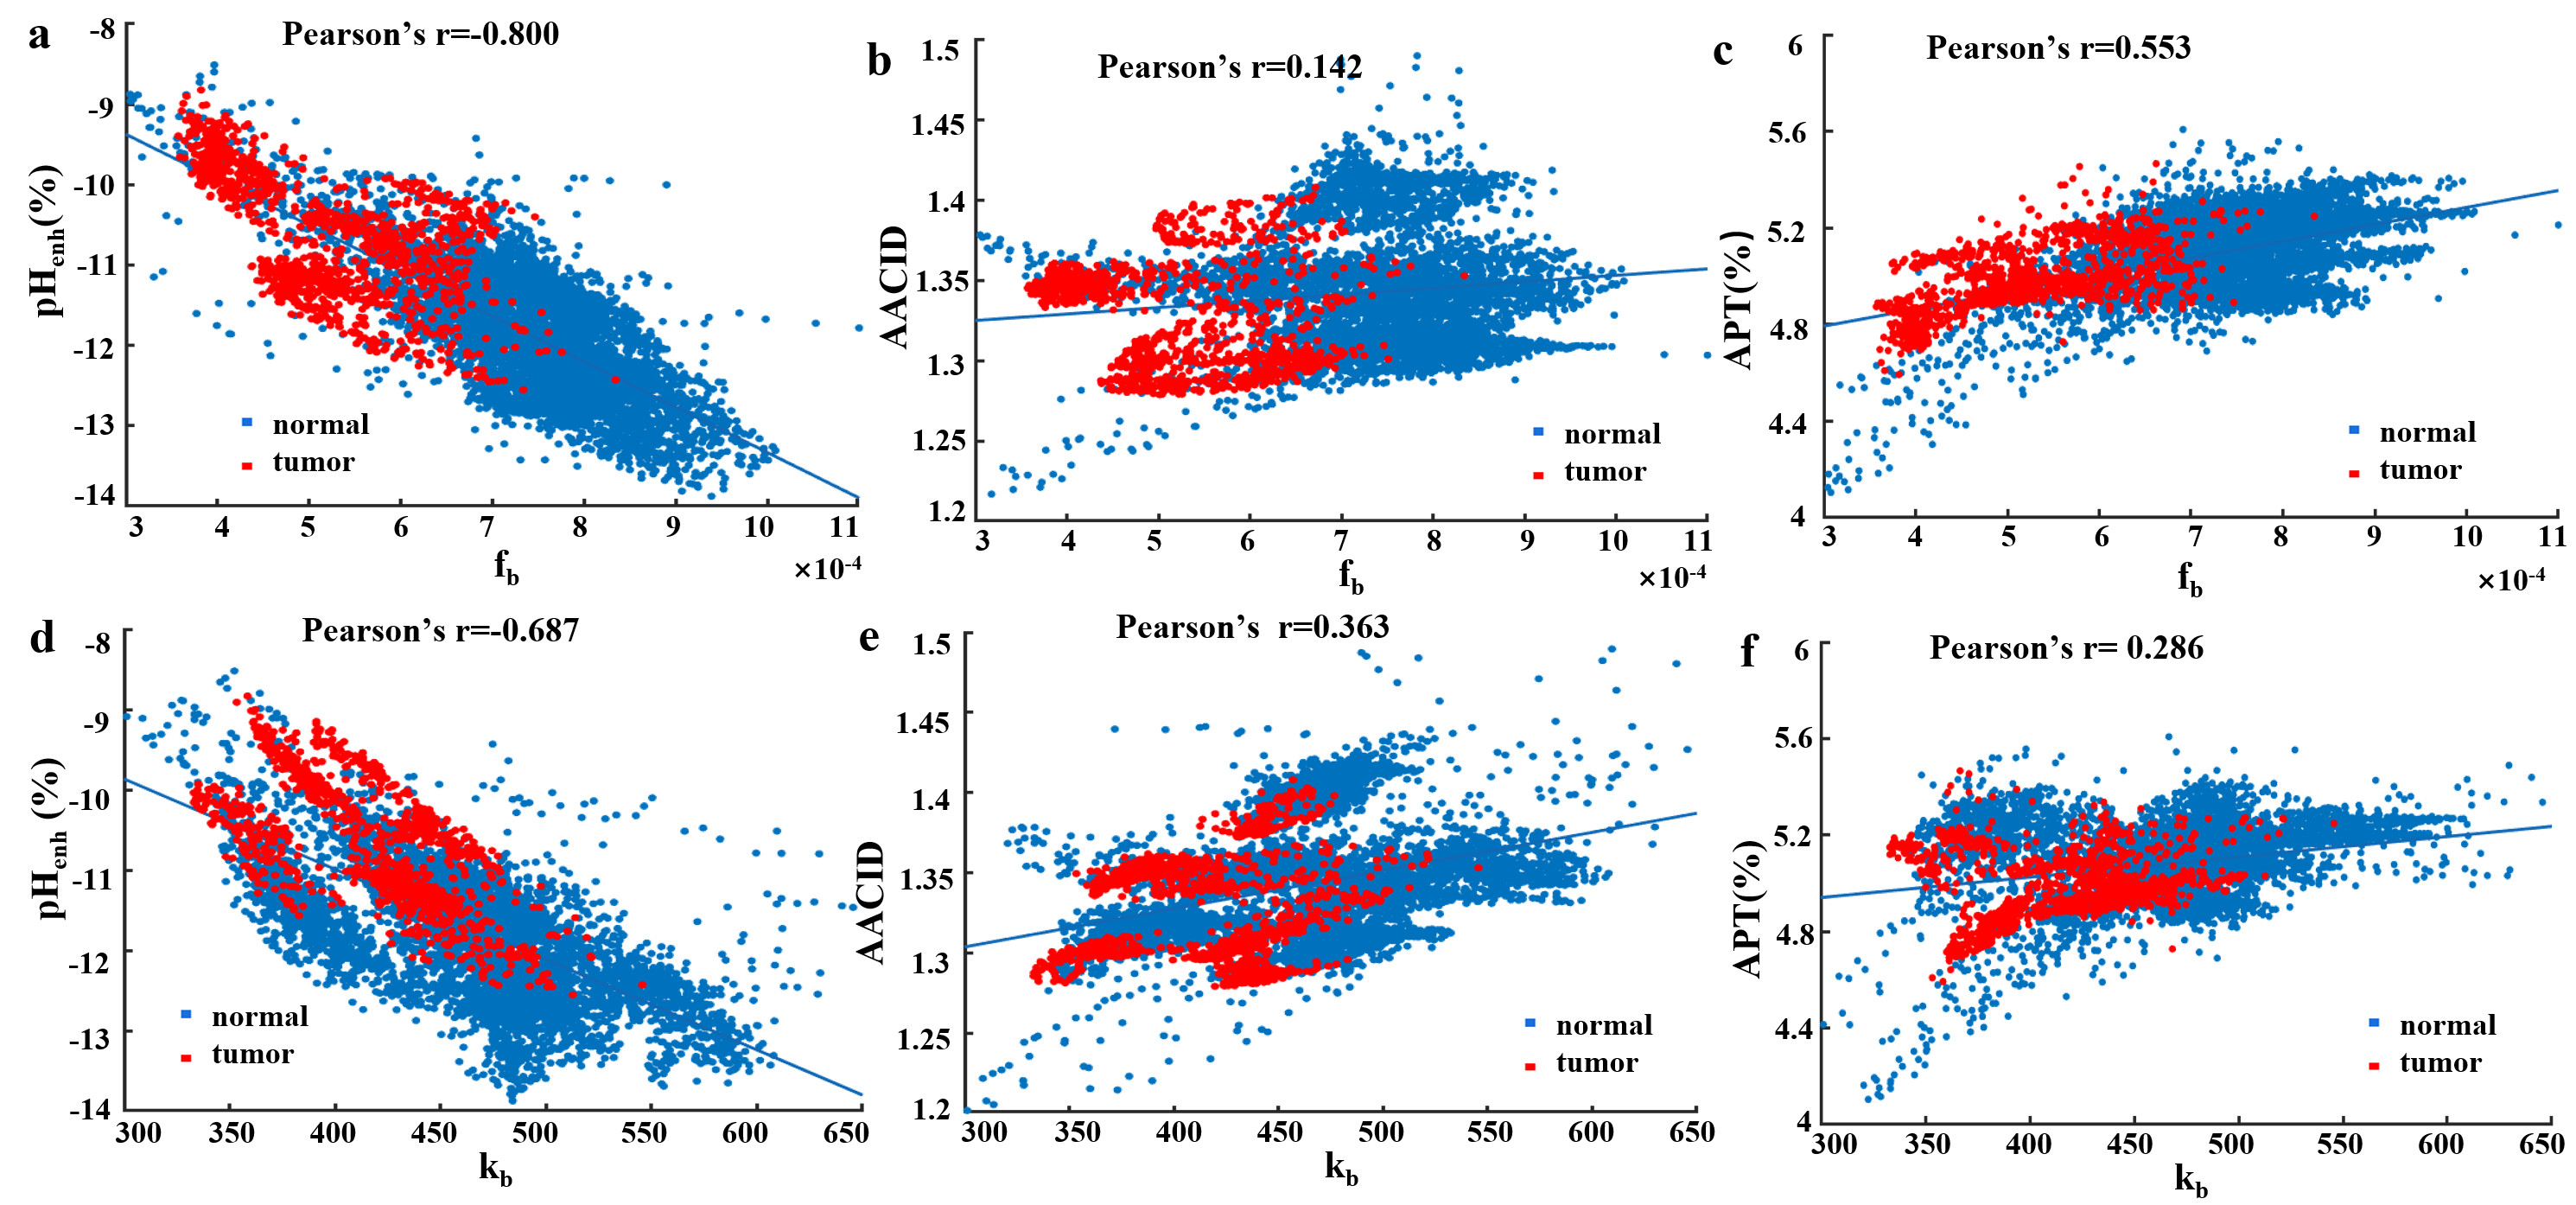
Fig. 3. Association between labile
proton
ratio (fb) , chemical exchange rate (kb) values and AACID (a) (d)
,pHenh
(b)
(e),
APT(c)
(f) values
of
all voxels in 6 mice brain from tumors (red points) and normal tissue (blue
points).