1466
Assessment of acquisition strategies of CEST MR fingerprinting pH imaging using Cramer-Rao Bound algorithm1Paul C. Lauterbur Research Center for Biomedical Imaging, Shenzhen Institutes of Advanced Technology, Chinese Academy of Sciences, Shenzhen, China, 2United Imaging Healthcare America, Houston, TX, United States
Synopsis
Optimization of acquisition strategies plays a key role in CEST-MRF imaging. However, an effective method to assess the performance of acquisition strategies in CEST quantification is lacking. In this study, we proposed a Cramer-Rao bound (CRB) based metric to measure the accuracy of CEST-MRF in pH quantification under various acquisition schemes. The results of both simulation and phantom experiments showed that the CRB-based index outperformed the conventionally used dictionary similarity metrics that are measured with dot products and Euclidean distance, implying that the proposed algorithm has great potential in optimizing CEST-MRF imaging for improved pH measurement.
Introduction
Magnetic resonance fingerprinting (MRF) is a new quantitative technique that uses pseudorandomized acquisition scheme to create unique signal trajectories for different tissue parameters,1 which has been applied to CEST imaging for reduced scan time and improved quantitation accuracy.2, 3 So far, various acquisition strategies were employed empirically, and their performance in CEST-MRF quantification remains to be elucidated. In this work, we proposed an algorithm that uses Cramer-Rao bound (CRB) based metric to evaluate the performance of acquisition strategies of CEST-MRF imaging in pH quantification with simulation and phantom experiments.Materials and methods
Theory: The CRB-based metric is designed as follows:$$CRB^{glob}=\frac{1}{N_{D}}\sum_{(i,j)\in\Omega}\sqrt{[V^{i,j}(\theta)]_{1,1}},$$
where, $$$V^{i,j}(\theta)=[I^{i,j}(\theta)]^{-1}$$$ denotes the CRB matrix and [Vi,j(θ)]1,1 is the first diagonal entry, for exchange rate is assigned as the first varying parameter. The set Ω contains all the dictionary indices and ND is the number of dictionary entries. θ contains the varying parameters in the dictionary, including exchange rate (kex) and proton concentration (fr). Let $$$I^{i,j}(\theta)=\sum_{l=1}^L[J^{i,j}_l(\theta)]^{T}J^{i,j}_l(\theta)$$$, and
$$$J^{i,j}_l(\theta)=[\frac{d^{i+1,j}[l]-d^{i,j}[l]}{\log{k_{ex}^{i+1,j}}-\log{k_{ex}^{i,j}}},\frac{d^{i,j+1}[l]-d^{i,j}[l]}{f_r^{i,j+1}-f_r^{i,j}}]$$$, where di,j[l] indicates the lth value of dictionary entries .
The CRB-based metric is compared with the metrics using dot products (DP) and Euclidean distance (ED) of dictionary entries and Frobenius norm, 4 which representing dictionary similarity.
Simulation: Performance of CRB-, DP- and ED-based metrics in assessing the accuracy of CEST-MRF in pH quantification was investigated and compared under different acquisition strategies of: (1) different exchange rates with noise contamination ; (2) randomized saturation powers (B1) from 0.2 to 1.5 μT, or saturation frequency offsets from 1.3 to 2.3 ppm, or saturation times in the range of 0-4 s, or recovery time from 1 to 6 s; (3) randomized B1 values with the maximum B1 value (B1max) ranging between 1 and 3 μT; (4) different acquired image number ranging from 2 to 30.
Monte Carlo (MC) method was used with white Gaussian noise of 40 dB added to the dictionary entry and the resulted trajectory was matched to the original dictionary. 5 Both the dot product and the Euclidean distance methods were employed for matching. 4 pH was quantified from the obtained exchange rates with the equation of 6:
$$pH\approx\log{k_{ex}}-4602.56\times(\frac{1}{298.15}-\frac{1}{T+273.15})+4.52,$$
where the simulated sample temperature T = 20℃. For each dictionary entry, this procedure was repeated 200 times and the root-mean-squared errors (RMSE) of pH were calculated.
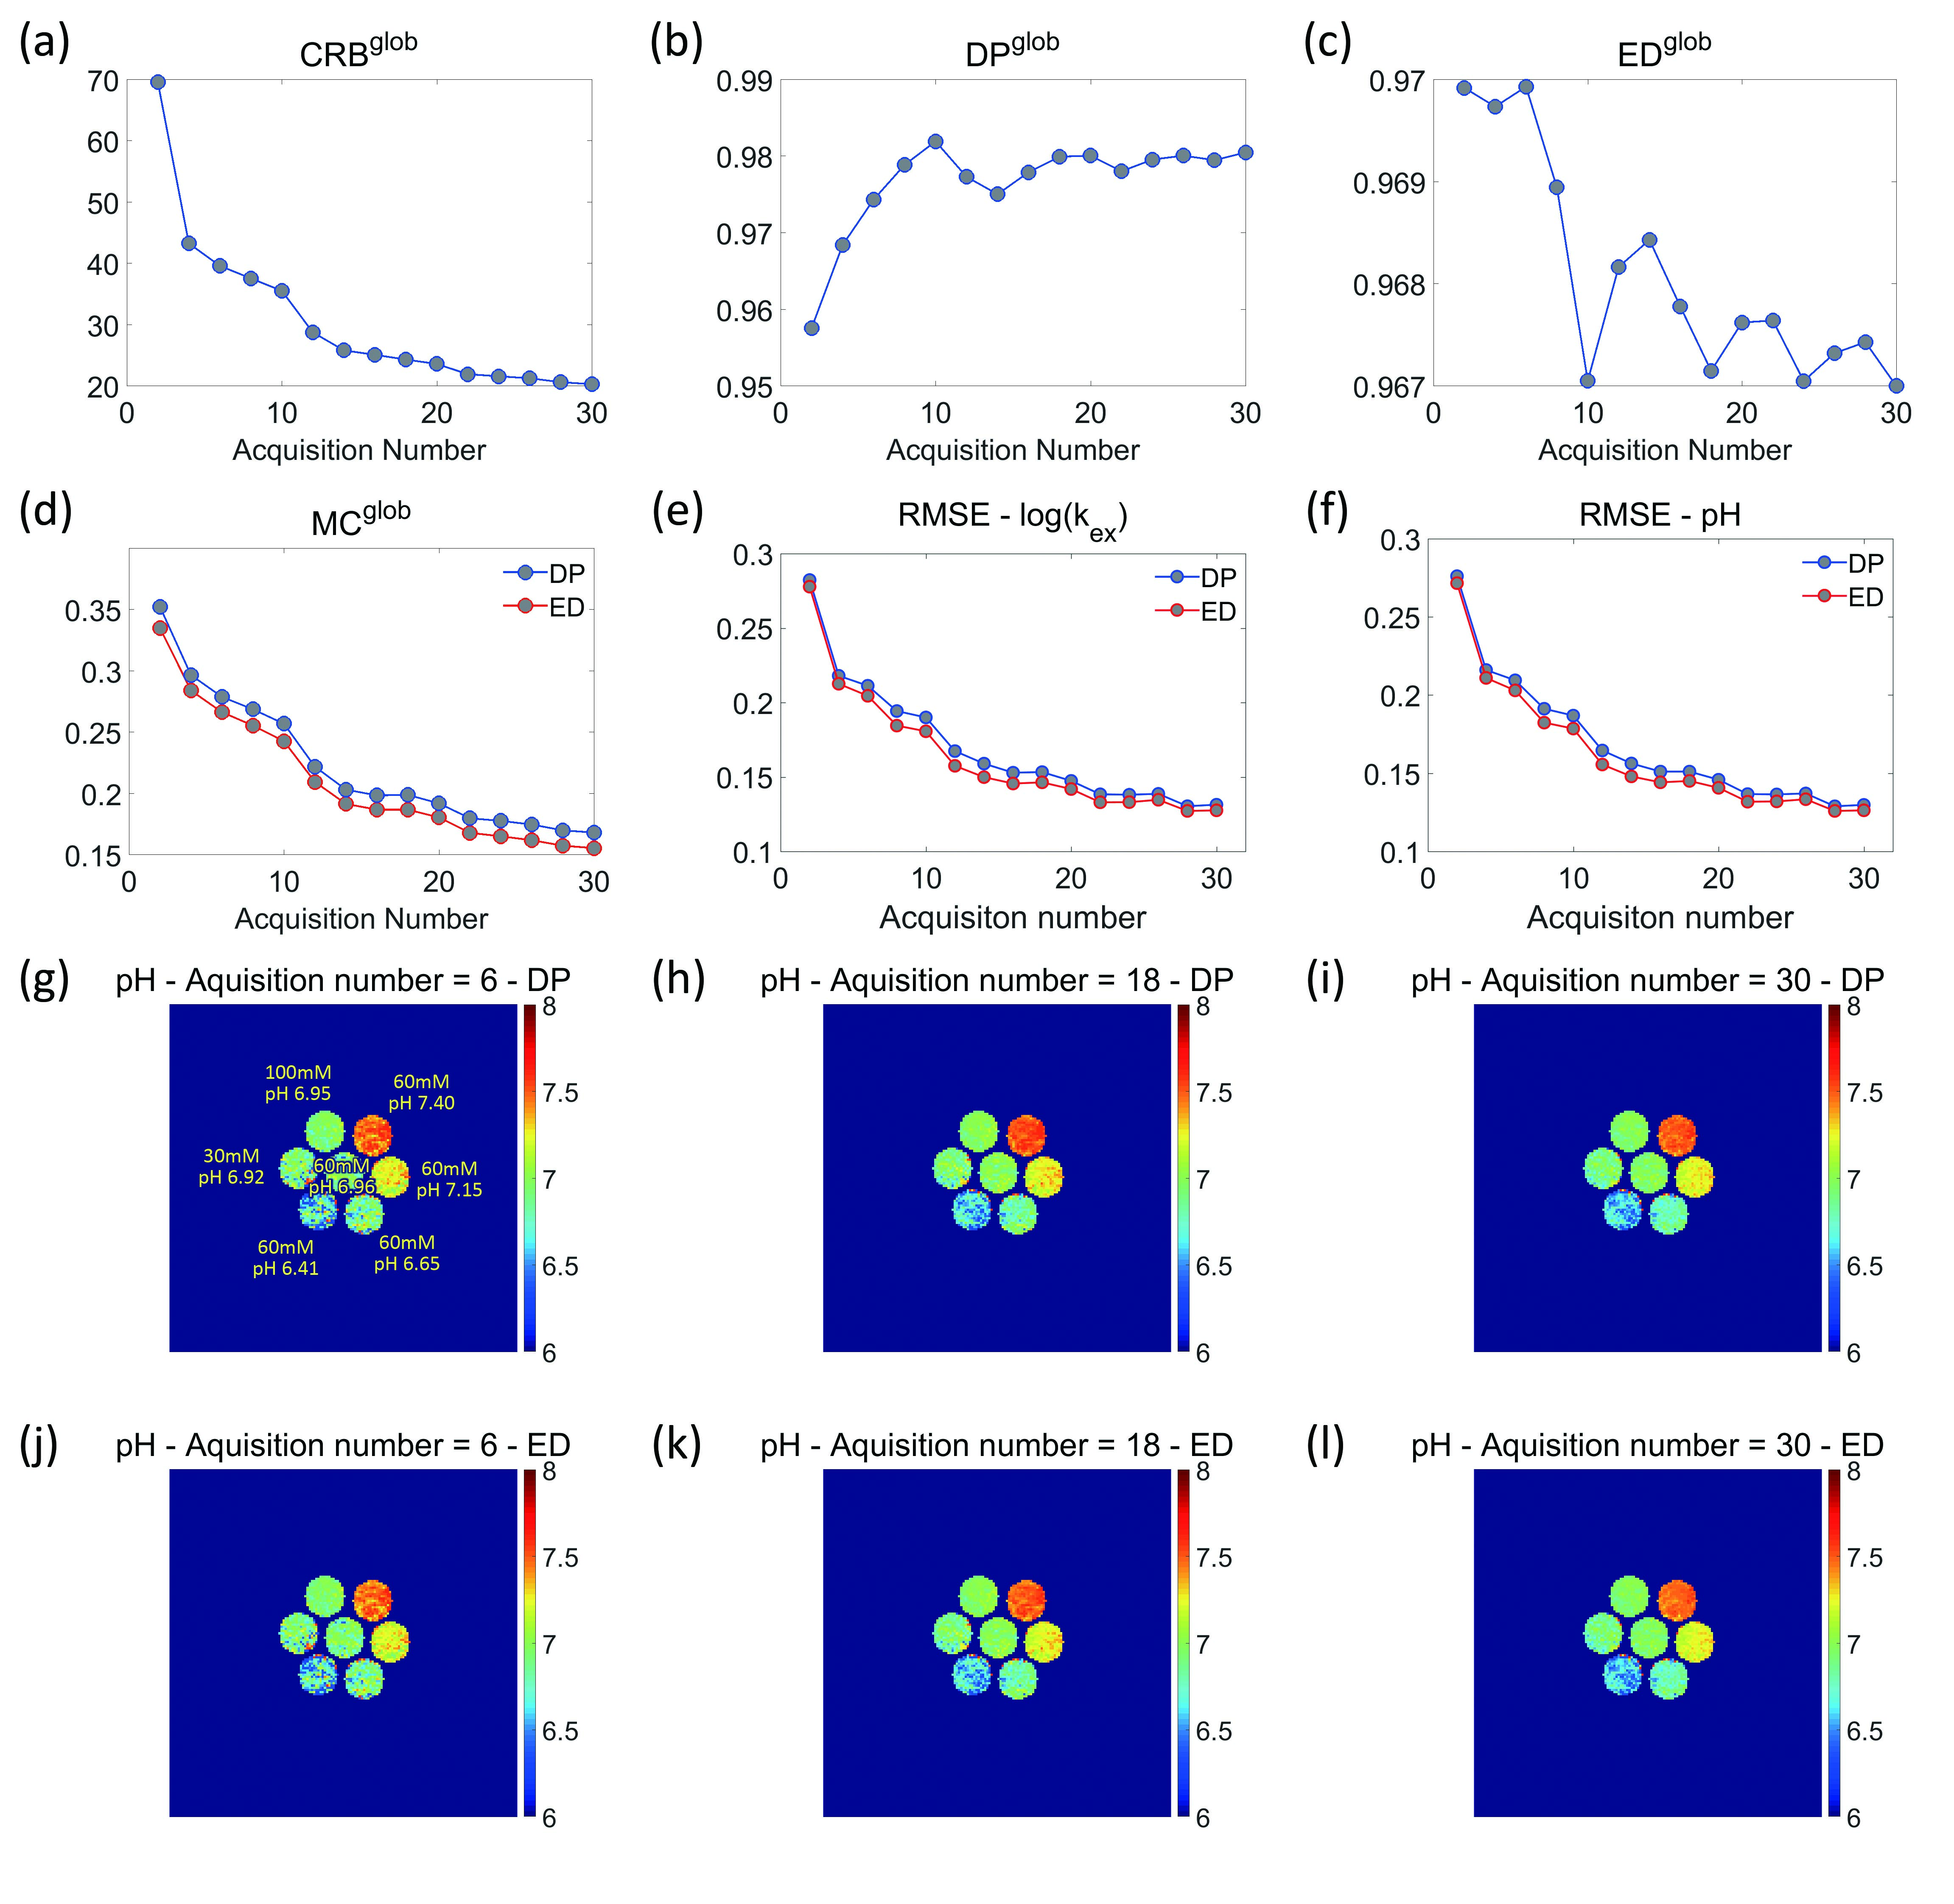
Phantom study: A phantom consisted of 7 vials containing creatine monohydrate solution with different pH and concentrations were prepared ( Fig.3g). CEST-MRF images were acquired with an single-shot FSE readout (flip angle = 160°; TE = 38 ms; slice thickness = 4 mm; in-plane resolution = 1.25 × 1.25 mm2) on a 3T scanner (uMR 790, Shanghai United Imaging Healthcare, Shanghai, China). The CEST preparation module consisted of 50-ms Gaussian saturation pulses with a 50% duty cycle. CEST effect of creatine were obtained using the asymmetric analysis, and then matched to the corresponding dictionary in a pixel-wise manner. The RMSE between the measured and titrated pH values were calculated.
Results and discussion
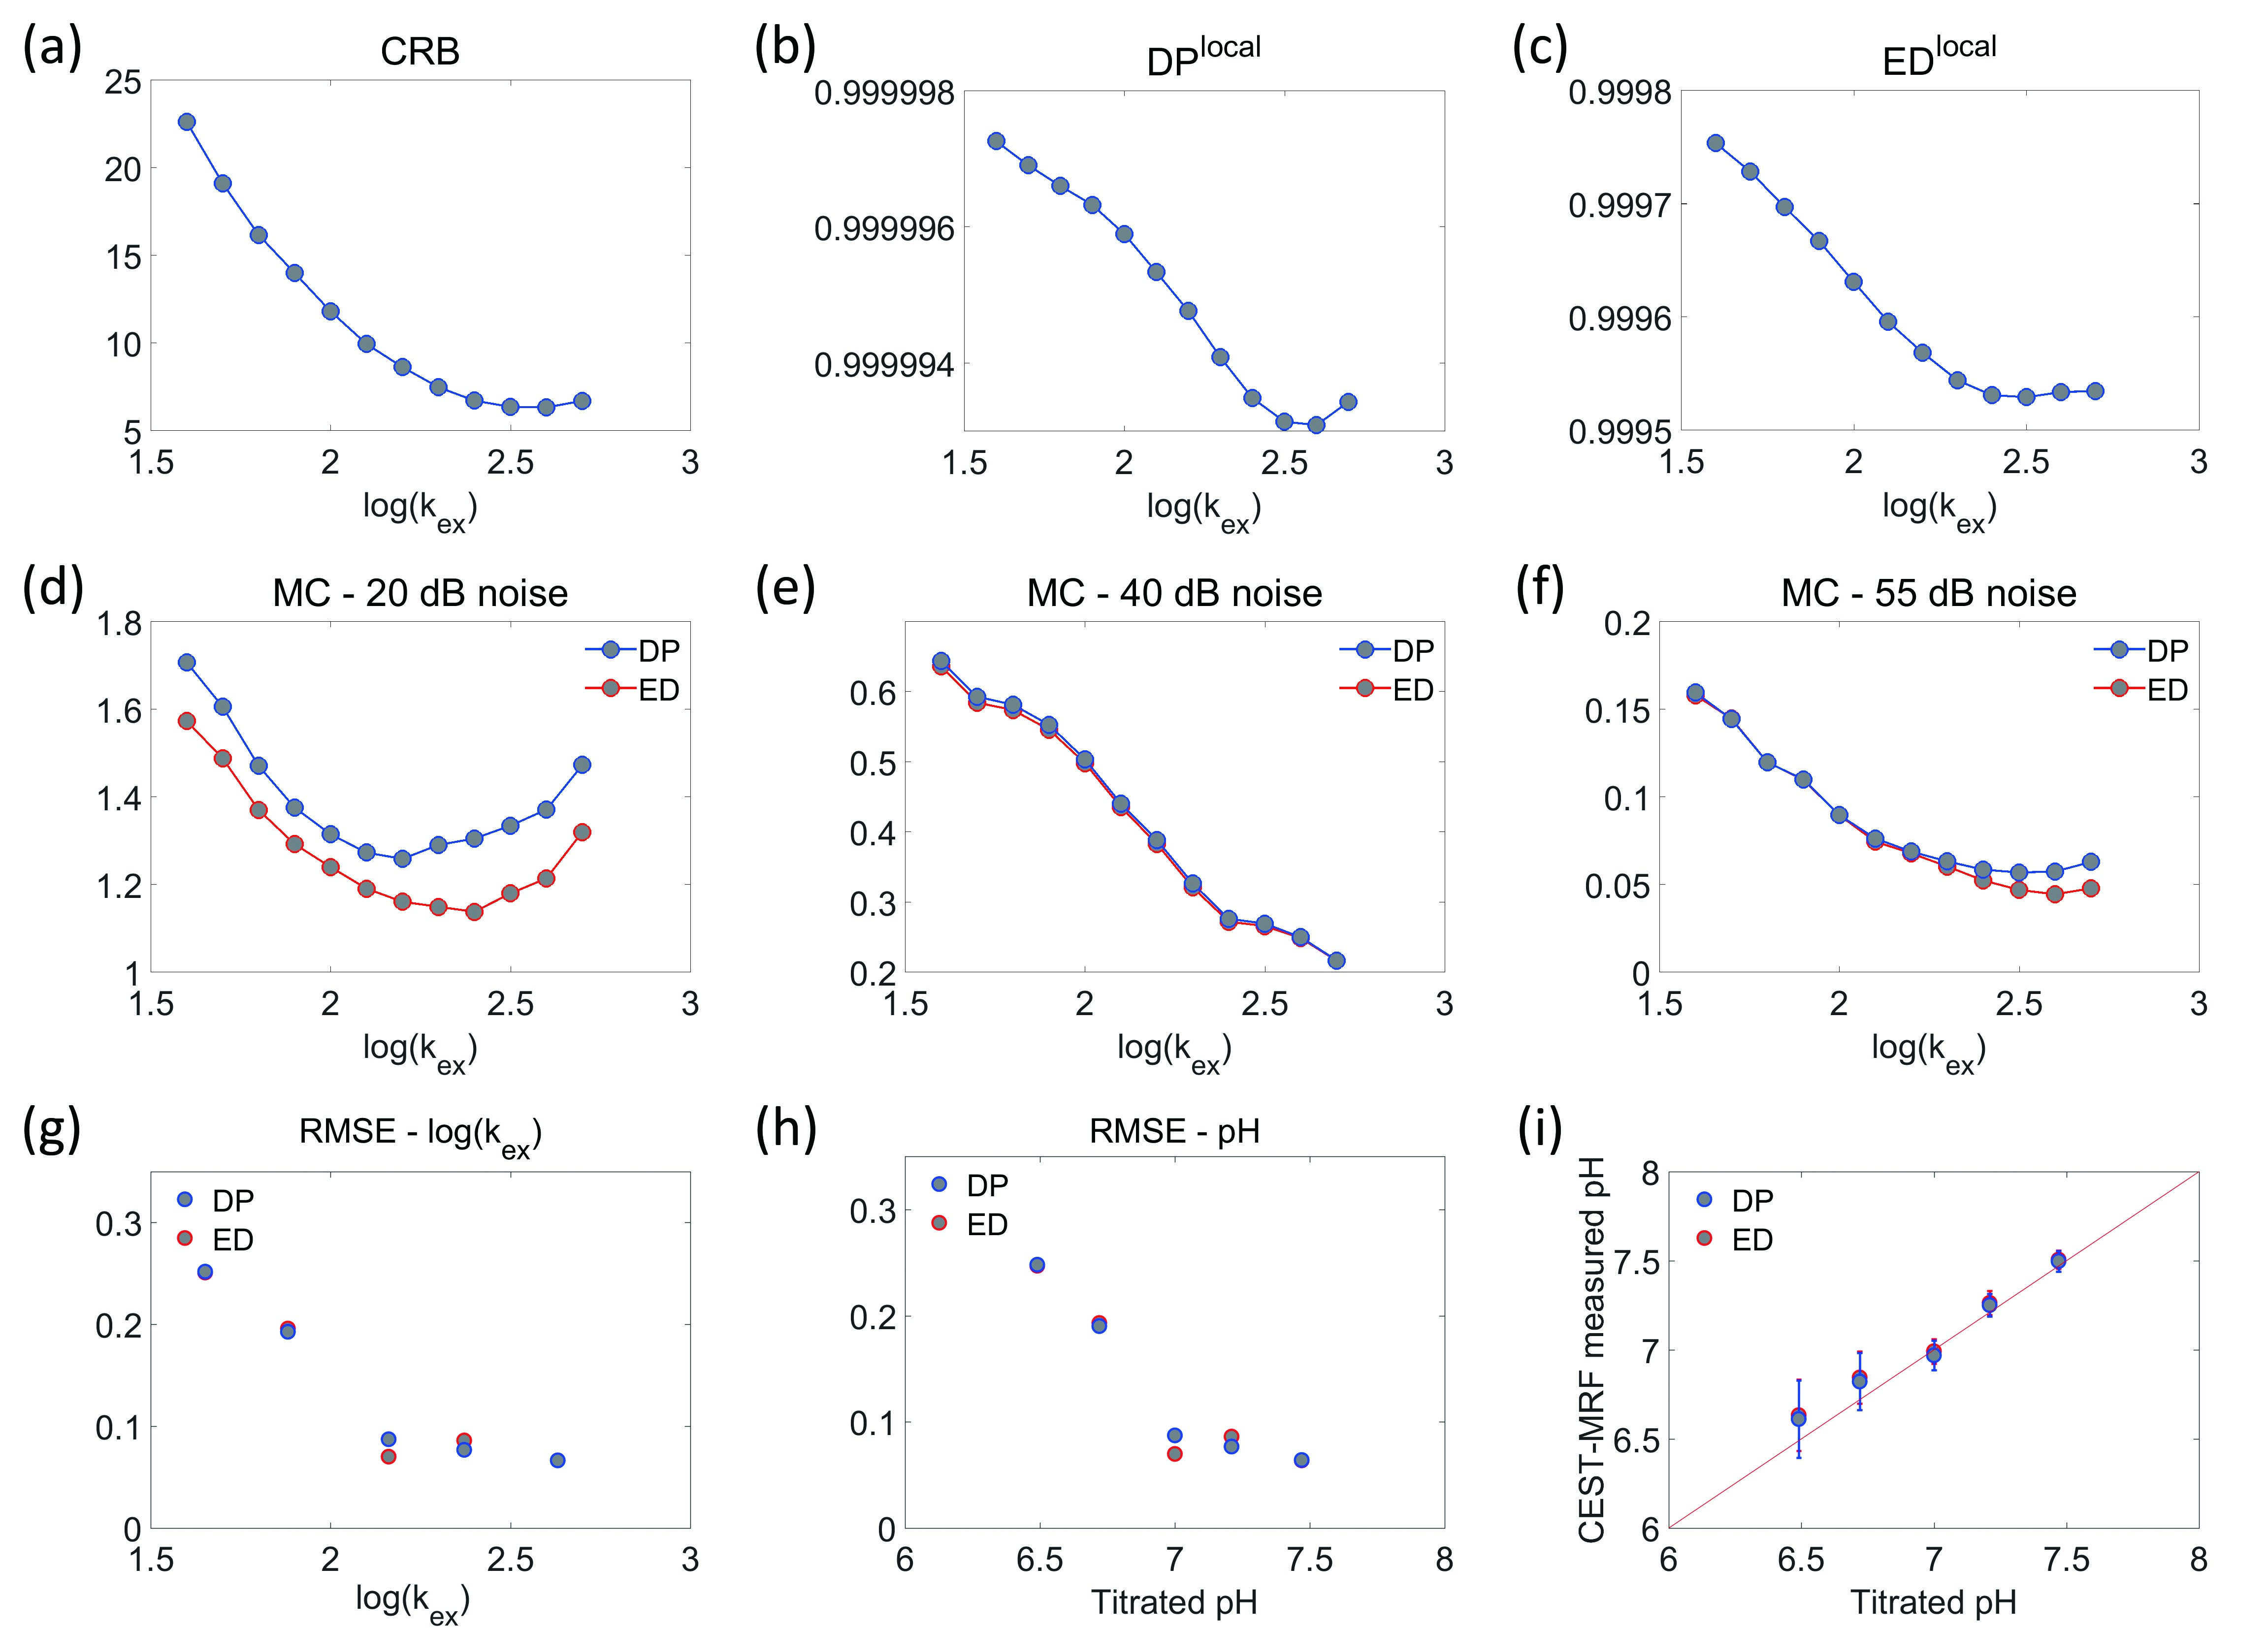
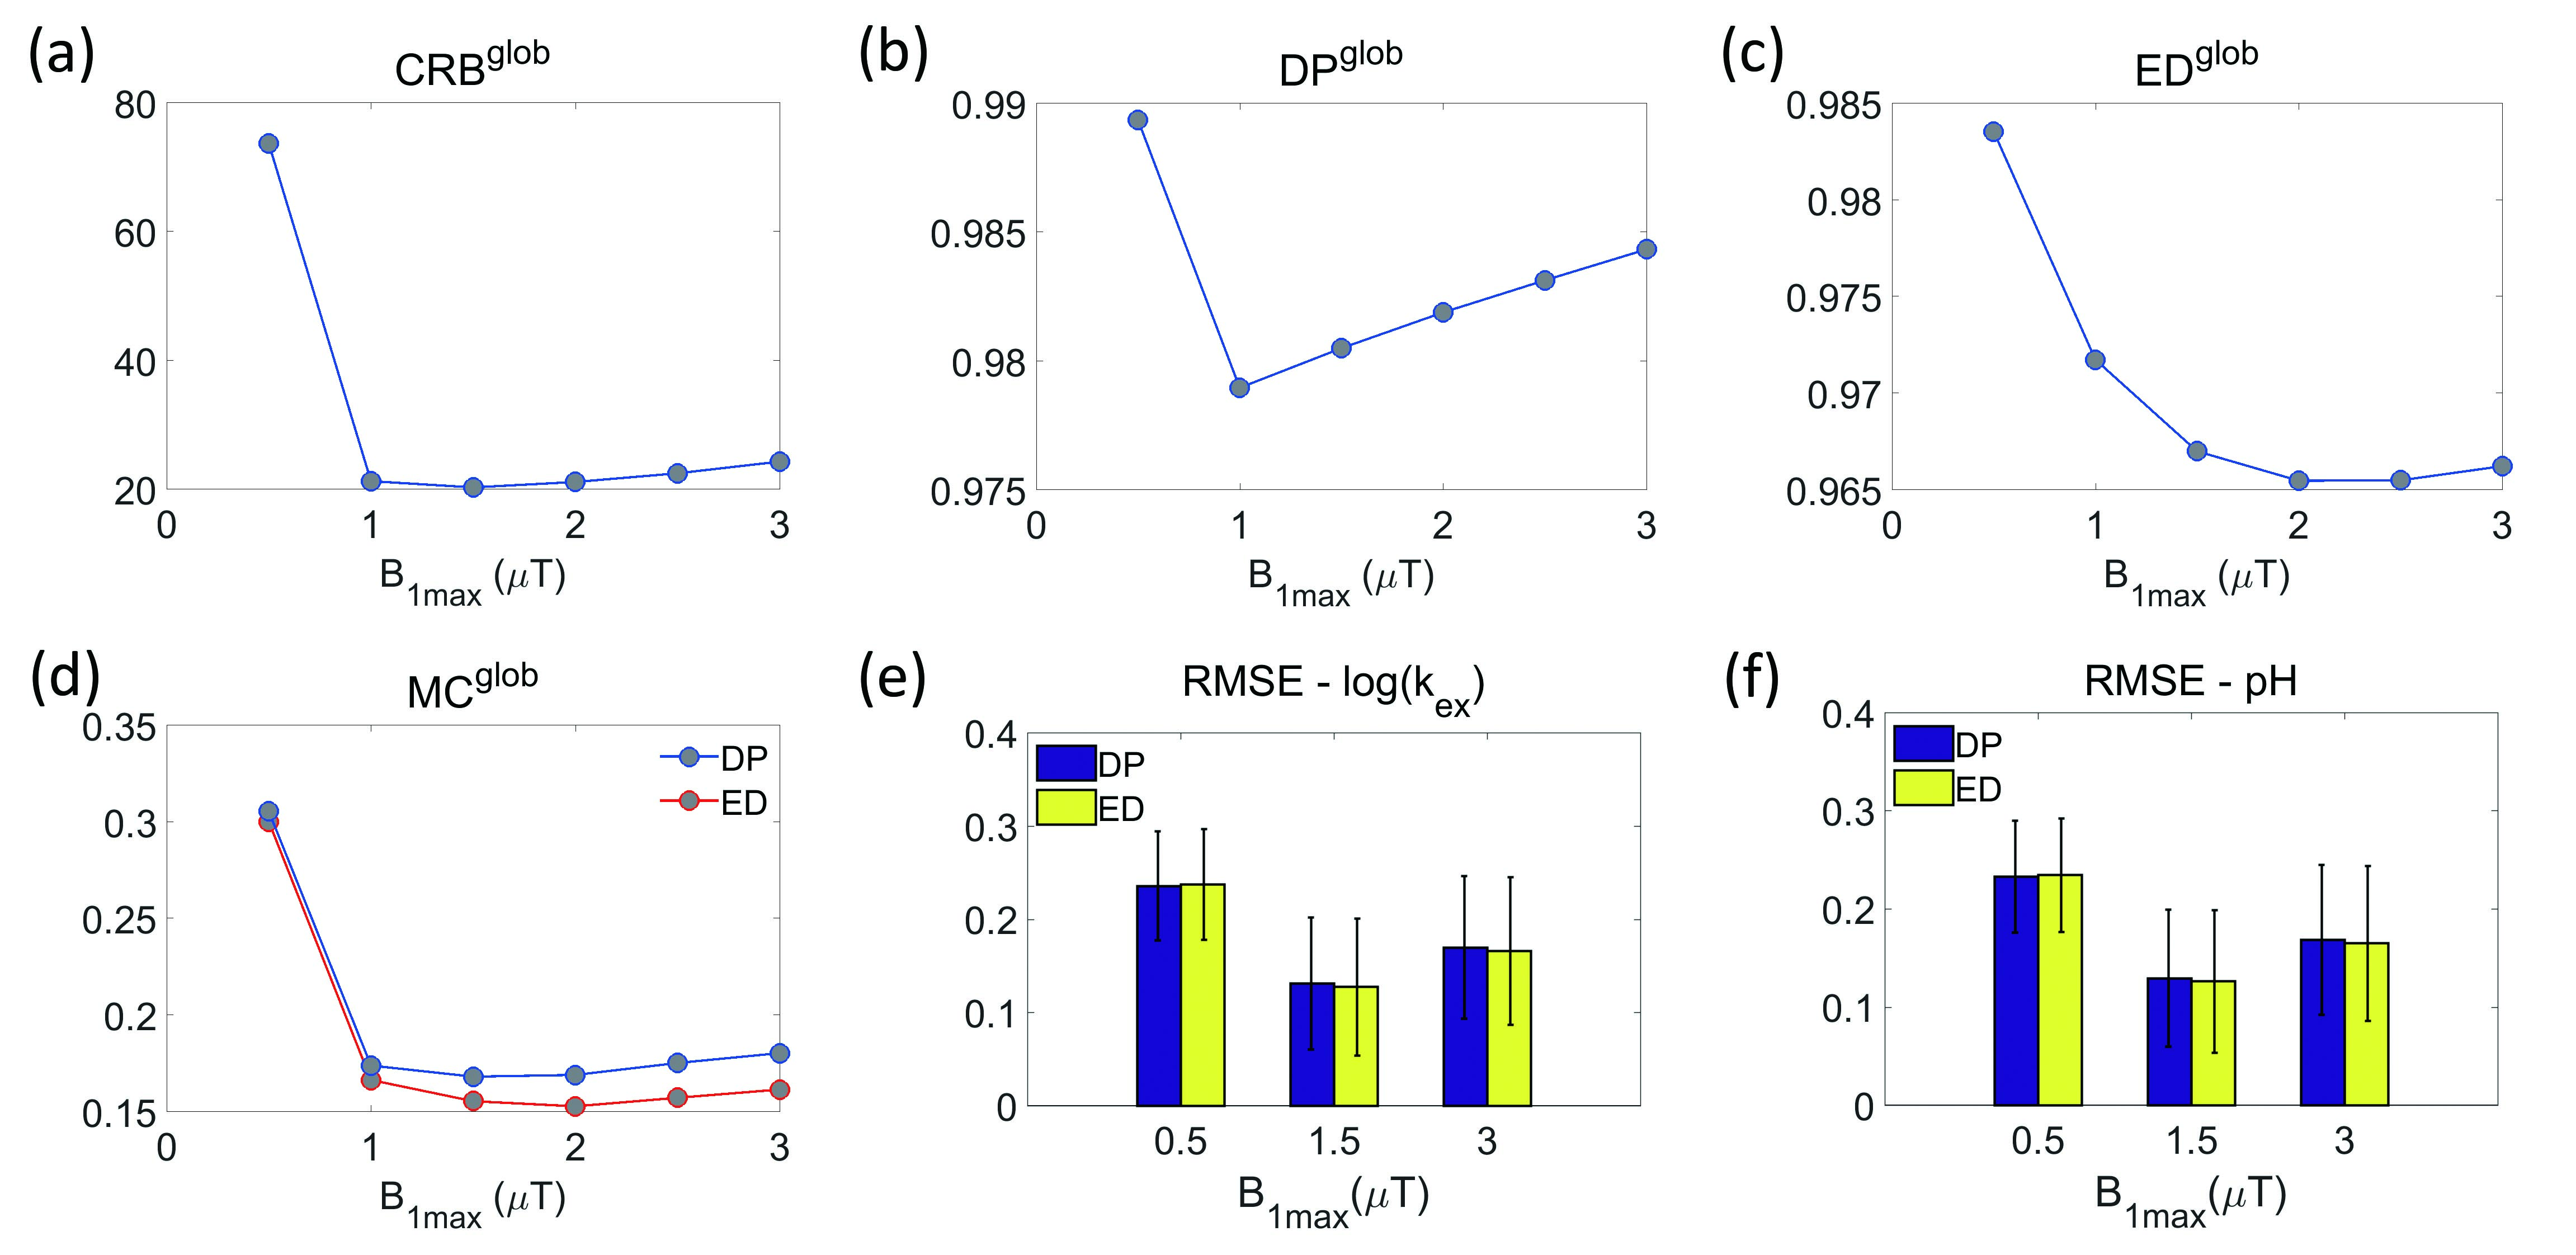
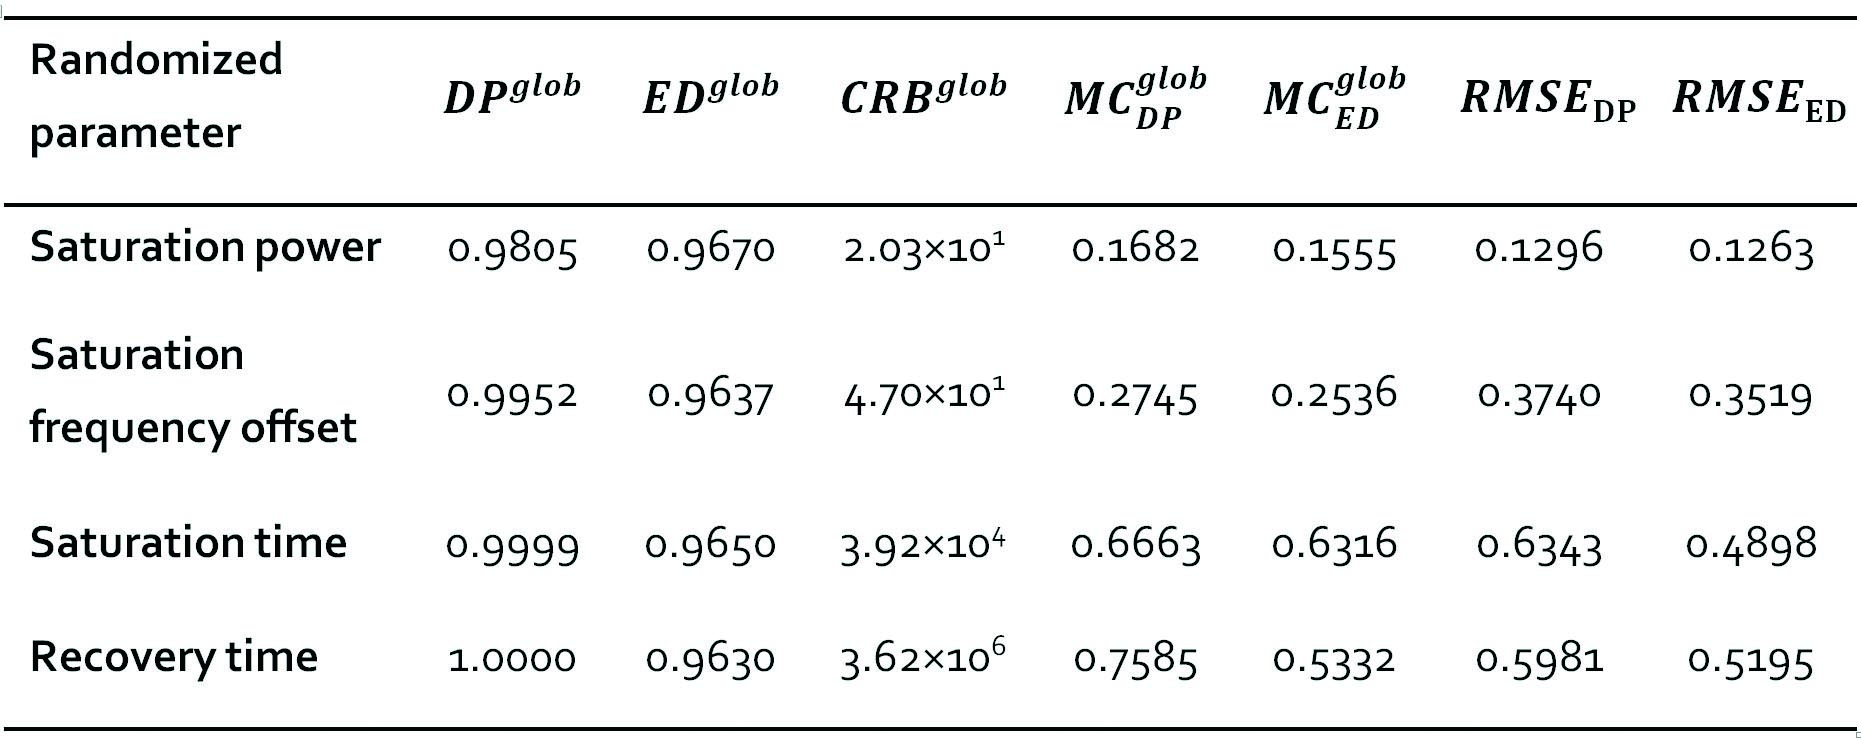
Figure 1a-c illustrate the alteration trend of CRB-, DP- and ED-based metrics with log (kex). Note that the greater the metric value is, the worse the kex/pH quantification would be. At a lower noise level of 55 dB (Fig.1f), the simulation results seemed matched the curve of CMR-based index better, whereas under higher noise level of 20 dB, inconsistency with the prediction of all three indexes appeared (Fig.1d). The noise in phantom study was approximately 40dB, where the overall trend of both simulation (Figure 1e) and phantom studies (Figure 1g-i) are generally similar as the prediction of metrics, indicating the metrics are still applicable. Both DP- and CRB-based assessment metrics showed good capability in evaluating different acquisition strategies in pH quantification (Table 1). The strategy of randomizing saturation power showed better performance than that of saturation frequency offset, in accordance with previous study. 7 For the acquisition strategy of randomized saturation time and recovery time, pH values could not be quantified correctly. In the case of evaluating strategies of different B1 ranges (Fig. 2), the curve of CBR-based metric was more consistent with the simulation results compared to DP- and ED-based metrics. Quantification errors in both the simulation and phantom studies decreased substantially with acquisition number increases (Fig. 3d-f), in consistent with the prediction of CRB-based metric (Fig. 3a). With fewer acquisition numbers (i.e., 6), pronounced noise can be observed in the pH map especially in vials with lower pH values (Fig. 3g). Accuracy of pH quantification was remarkably improved with acquisition number increases (Fig. 3h-i). It is worth noting that both DP-based and ED-based metrics failed to evaluate the performance of some acquisition strategies in pH quantification. One of the potential reasons may be that both DP- and ED- based index do not take noise propagation into account during the matching process, resulting in their value unrelated to the matching errors. On the contrary, the CRB measures the lower bound of variance of parameter estimation, which is closely associated with quantitative accuracy.Conclusion
The current study shows the performance of acquisition strategies of CEST-MRF can be effective predicted with the proposed CRB-based metric, which might facilitate optimization of imaging parameters for improved pH quantification.Acknowledgements
Grant Support: National Natural Science Foundation of China (81871348 and 91859102) and China Postdoctoral Science Foundation (2019M663186).References
[1] Ma D, Gulani V, Seiberlich N, Liu K, Sunshine JL, Duerk JL, et al. Magnetic resonance fingerprinting. Nature. 2013;495(7440):187-92.
[2] Cohen O, Huang S, McMahon MT, Rosen MS, Farrar CT. Rapid and quantitative chemical exchange saturation transfer (CEST) imaging with magnetic resonance fingerprinting (MRF). Magnetic Resonance in Medicine. 2018;80(6):2449-63.
[3] Zhou Z, Han P, Zhou B, Christodoulou AG, Shaw JL, Deng Z, et al. Chemical exchange saturation transfer fingerprinting for exchange rate quantification. Magnetic Resonance in Medicine. 2018;80(4):1352-63.
[4] Perlman O, Herz K, Zaiss M, Cohen O, Rosen MS, Farrar CT. CEST MR-Fingerprinting: Practical considerations and insights for acquisition schedule design and improved reconstruction. Magnetic Resonance in Medicine. 2020;83(2):462-78.
[5] Sommer K, Amthor T, Doneva M, Koken P, Meineke J, Börnert P. Towards predicting the encoding capability of MR fingerprinting sequences. Magnetic Resonance Imaging. 2017;41:7-14.
[6] Goerke S, Zaiss M, Bachert P. Characterization of creatine guanidinium proton exchange by water-exchange (WEX) spectroscopy for absolute-pH CEST imaging in vitro. NMR in Biomedicine. 2014;27(5):507-18.
[7] Huang S, Cohen O, McMahon MT, Kim Y, Rosen M, Farrar CT, editors. Quantitative chemical exchange saturation transfer (CEST) imaging with magnetic resonance fingerprinting (MRF). Proceedings of the 25th Annual Meeting of ISMRM, Honolulu, HI; 2017.
Figures