1464
7 tricks for 7T CEST: improving the reproducibility of multi-pool evaluation1Department of Neuroradiology, University Hospital of Erlangen, FAU Erlangen-Nürnberg, Erlangen, Germany, 2High-field Magnetic Resonance Center, Max Planck Institute for Biological Cybernetics, Tübingen, Germany, 3Institute of Radiology, University Hospital of Erlangen, FAU Erlangen-Nürnberg, Erlangen, Germany, 4Institute of Neuropathology, University Hospital of Erlangen, FAU Erlangen-Nürnberg, Erlangen, Germany, 5Department of Neurology, Epilepsy Centre, University Hospital of Erlangen, FAU Erlangen-Nürnberg, Erlangen, Germany
Synopsis
With the help of the presented post-processing procedure, it is possible to obtain an increased reproducibility. For the amide contrast, the CoV decreased from 4% to less than 1.2 %.
INTRODUCTION
Chemical exchange saturation transfer (CEST) MR imaging is an emerging method of growing importance in the field of medical imaging of focal and non-focal pathologies. CEST MRI is based on the effect of exchange between the water protons and protons in different molecular environments such as amide and amine and is dependent on insightful medical parameters like pH,1 folding status of the peptides2 or proteomic mobility changes.3 The reproducibility is crucial to gain information on differences between patient and control groups, in focal as well as non-focal pathologies. Even minor motion and B0 artifacts can lead to pseudo effects in the final metabolite contrast if not corrected.4 The generation of CEST spectra requires several post-processing steps. By improving each step of the post-processing procedure, the reproducibility can be increased, which is an important step preceding larger cohort studies and clinical application. Here, we analyzed and optimized the motion correction, the normalization, B0 correction and interpolation, B1 correction, and the Lorentzian fitting.METHODS
Two measurement groups of in total eight healthy subjects were measured after written informed consent at a Siemens MAGNETOM Terra 7T scanner. The first group consists of three independent direct consecutive measurements of a 55-year-old male subject. The second measurement group consists of seven male subjects with an average age of 25 years. Homogeneous MIMOSA pre-saturation was realized (120 pulses, tp:15 ms, td:10 ms (DC=60.56%)), at two B1 levels 0.72 and 1.00 µT.5 56 off-resonance frequencies were distributed non-equidistantly between -150 and 150 ppm, with 41 frequencies in finer intervals between -5 and 5 ppm and two M0 scans. CEST image readout was a centric 3D snapshot GRE.6 The slab selective data was corrected for motion, B0 corrected, normalized, denoised, and B1 corrected. The corrected Z-spectrum of the low B1 was used for further analysis. Subsequently, the data were fitted with a five-pool (Water, Amide(APT), Amine, NOE, MT) Lorentz fit model (LFM).7 The Lorentz fit models differ in their initial and boundary conditions. CEST data were averaged within the brain gray matter segment generated with SPM.8 The standard deviation was calculated over all subjects for every method and fit model. We focused herein on the amide and NOE contrasts.9 The coefficient of variation error (CoV) (standard deviation divided by mean value) was determined over all subjects. The improved pipeline was used to analyze CEST data of an epilepsy-associated tumor.RESULTS
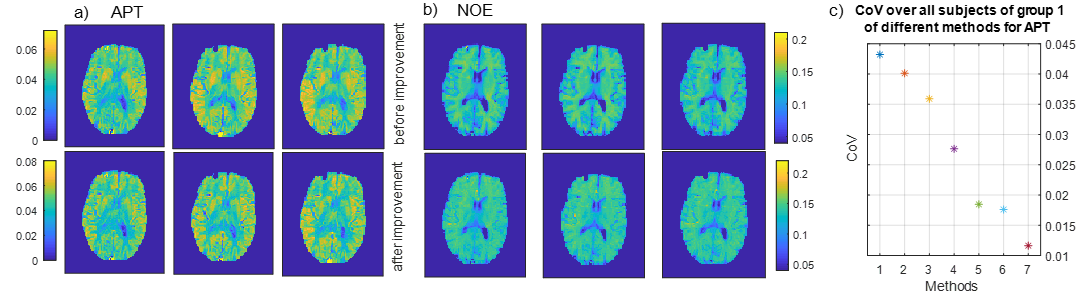
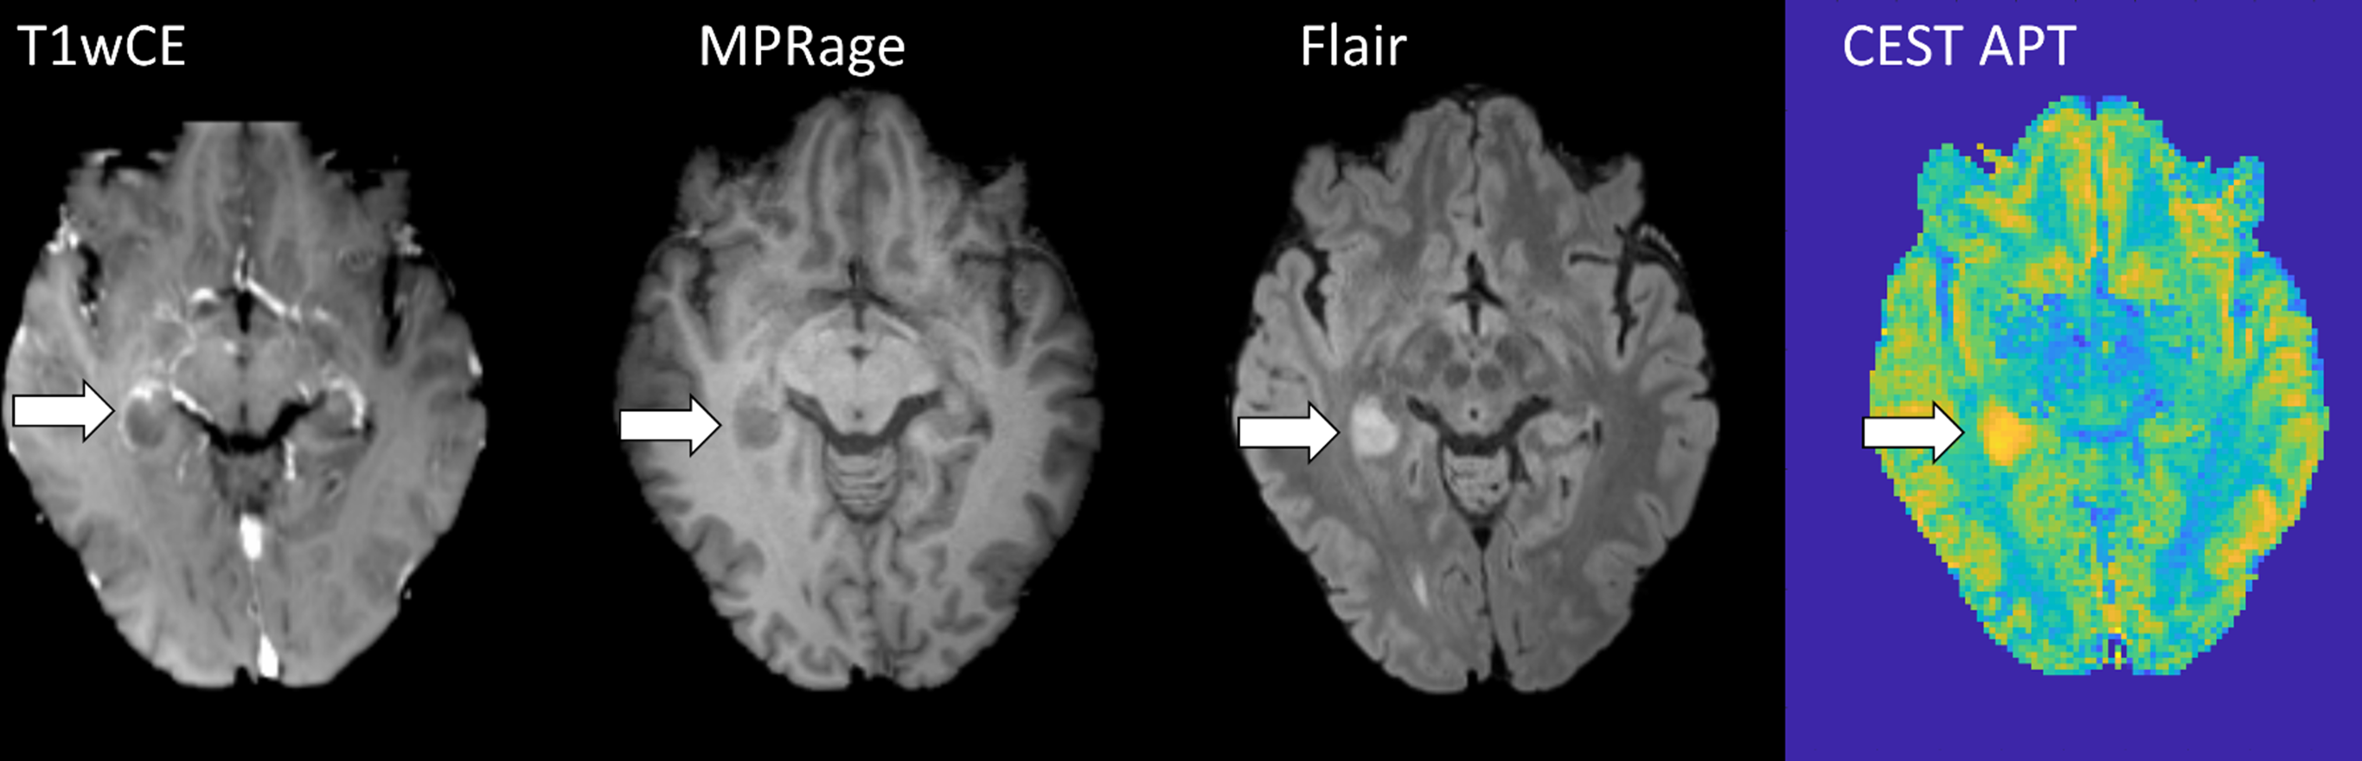
We propose a CEST data evaluation with good reproducibility by using a motion correction with SPM using as reference the image at 3.5 ppm, interpolation of motion around the water peak, a B0 correction with a spline interpolation parameter 0.999, and a two-point normalization. Finally, a linear interpolation between two B1 power levels of 0.72 and 1.0μT with subsequent five pool Lorentz fit yields the contrasts of water, APT, NOE, MT, and amines. The contrast maps of NOE and APT of one slice are shown in Figure 1a+1b before and after the improved pipeline, which demonstrates smaller deviations between the measurements. The NOE contrast between gray and white matter is lower due to the normalization (Figure 1b). The method with the smallest CoV gives the best reproducibility. The improvement of each step from naïve to the final method is given by the decreasing of the CoV (Figure 1c). The results of the first measurement group provide the reproducibility within one subject and form the first benchmark. For the first group, a CoV of 1.2 % for the amide contrast (Figure 1c) and 0.33 % for NOE contrast is achieved. The results could be verified in the second inter-subject group, where a CoV of 0.99 % for the amide contrast and less than 2.1 % for NOE contrast was achieved. The CEST-APT image in the patient (Figure 2) shows the epilepsy-associated brain tumor hyper-intense, indicating a high-grade glioma in coherence with previous 7T work.9 Using conventional clinical data, the tumor was initially diagnosed as low grade, but finally histologically proven to be an IDH-wild type glioblastoma.DISCUSSION
To optimize the CEST postprocessing pipeline regarding the reproducibility of the multi-pool evaluation, we combined refined standard and new recently investigated7,10 single postprocessing improvements. In general, for the same acquired data, the reproducibility can be increased by a factor of 4 solely by improving simple post-processing steps such as motion correction and normalization. The example CEST APT image of a high-grade tumor demonstrates the clinical applicability of the improved postprocessing pipeline.CONCLUSION
With the help of the presented post-processing procedure, it is possible to obtain an increased reproducibility. The CoV decreased from 4% to less than 1.2 % for the amide contrast.Acknowledgements
No acknowledgement found.References
1. Arena F, Irrera P, Consolino L, Colombo Serra S, Zaiss M, Longo DL. Flip-angle based ratiometric approach for pulsed CEST-MRI pH imaging. J Magn Reson. 2018;287:1-9.
2. Zaiss M, Kunz P, Goerke S, Radbruch A, Bachert P. MR imaging of protein folding in vitro employing nuclear-Overhauser-mediated saturation transfer. NMR Biomed. 2013;26(12):1815-1822.
3. Goerke S, Breitling J, Zaiss M, et al. Dual-frequency irradiation CEST-MRI of endogenous bulk mobile proteins. NMR Biomed. 2018;31(6):e3920.
4. Zaiss M, Herz K, Deshmane A, et al. Possible artifacts in dynamic CEST MRI due to motion and field alterations. J Magn Reson. 2019;298:16-22.
5. Liebert A, Zaiss M, Gumbrecht R, et al. Multiple interleaved mode saturation (MIMOSA) for B(1) (+) inhomogeneity mitigation in chemical exchange saturation transfer. Magn Reson Med. 2019;82(2):693-705.
6. Zaiss M, Ehses P, Scheffler K. Snapshot-CEST: Optimizing spiral-centric-reordered gradient echo acquisition for fast and robust 3D CEST MRI at 9.4 T. NMR Biomed. 2018;31(4):e3879.
7. Windschuh J, Zaiss M, Meissner JE, et al. Correction of B1-inhomogeneities for relaxation-compensated CEST imaging at 7 T. NMR Biomed. 2015;28(5):529-537.
8. Guo C, Ferreira D, Fink K, Westman E, Granberg T. Repeatability and reproducibility of FreeSurfer, FSL-SIENAX and SPM brain volumetric measurements and the effect of lesion filling in multiple sclerosis. Eur Radiol. 2019;29(3):1355-1364.
9. Paech D, Windschuh J, Oberhollenzer J, et al. Assessing the predictability of IDH mutation and MGMT methylation status in glioma patients using relaxation-compensated multipool CEST MRI at 7.0 T. Neuro Oncol. 2018;20(12):1661-1671.
10. Zhang Y, Heo HY, Lee DH, et al. Selecting the reference image for registration of CEST series. J Magn Reson Imaging. 2016;43(3):756-761.
Figures