1463
Mapping of intracellular pH in vivo using amide and guanidyl CEST-MRI at 9.4 T1Division of Medical Physics in Radiology, German Cancer Research Center (DKFZ), Heidelberg, Germany, 2Center for Preclinial Research, Core Facility Tumor Models, German Cancer Research Center (DKFZ), Heidelberg, Germany, 3Division of Molecular Embryology, German Cancer Research Center (DKFZ), Heidelberg, Germany
Synopsis
In this study, we present a method for mapping intracellular pH values based on amide and guanidyl CEST-MRI which simultaneously compensates for concentration changes, the semi-solid magnetization transfer, and spillover dilution. Compensation of the concomitant effects and calculation of reliable pH maps in the range of pH 6.5-7.5 was verified experimentally in porcine brain lysates. Applicability in vivo was demonstrated in the lesions of three tumor-bearing mice showing an average intracellular pH of approximately 7. Consequently, endogenous amide and guanidyl signal-based mapping of the intracellular pH is now applicable for tumor imaging which was previously prevented by the concomitant effects.
Introduction
Intracellular pH is a valuable marker for cancer as it is known to be increased in tumors. In principle, high-resolution imaging of the intracellular pH is feasible by means of the endogenous amide and guanidyl CEST signals which originate mainly from proteins and metabolites within cells.1 To separate the pH-dependency from concomitant effects, such as concentration changes, several approaches have already been proposed.2–8 However, state-of-the-art methods do not allow for simultaneous compensation of concentration changes, along with superimposing CEST signals, the semi-solid magnetization transfer (ssMT), and spillover dilution, which can all strongly vary within tumors.9 Therefore, the aim of this study was to develop a method for mapping of the intracellular pH based on amide and guanidyl CEST-MRI applicable for tumor imaging in vivo. This was realized at 9.4 T by a ratiometric approach with two different B12,3 in combination with the inverse metric (i.e. MTRRex)10 and a two-step polynomial Lorentzian-fit11 of the amide and guanidyl signal.Methods
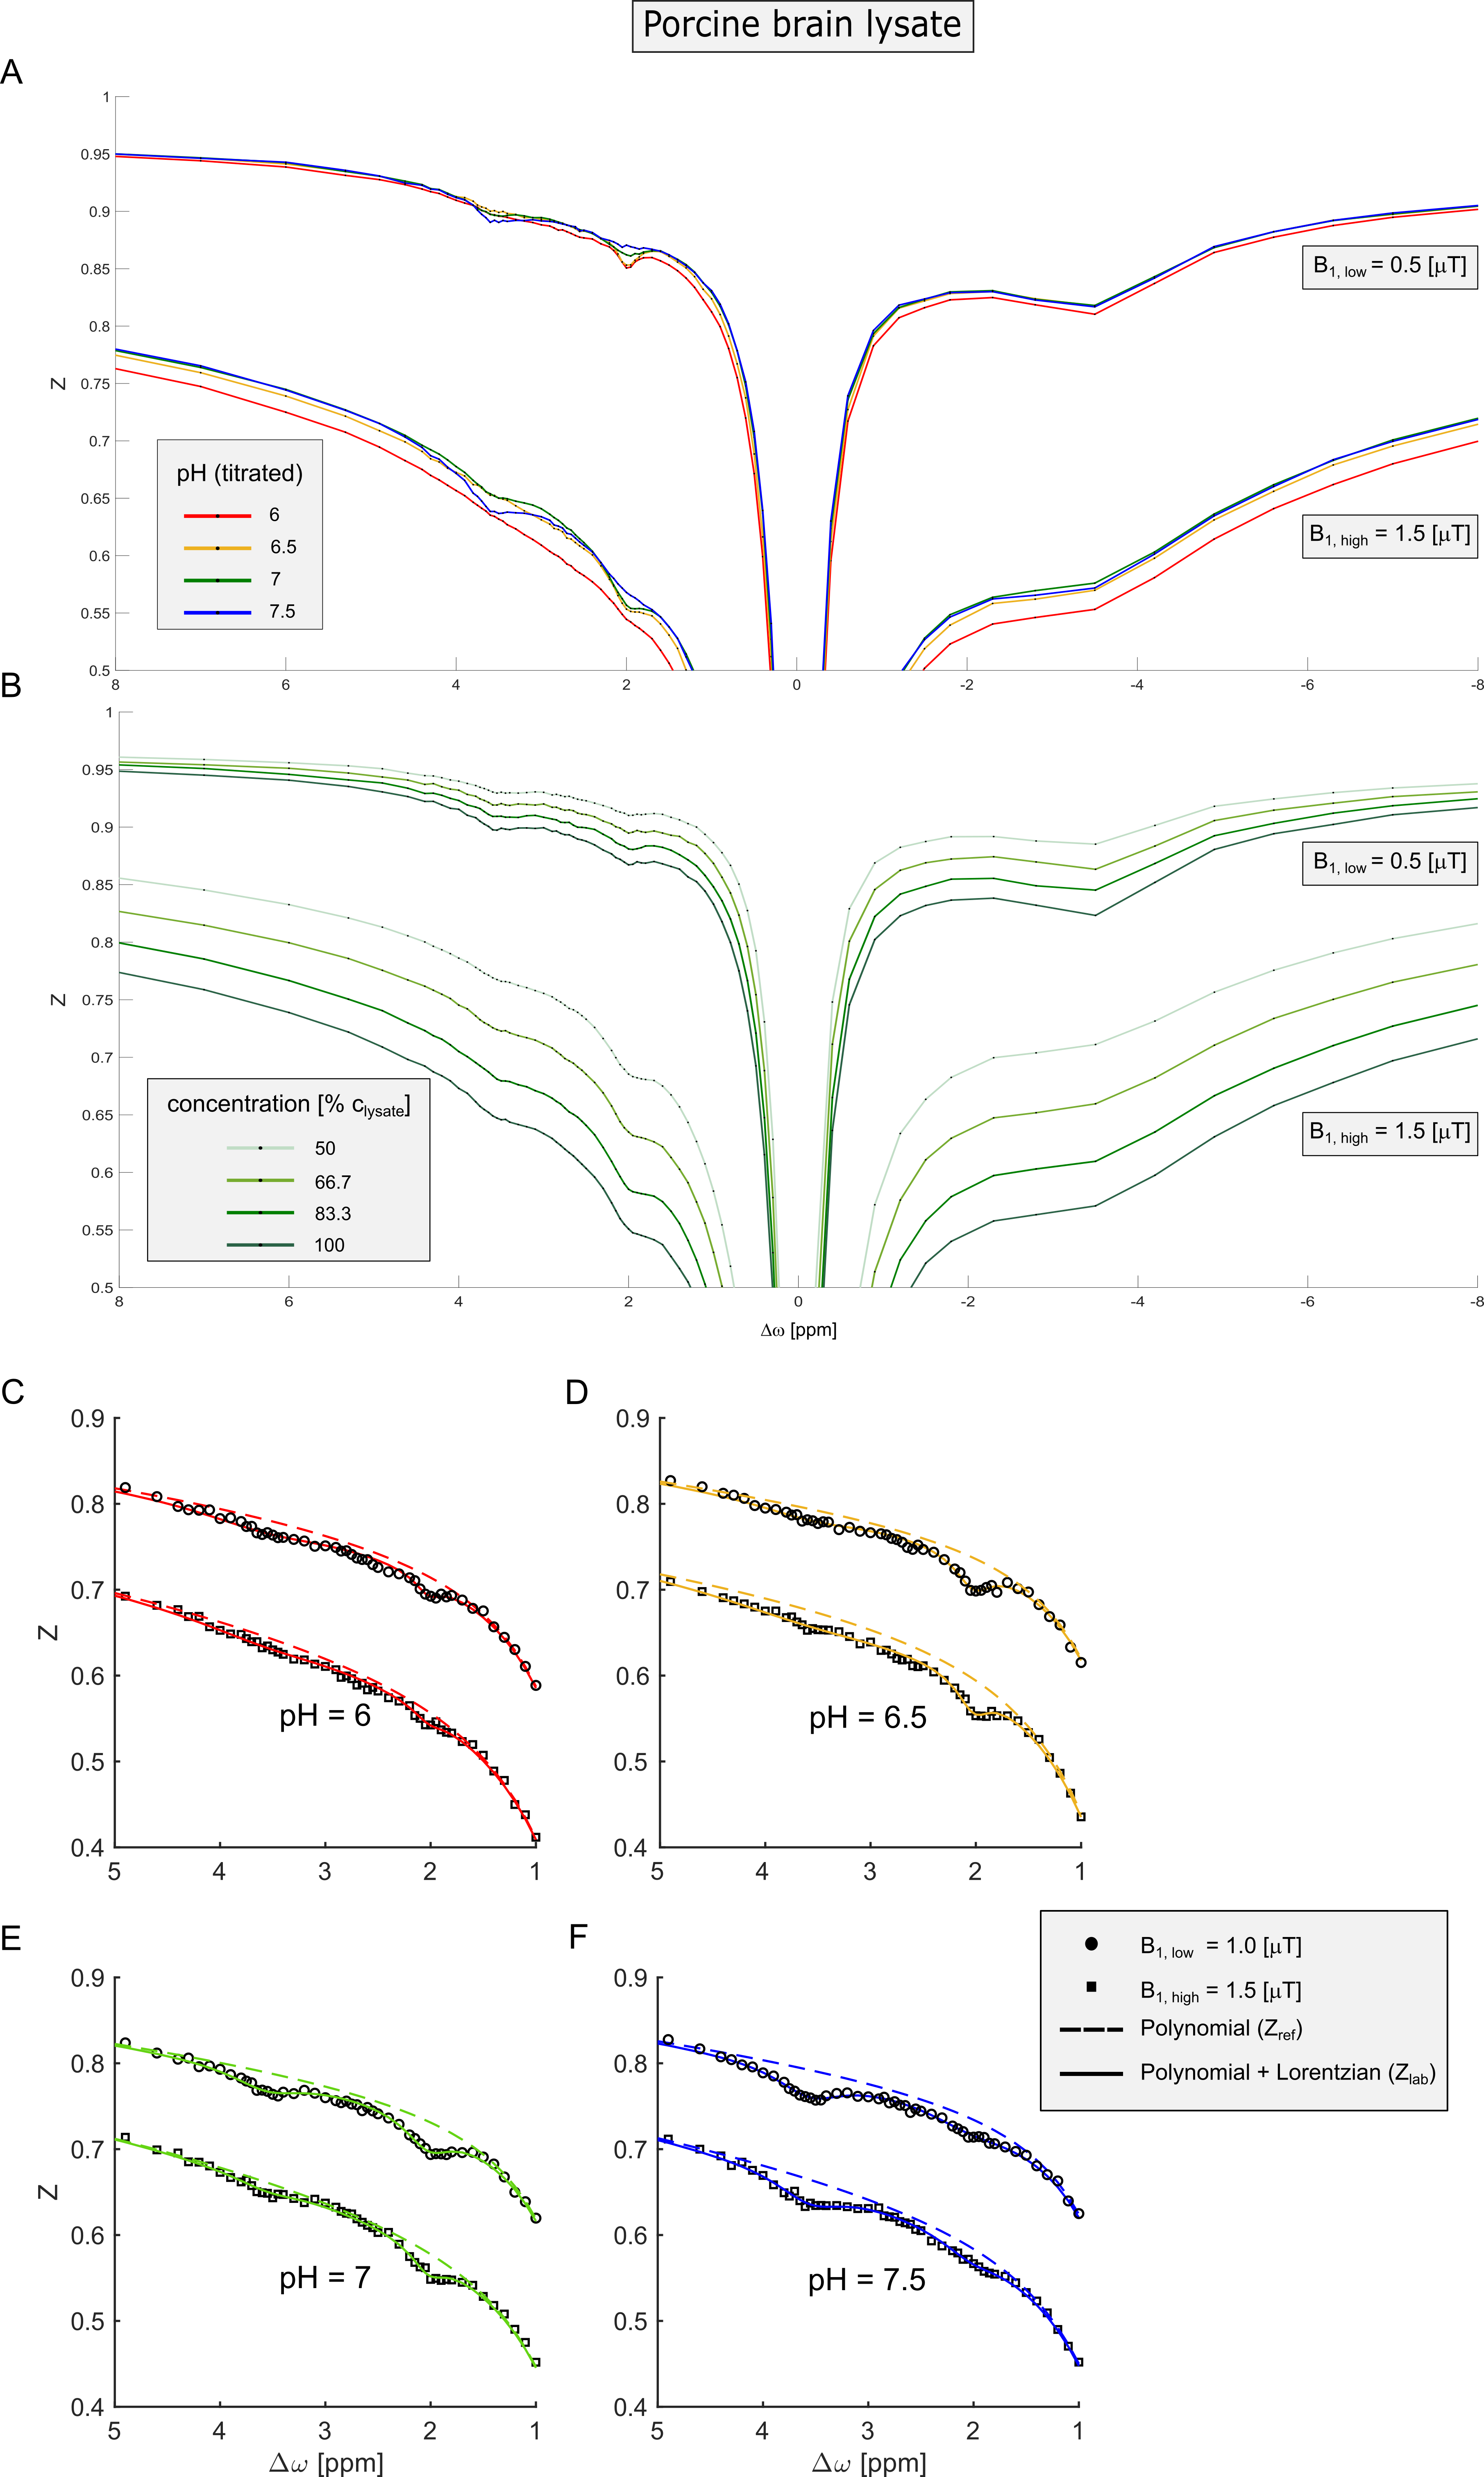
Acquisition of CEST data at different B1 allows calculation of a spillover corrected and concentration-independent ratio which is only dependent on kex and R2b:2,3$$CEST_{ratio}(pH)=\frac{MTR_{Rex}(B_{1,high})}{MTR_{Rex}(B_{1,low})}=\bigg(\frac{B_{1,high}}{B_{1,low}}\bigg)^2\cdot\frac{(\gamma~B_{1,low})^2+k_{ex}(k_{ex}+R_{2b})}{(\gamma~B_{1,high})^2+k_{ex}(k_{ex}+R_{2b})}\qquad\qquad[Equation~1]$$ with the dominantly base-catalyzed exchange rate $$$k_{ex}(pH,T)=k_{b}(T)\cdot10^{pH-pK_{W}(T)}=k_{b}(T)\cdot10^{-pK_{W}(T)}\cdot10^{pH}=k_{c}\cdot10^{pH}$$$ for a fixed temperature T and the transversal relaxation rate R2b of the CEST pool. Here, $$$MTR_{Rex}=\frac{1}{Z_{lab}}-\frac{1}{Z_{ref}}$$$ is either the relaxation-compensated amide (Δω≈3.6ppm) or guanidyl signal (Δω≈2.0ppm), which was extracted from the background (i.e. Zref) of superimposing CEST signals and ssMT by a second order polynomial and Lorentzian two-step-fitting approach similar to Ref. 11. Frequency offsets in the approximate range of 0 to 1.5 ppm and 5.5 to 10 ppm were found to be optimal for the fitting of the background for B1 between 0,5 and 1.5 µT (Figure 1, dashed lines). Measurement of the CESTratio and empirically setting R2b and the exchange rate-determining constant kc to fixed values (see Results and Discussion) allows calculation of two separate pH maps (i.e. one for the amide and one for the guanidyl signal).In order to evaluate the proposed method under in vivo-like conditions (i.e. comparatively small CEST signals and large ssMT) porcine brain lysate12 was investigated at various pH and tissue concentrations (Figure 1,2). In vivo examinations of DLD xenografted nude mice were approved by the local regulatory authorities under G284-15.
All measurements were performed on a 9.4 T small animal MR scanner (Bruker) and stabilized at 37.0 ± 0.1°C using the internal heating device. (i) In vitro experiments: Centric-centric reordered 3D-GRE-CEST-MRI (0.5×0.5×2mm³, matrix=64×64×8), continuous-wave pre-saturation pulse of duration 10s, B1=0.5,0.75,1,1.5,2,2.5µT. (ii) In vivo experiments: 2D-RARE-CEST-MRI (slice=2mm, 0.75×0.75mm2, matrix=40×40), continuous-wave pre-saturation pulse of duration 6s with B1 = 0.6,1.0,1.4µT. B0 and B1 maps were calculated using the WASABI-method13 and used to correct the acquired data for B0 and B1 inhomogeneities.14
Results and Discussion
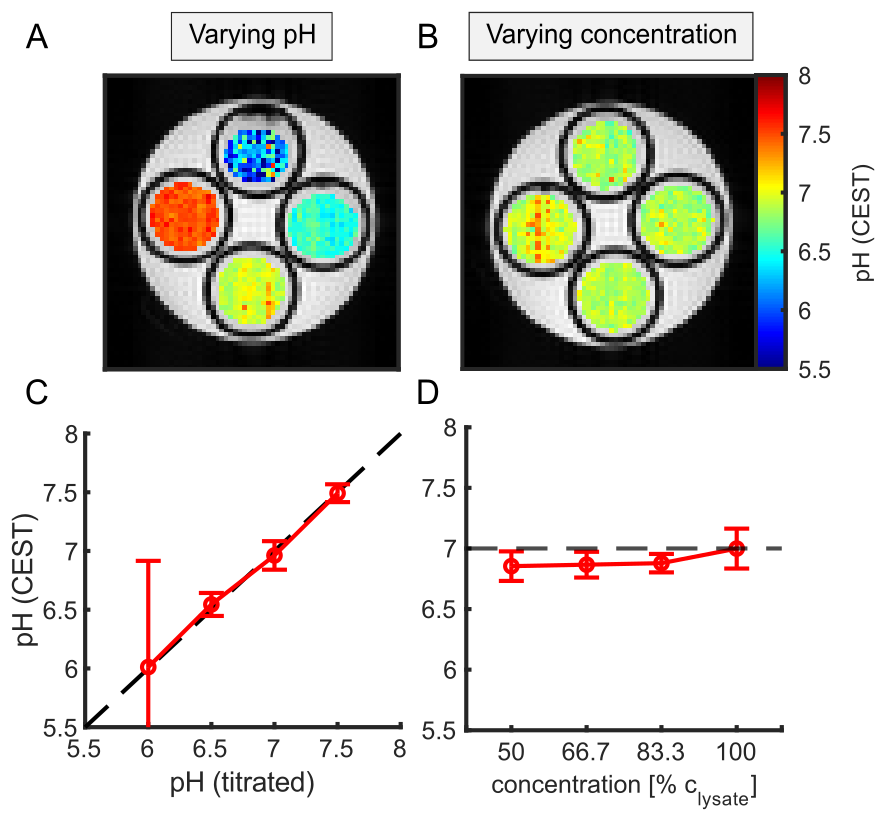
Extraction of the amide and guanidyl signal form the background of concomitant effects by the two-step polynomial Lorentzian fit model was stable over a broad range of pH and B1 (Figure 1C-F). The ssMT, which significantly varied over the concentration series (Figure 1B) was adequately corrected (Figure 2B,D) due to the intrinsic compensation of spillover effects by the inverse metric (Equation 1).Using Equation 1, calculation of a reliable pH map for the amide and guanidyl signal was only feasible either in the range of high (7-7.5) or low pH values (6-7), respectively. This is due to the intrinsically different exchange rate pH-dependencies of amide and guanidyl protons (i.e. kc) leading to a measurable signal strength only in the above-mentioned ranges. Therefore, the two individual pH maps were combined to a final pH map using a weighting based on the local signal amplitude. The combination of the two pH maps led to a good correlation over a broad range of pH values, while being independent of tissue concentration (Figure 2). Deviations were strongest at low pH, due to the intrinsically small guanidyl signal.
In this study, the empirically found kc to match the calculated pH from CEST-MRI to the titrated pH (Figure 2A,C) were 6 and 60 μHz for the amide and guanidyl signal, respectively. These correspond to a kex of 60 and 600 Hz at pH 7 in good agreement with literature. The empirically found values for R2b were 66 Hz for both the amide and guanidyl signal.
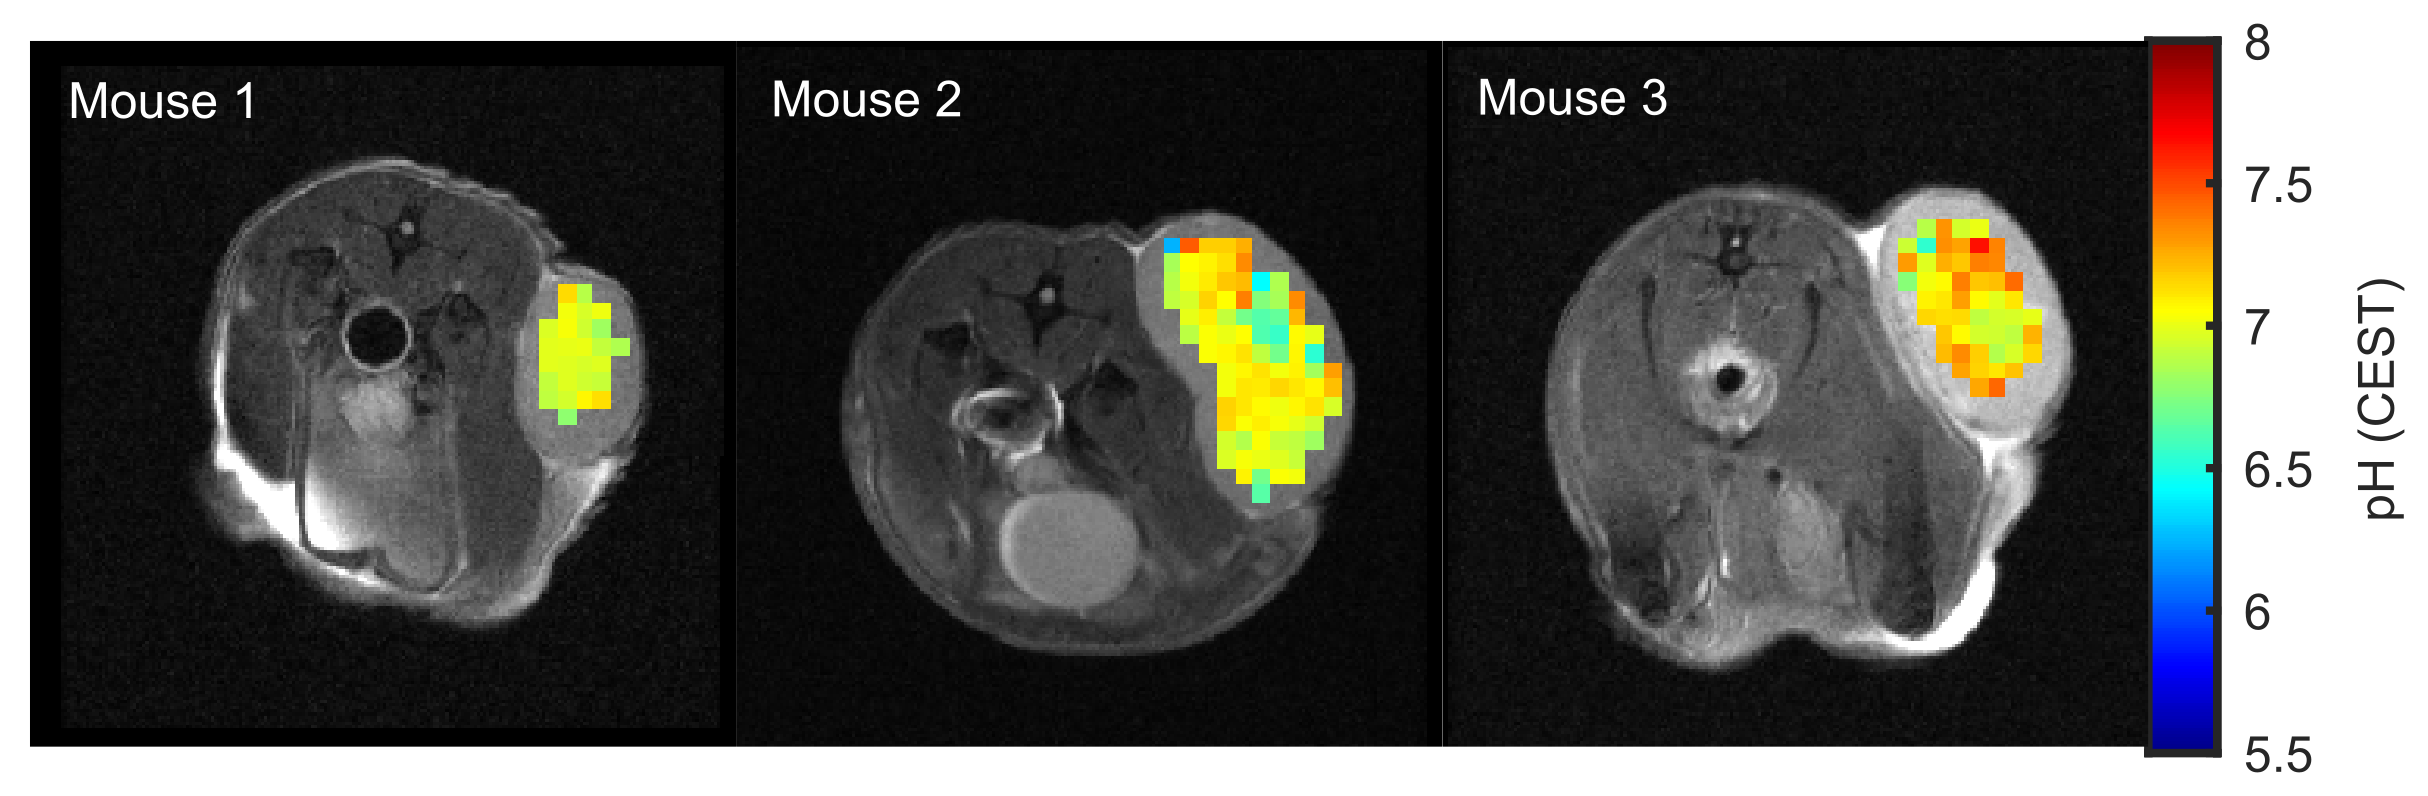
With the calibrated pH-CEST technique at hand pH values of 6.97±0.09, 7.00±0.20 and 7.13±0.19 were found in the DLD tumor xenografted nude mice (n=3, Figure 3). To validate the obtained pH calibration, in the future, kc will be determined directly in vivo by correlation of the pH maps calculated from the CESTratio with 31P-MRSI-pH data.
Conclusion
We presented a method of mapping intracellular pH values in vivo based on amide and guanidyl CEST-MRI, which simultaneously compensates for the concentration, superimposing CEST signals, ssMT, and spillover dilution. In porcine brain lysates, the presented method allowed the calculation of reliable pH maps in the physiologically relevant range of pH 6.5 to 7.5. Applicability in vivo was demonstrated in the lesions of three tumor-bearing mice showing an average intracellular pH of approximately 7. Consequently, endogenous signal-based absolute pH mapping is now applicable for tumor imaging at 9.4T, enabling pre-clinical studies on intracellular pH changes in cancer using CEST-MRI.Acknowledgements
We gratefully thank the German Research Foundation (DFG; GO 2172/1-1) for the financial support.References
1. Zhou J, Payen J-F, Wilson DA, et al. Using the amide proton signals of intracellular proteins and peptides to detect pH effects in MRI. Nat Med. 2003;9:1085–1090.
2. Rerich E, Zaiss M, Korzowski A, et al. Relaxation-compensated CEST-MRI at 7 T for mapping of creatine content and pH – preliminary application in human muscle tissue in vivo. NMR Biomed. 2015;28:1402–1412.
3. Sun PZ, Xiao G, Zhou IY, et al. A method for accurate pH mapping with chemical exchange saturation transfer (CEST) MRI. Contrast Media Mol Imaging. 2016;11:195–202.
4. Arena F, Irrera P, Consolino L, et al. Flip-angle based ratiometric approach for pulsed CEST-MRI pH imaging. J Magn Reson. 2018;287:1–9.
5. Jin T, Wang P, Hitchens TK, et al. Enhancing sensitivity of pH-weighted MRI with combination of amide and guanidyl CEST. NeuroImage. 2017;157:341–350.
6. McVicar N, Li AX, Gonçalves DF, et al. Quantitative Tissue Ph Measurement during Cerebral Ischemia Using Amine and Amide Concentration-Independent Detection (AACID) with MRI. J Cereb Blood Flow Metab. 2014;34:690–698.
7. Wang E, Wu Y, Cheung JS, et al. Mapping tissue pH in an experimental model of acute stroke – Determination of graded regional tissue pH changes with non-invasive quantitative amide proton transfer MRI. NeuroImage. 2019;191:610–617.
8. Harris RJ, Cloughesy TF, Liau LM, et al. pH-weighted molecular imaging of gliomas using amine chemical exchange saturation transfer MRI. Neuro-Oncol. 2015;17:1514–1524.
9. Goldenberg JM, Pagel MD. Assessments of tumor metabolism with CEST MRI. NMR Biomed.;32:e3943.
10. Zaiss M, Xu J, Goerke S, et al. Inverse Z-spectrum analysis for spillover-, MT-, and T1-corrected steady-state pulsed CEST-MRI – application to pH-weighted MRI of acute stroke. NMR Biomed. 2014;27:240–252.
11. Chen L, Barker PB, Weiss RG, et al. Creatine and phosphocreatine mapping of mouse skeletal muscle by a polynomial and Lorentzian line-shape fitting CEST method. Magn Reson Med. 2019;81:69–78.
12. Zaiss M, Windschuh J, Goerke S, et al. Downfield-NOE-suppressed amide-CEST-MRI at 7 Tesla provides a unique contrast in human glioblastoma. Magn Reson Med. 2017;77:196–208.
13. Schuenke P, Windschuh J, Roeloffs V, et al. Simultaneous Mapping of Water Shift and B1 (WASABI)—Application to Field-Inhomogeneity Correction of CEST MRI Data. Magn Reson Med. 2017;77:571–580.
14. Windschuh J, Zaiss M, Meissner J-E, et al. Correction of B1-inhomogeneities for relaxation-compensated CEST imaging at 7 T. NMR Biomed. 2015;28:529–537.
Figures