1461
MTC removed and exchange rate differentiated CEST using Variable Delay Multi Pulse (VDMP) in the human brain at 7T1Department of Radiology, Leiden University Medical Center, Leiden, Netherlands, 2Department of Radiology, UT Southwestern Medical Center, Dallas, TX, United States, 3Advanced Imaging Research Center, UT Southwestern Medical Center, Dallas, TX, United States, 4Department of Radiology, University Medical Center Utrecht, Utrecht, Netherlands
Synopsis
Variable-delay multi-pulse (VDMP) is a chemical exchange saturation transfer (CEST) editing technique relying on the exchange rate as a filter to separate the CEST- effect from different solute pools. We investigated this method to evaluate CEST-effects from metabolites and proteins in in vivo human brain at 7T. We removed the pronounced magnetization transfer contrast present in vivo via Lorentzian-fittings, and evaluated the effect of B1 on saturation build-up curves of the different CEST-pools. MTC-removed VDMP-curves from the human brain are reported for the first time, where the effect of slow and fast exchanging protons allows distinguishing different CEST-pools.
Introduction
Chemical exchange saturation transfer (CEST) imaging of the human brain is challenging due to the lack of specificity to differentiate signals from different pools1,2. This challenge is attributed to the overlapping CEST-effects from various biomolecules3. Recently, CEST editing through variable-delay multi-pulse (VDMP) was introduced to distinguish CEST-effects from fast and slow exchanging molecules by using the interpulse delay (mixing times) as an exchange filter4,5,6. However, VDMP does not account for magnetization transfer contrast (MTC) from macromolecules. The overlap between the broad MT-pool and CEST-pools hinders an accurate quantification of CEST-effects in vivo. In this study, we evaluated VDMP-CEST-effects via simulations, phantom and in vivo experiments. We assessed saturation build-up curves from amide, amine, and relayed NOE (rNOE) pools in the human brain by using different B1 amplitudes and after removing MTC via Lorentzian fitting.Methods
Simulations: We simulated VDMP saturation build-up curves from CEST-pools with different exchange rates in cerebral Grey (GM) and White Matter (WM). We used a two-pool model for individual solute pools and a three-pool model to simulate the overlap of amine and amide pools at 3 ppm. The following solute fractions (f) and exchange rates (ksw) were used for the simulations: GM Amine (3 ppm): f= 0.0115, ksw= 5500Hz; WM Amine (3 ppm): f= 0.0066, ksw= 5500Hz; Amide (3.5 ppm): f= 0.0720, ksw= 30Hz, rNOE (-3.5 ppm): f= 0.1, ksw= 16Hz7. Other parameters used were the following: number of pulses: 20, pulse width: 20ms, T1 relaxation of water: 2s, mixing times: 0, 5, 10, 15, 20, 40, 60, and 100ms.Phantom and in vivo scans: We scanned a phantom consisting of two vials of 60ml each: one with 50mM Glutamate to mimic amines and one with 10% Bovine Serum Albumin (BSA) for amide and rNOE CEST contrast. Solutions were titrated to a pH of 7.3 and were kept at a constant temperature of 34°C during the scans on a 7T human MRI scanner (Philips, the Netherlands). The scan parameters for phantom scans were the same as those used for human scans and are described below. For in vivo assessment, we scanned 5 healthy volunteers (after informed consent under IRB-approval) on the same 7T MRI scanner. The VDMP-CEST pulse sequence consisted of a saturation module (20 sinc gauss pulses of 20 ms duration) followed by a 3D spoiled gradient echo acquisition. A frequency offset range of –1500Hz to 1500Hz was spanned with 28 steps of 106Hz. Acquisition parameters were as follows: TR/TE: 3.7/2ms, voxel size: 1.5x1.5x3mm3. A total of 7 mixing times (tmix) were acquired: 0, 10, 15, 20, 40, 60, 100ms, with 4 different B1 amplitudes per pulse unit: 0.99μT, 1.99μT, 2.81μT and 3.26μT. Additionally, a 3D T1 weighted image was acquired for GM and WM segmentations with the following imaging parameters: TR/TE: 4.2/1.85ms; FA: 7º degrees; TI: 1300ms; voxel size: 0.9x0.9x0.9 mm3.
Post-processing: MTC removal was done by fitting a three-pool Lorentzian model and subtracting the fitted MTC-pool from the initial z-spectra. Data analysis details are given in Figure 1.
Results and discussion
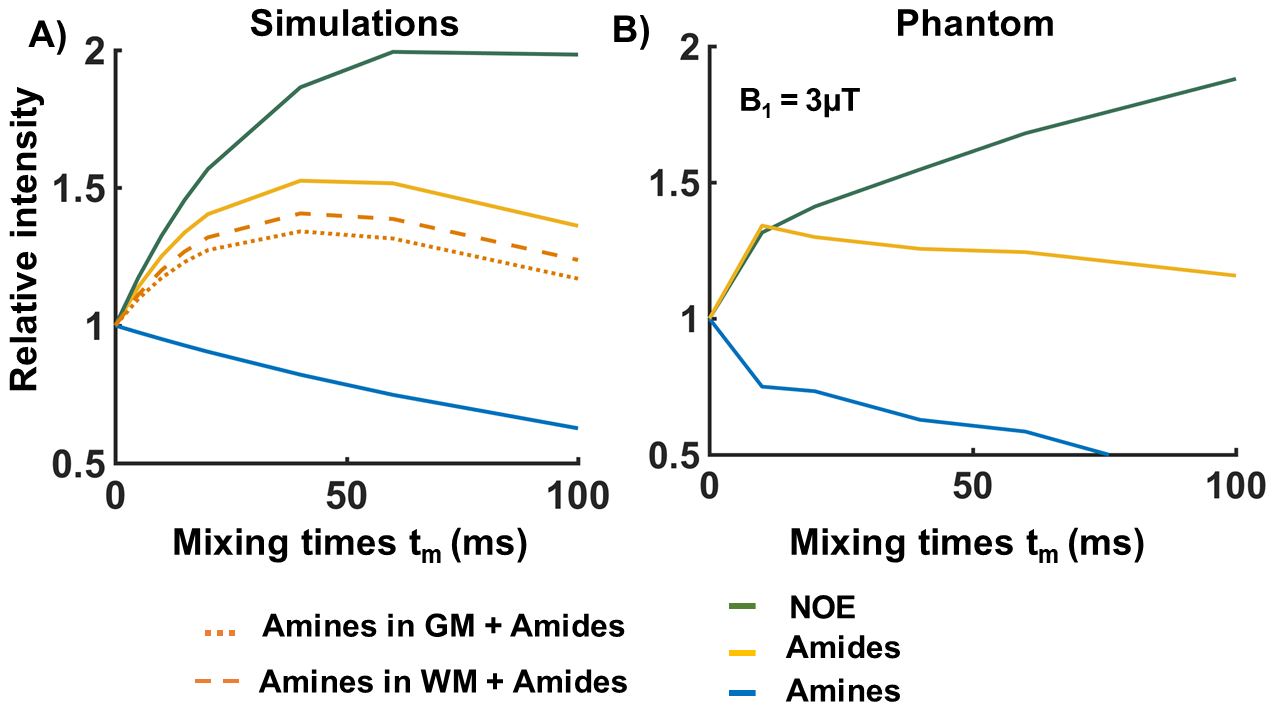
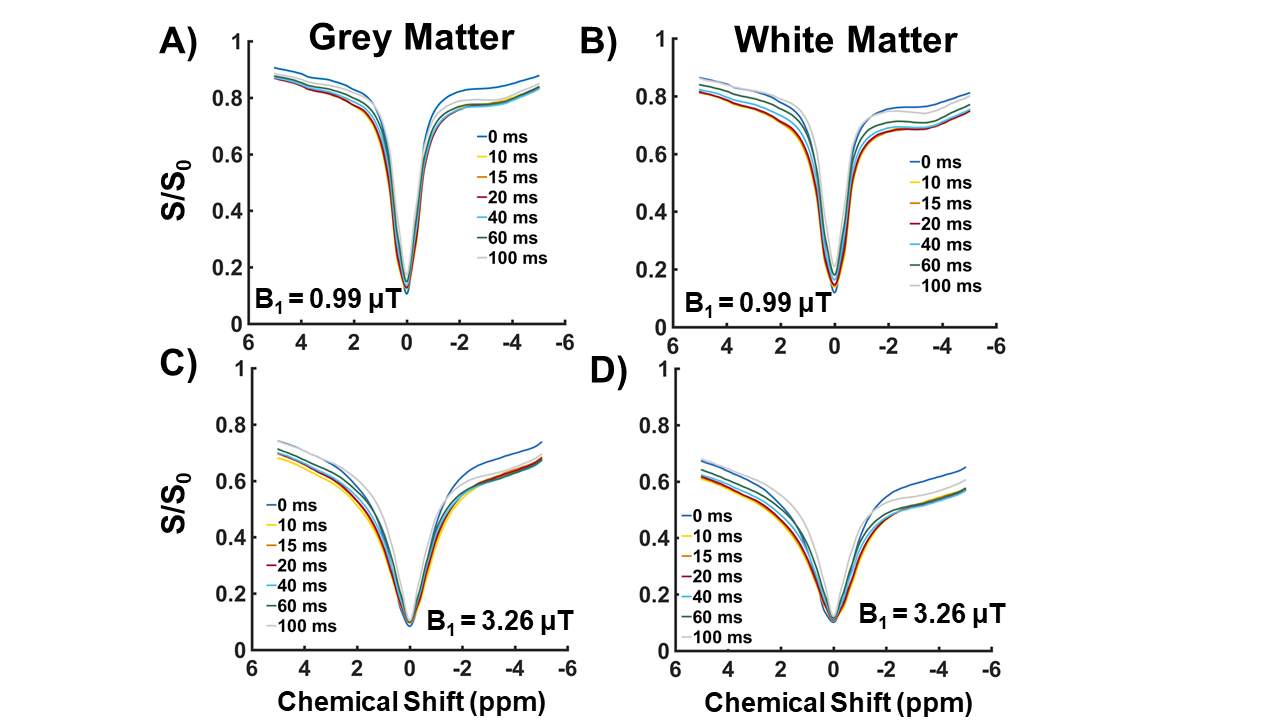
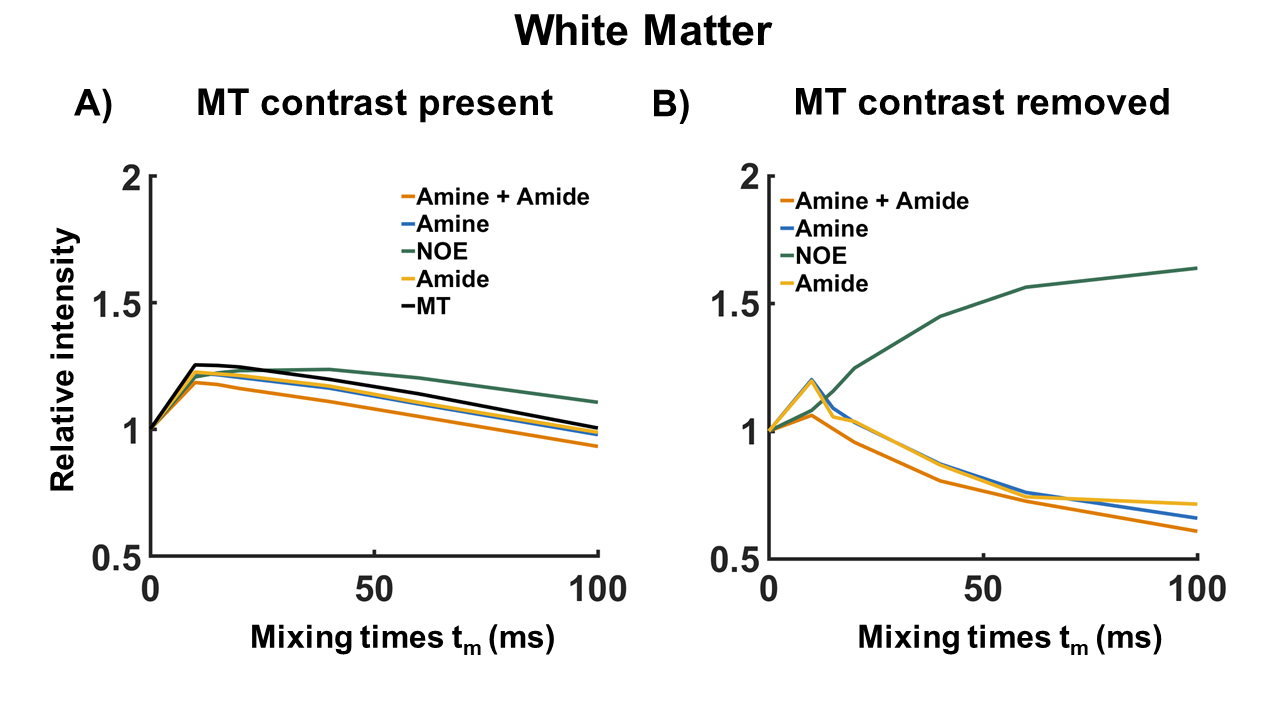
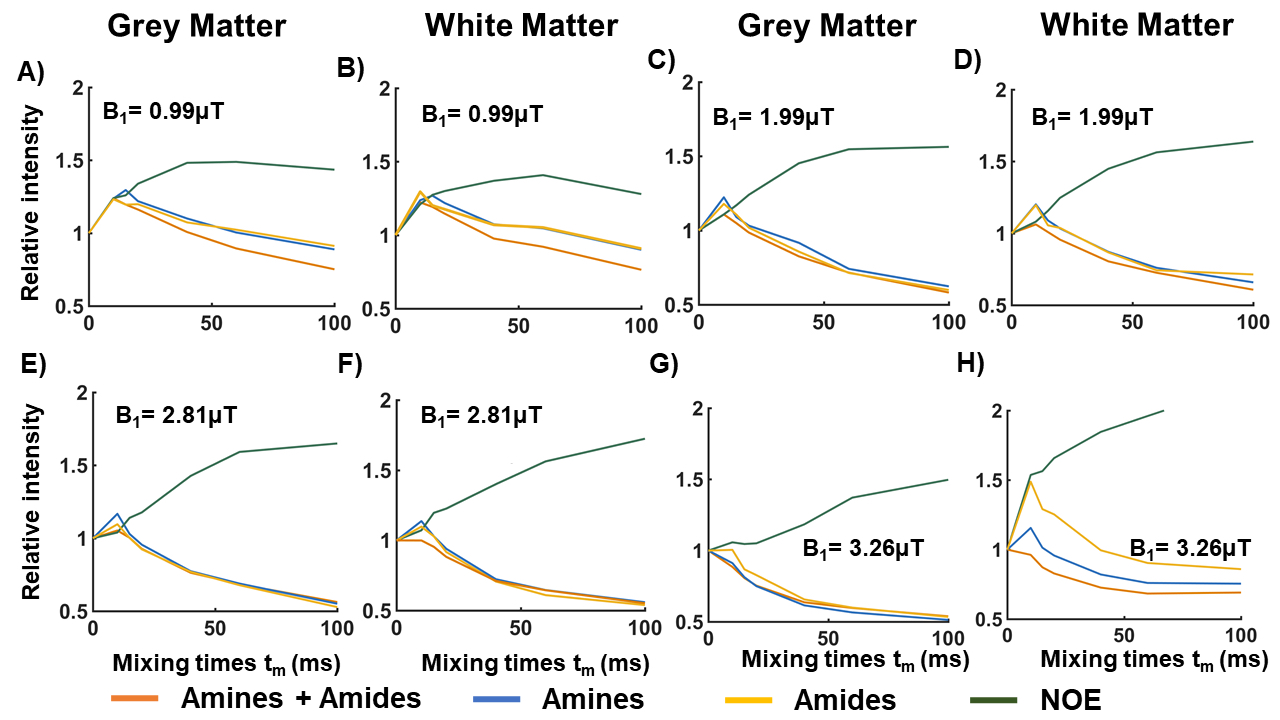
Figure 2A shows simulated VDMP build-up curves for all CEST-pools. Slow exchanging pools (amides and rNOE) show a gradual saturation build-up, whereas a fast decay without a build-up is observed for fast-exchanging amines. When a higher fraction of amides than amines is present in a mixture (comparable to the WM), amide pool dominates the build-up signal (dashed orange line in Figure 2A). VDMP results from the phantom show a similar build-up trend to the simulations with slight variations due to concentration differences between simulations and phantom experiments (Figure 2B). In Figure 3, z-spectra from the GM and WM are shown for all tmix for 2 different B1 (0.99μT and 3.26μT). A broadening of the z-spectra is observed with a higher B1 value, in line with MTC increase at higher B13. Before removing the fitted MT pool , VDMP-curves from all CEST-pools in the human brain show a similar saturation trend to the one from MT (Figure 4A). Upon removing the MTC, we observed a gradual build-up trend for the slow exchanging molecules and a faster decay for fast exchanging ones, similarly to simulation and phantom results (Figure 4B). rNOE curve displays significantly different behavior than amide and amine pools, both in terms of build-up and the level-off, reflecting the slower and different (relayed) nature of the processes involved. To evaluate the role of B1 on in vivo VDMP-CEST-effects, MTC removed VDMP-curves are plotted for different B1s (Figure 5). Despite slight differences between GM and WM (concentration differences8), B1 of 0.99μT and 2.81/3.26μT, are observed to be sensitive for separately assessing the saturation build-up of slow and fast exchanging components, respectively. Our results suggest that MTC, mixing time, and B1 need to be carefully considered for utilizing VDMP-CEST editing technique when imaging the human brain.Conclusion
We have demonstrated VDMP build-up curves for temperature controlled phantom experiments, as well as for the first time from the human brain at 7T: 1) after removing the MTC effect via Lorentzian fittings 2) and when applying different B1 values. Our results show that VDMP has potential to mitigate the challenge to separately evaluate fast and slow exchanging CEST-pools in the human brain.Acknowledgements
This work is funded by Medical Delta Cancer 3.0 program and NWO grant #16862.References
1. Wu B, Warnock G, Zaiss M, et al. An overview of CEST MRI for non-MR physicists. EJNMMI Physics. 2016;3(1). doi:10.1186/s40658-016-0155-2
2. van Zijl PCM, Yadav NN. Chemical exchange saturation transfer (CEST): What is in a name and what isn’t? Magnetic Resonance in Medicine. 2011;65(4):927-948. doi:10.1002/mrm.22761
3. van Zijl PCM, Lam WW, Xu J, Knutsson L, Stanisz GJ. Magnetization Transfer Contrast and Chemical Exchange Saturation Transfer MRI. Features and analysis of the field-dependent saturation spectrum. NeuroImage. 2018;168(April 2017):222-241. doi:10.1016/j.neuroimage.2017.04.045
4. Xu J, Yadav NN, Bar-Shir A, et al. Variable delay multi-pulse train for fast chemical exchange saturation transfer and relayed-nuclear overhauser enhancement MRI. Magnetic Resonance in Medicine. 2014;71(5):1798-1812. doi:10.1002/mrm.24850
5. Xu J, Chan KWY, Xu X, Yadav N, Liu G, van Zijl PCM. On-resonance variable delay multipulse scheme for imaging of fast-exchanging protons and semisolid macromolecules. Magnetic Resonance in Medicine. 2017;77(2):730-739. doi:10.1002/mrm.26165
6. Chen L, Xu X, Zeng H, et al. Separating fast and slow exchange transfer and magnetization transfer using off-resonance variable-delay multiple-pulse (VDMP) MRI. Magnetic Resonance in Medicine. 2018;80(4):1568-1576. doi:10.1002/mrm.27111
7. Khlebnikov V, van der Kemp WJM, Hoogduin H, Klomp DWJ, Prompers JJ. Analysis of chemical exchange saturation transfer contributions from brain metabolites to the Z-spectra at various field strengths and pH. Scientific Reports. 2019;9(1):1-11. doi:10.1038/s41598-018-37295-y
8. Choi C, Coupland NJ, Bhardwaj PP, et al. T2 measurement and quantification of glutamate in human brain in vivo. Magnetic Resonance in Medicine. 2006;56(5):971-977. doi:10.1002/mrm.21055
Figures