1460
Quasi-steady-state (QUASS) CEST solution improves the accuracy of CEST quantification – QUASS CEST MRI-based omega plot analysis1Department of Radiology and Imaging Sciences, Emory University, Atlanta, GA, United States
Synopsis
CEST MRI omega plot quantifies the labile proton fraction ratio (fr) and exchange rate (ksw), yet it assumes long RF saturation time (Ts) and relaxation delay (Td). Our study aimed to test if a quasi-steady-state (QUASS) CEST analysis that accounts for the effect of finite Ts and Td could improve the accuracy of CEST MRI quantification. Both simulation and CEST MRI experiments confirmed that the QUASS solution enabled robust quantification of ksw and fr, superior over the omega plot analysis based on the conventional apparent CEST MRI measurements.
Introduction
The CEST MRI contrast depends on not only the labile proton concentration and exchange rate but also the experimental conditions (1), in particular the amplitude (2,3) and duration of RF saturation (4-6). However, most quantitative CEST (qCEST) analyses assume long relaxation delay (Td) and saturation time (Ts), which are often not fulfilled experimentally. Capitalizing on the development of spinlock theorem (7-9), we herein postulated that a quasi-steady-state (QUASS) CEST effect can be derived from experiments of not-long saturation time and relaxation delay, which allows robust and accurate qCEST analysis.Methods
The measurable CEST MRI signal can be described as (10)$$$(Isat/I0)app={(1-e^(-R1w*Td))*e^(-R1ρ*Ts)+R1w/R1ρ*cos(theta)2*(1-e^(-R1ρ*Ts))}/{1-e^(-R1w*(Td+Ts))}$$$ Eq. (1)
where Iappsat and I0app are the saturated and unsaturated scans, respectively, obtained under a given set of Ts and Td times. The spinlock relaxation rate is the only unknown variable in the equation, which can be numerically solved with experimentally measurements of and T1w as well as scan parameters such as B1, Δω, Ts, and Td. The QUASS CEST Z spectral signal can be calculated as
$$$(I_{sat}/I_0)^{QUASS}=R_{1w}/R_{1ρ}*cos(theta)^2$$$. The omega plot analyzes the inverse CEST effect as a function of B1. The labile proton fraction ratio and exchange rate can be solved from the slope (C1) and intercept (C0), as published in (11).
Phantom
We prepared 1% low-gelling-point agarose solution with 50 mM Creatine. The phantom solidified at room temperature before experiments. Its pH was measured to be 6.65 after the scan.
MRI
MRI experiments were conducted using a 7 Tesla Bruker MRI scanner. For each B1 level, we varied the pair of Td and Ts (Td/Ts) together from 1.5, 2, 3, 4, 5 to 7.5 s while maintaining Td=Ts. For each pair of Td and Ts, we varied B1 from 0.6, 0.7, 1.1, 1.6, 2.1 to 2.6 μT. T1w–weighted inversion recovery images were acquired with 6 inversion delays ranging from 0.1 to 3 s (relaxation delay/TE =10 s/46 ms, 2 averages).
Results
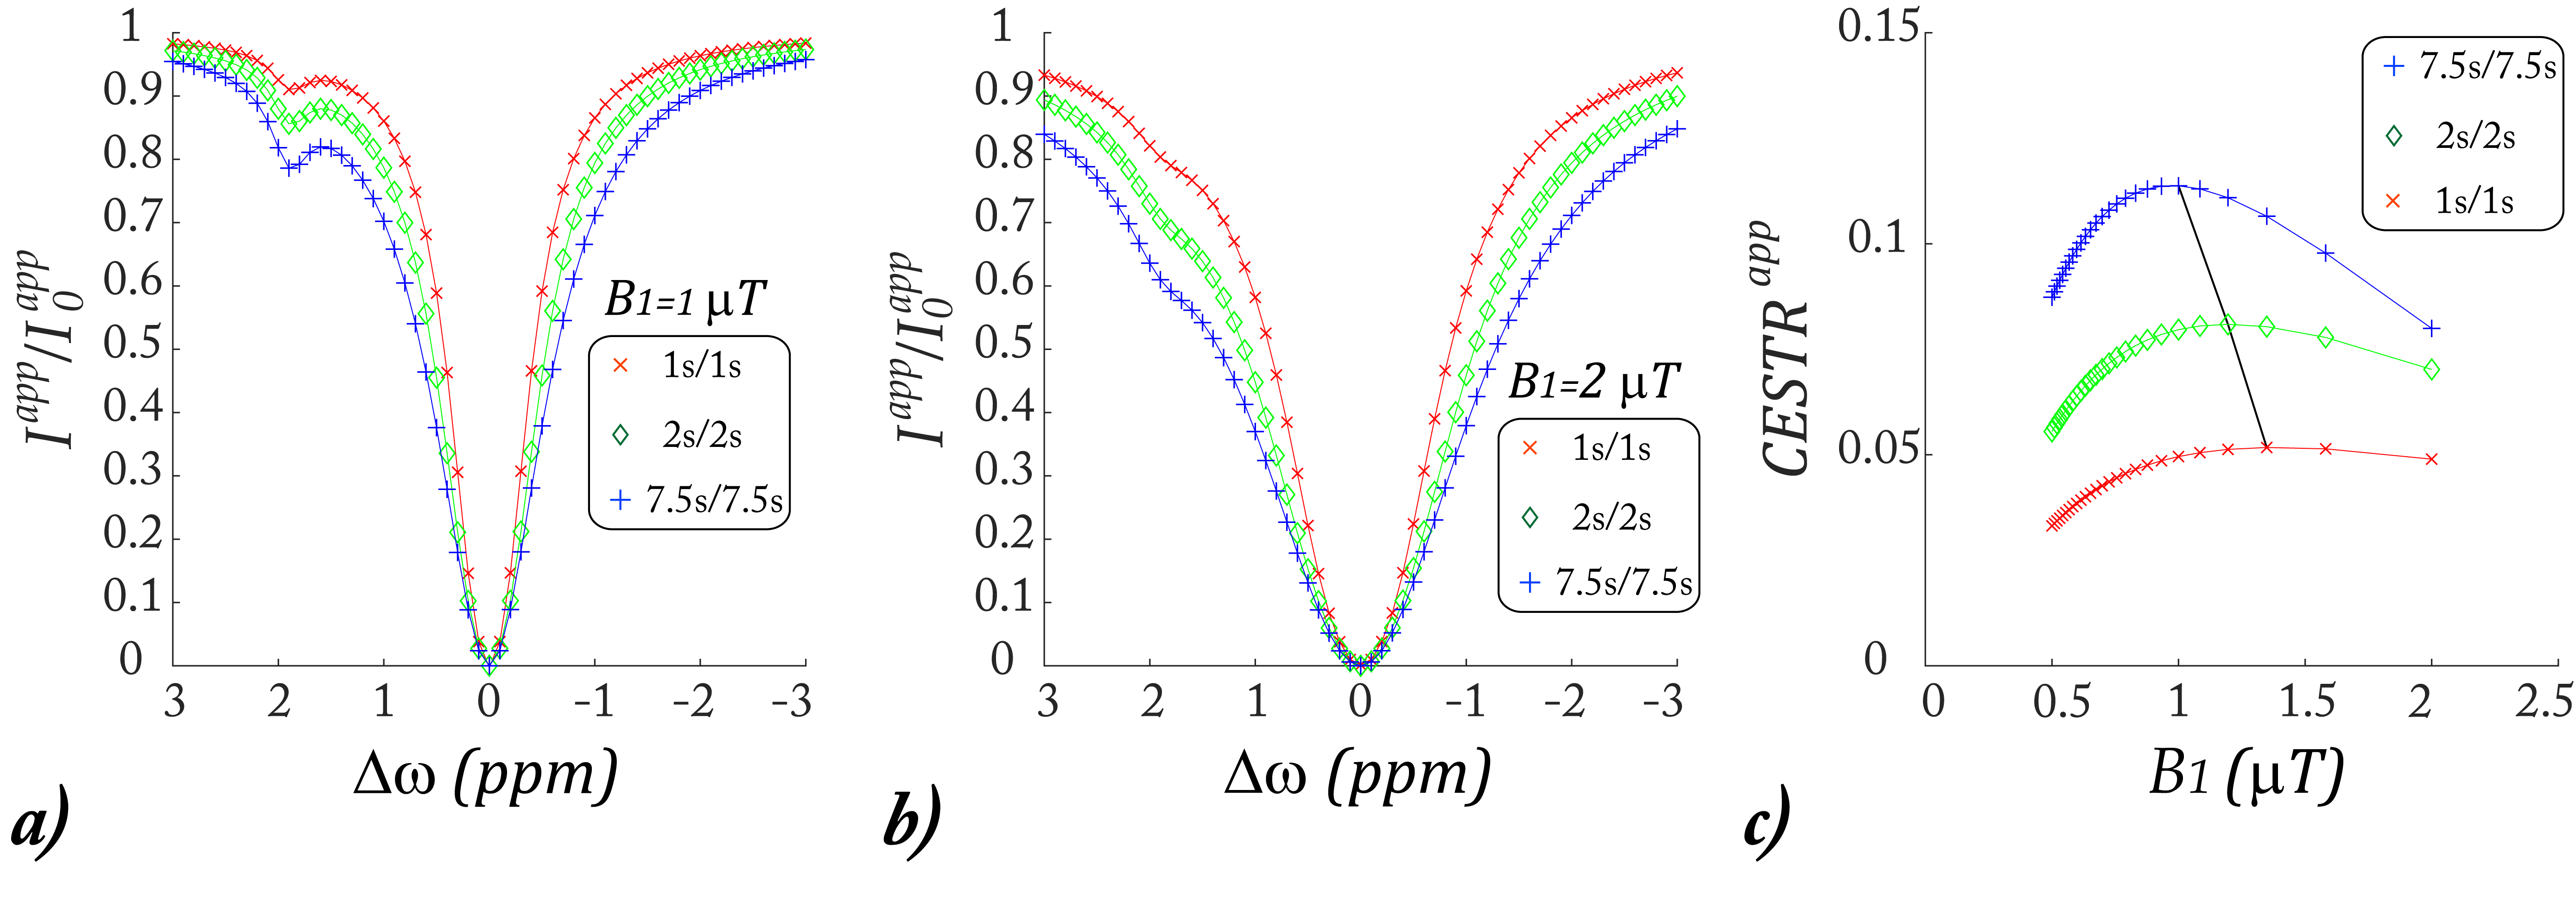
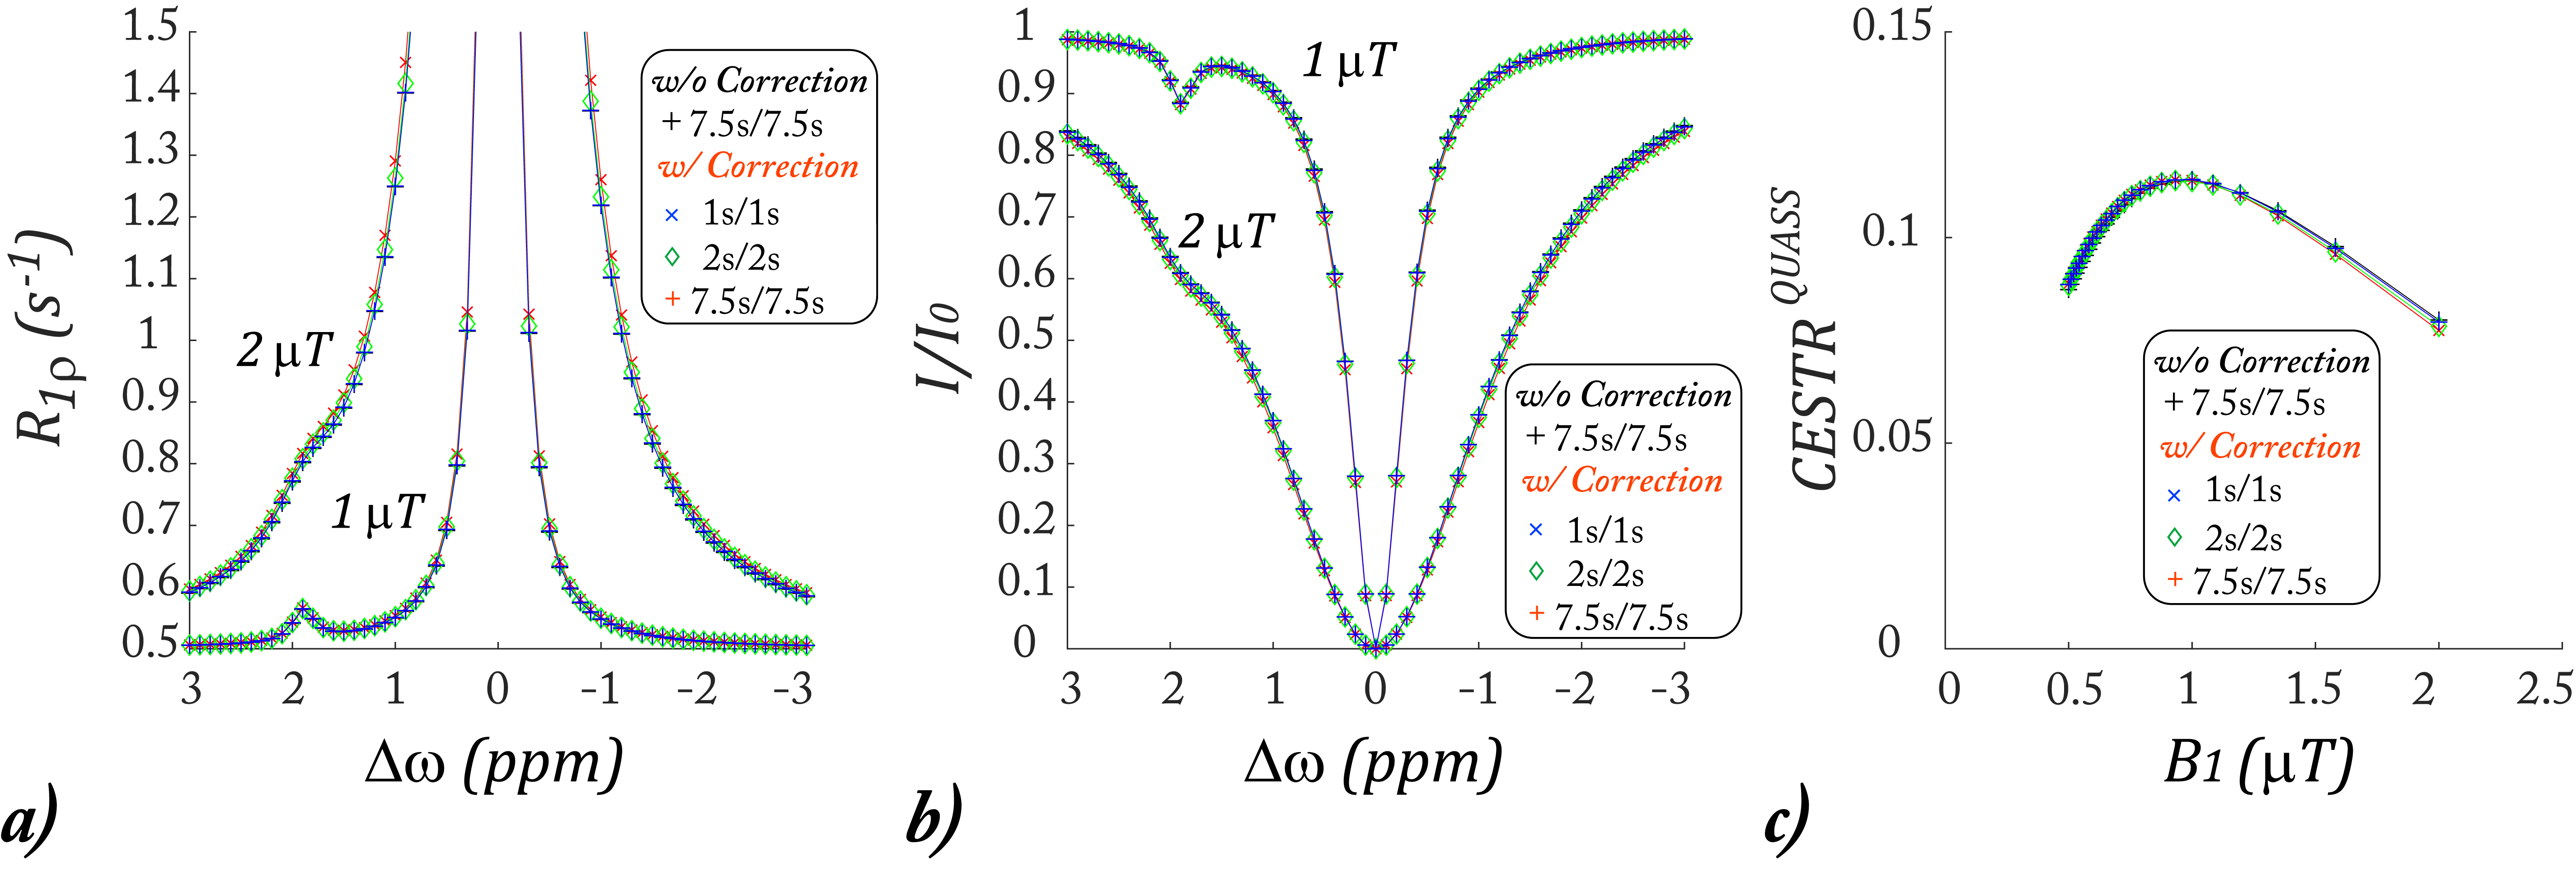
Fig. 1a shows representative Z-spectra under short Td and Ts (1s/1s), modest Td and Ts (2s/2s), and long Td and Ts (7.5s/7.5s). The Z-spectral intensity drops at long saturation time and relaxation delay times due to prolonged saturation transfer. Fig. 1b shows the corresponding Z-spectra under a higher B1 level of 2 µT. Fig. 1c shows the CEST effect as a function of the RF saturation B1 field. Notably, the B1 level under which the CEST effect peaks depends on Ts and Td.Fig. 2 shows the proposed QUASS CEST MRI solution. Fig. 2a plots the numerically solved R1ρ, which overlapped with the apparent R1ρ simulated under the condition of long Ts and Td. Fig. 2b shows that QUASS Z-spectra, which overlapped with those simulated under long Ts and Td of 7.5 s/7.5 s. Fig. 2c plots the CEST effect as a function of B1, which overlapped for different sets of Td and Ts.
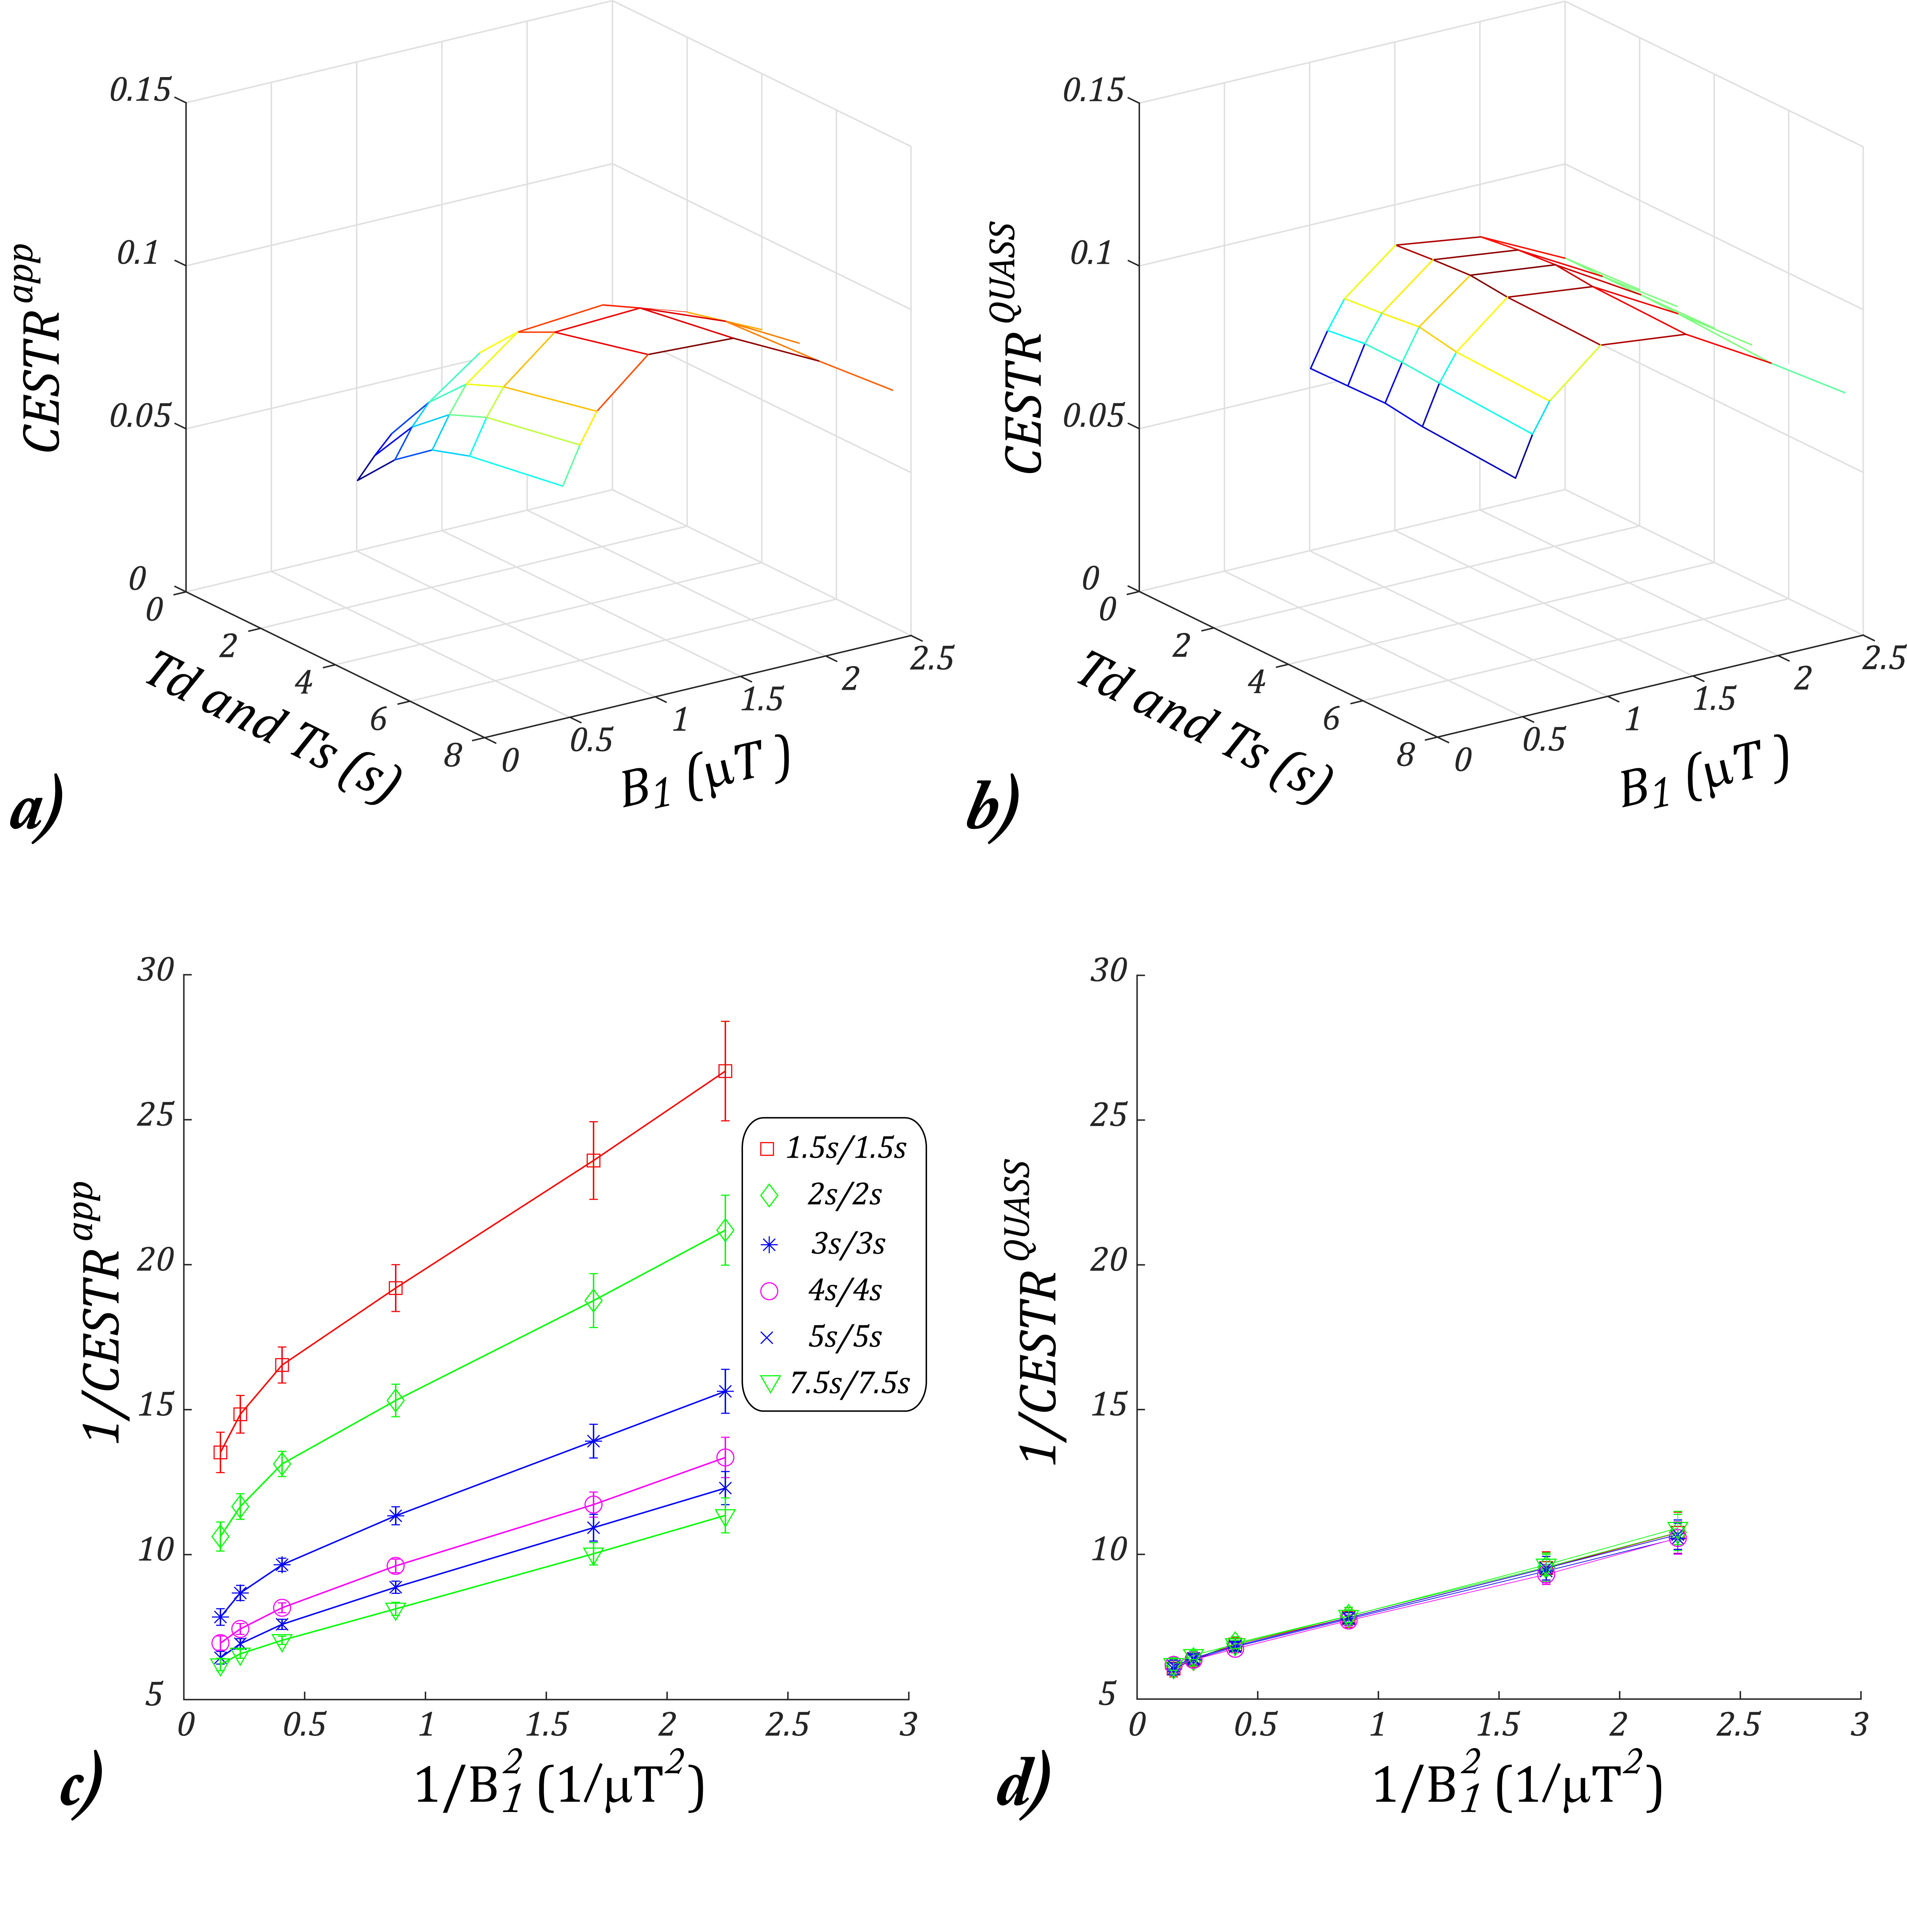
We tested the proposed QUASS CEST quantification. Figs. 3a and 3b show the 2-D plot of $$$CESTR^{app}$$$ and $$$CESTR^{QUASS}$$$ as a function of B1 and Ts/Td. $$$CESTR^{app}$$$ showed substantial variation along both dimensions of B1 and Td/Ts while $$$CESTR^{QUASS}$$$ showed little variation along the dimension of Td/Ts. We performed an ROI-based omega plot analysis. For the conventional apparent CEST MRI, both the slope and intercept of its omega plot strongly depended on Ts and Td (Fig. 3c) while the omega plot analysis of the QUASS CEST MRI revealed a consistent and strong linear relationship, with little dependence on Ts/Td (Fig. 3d).
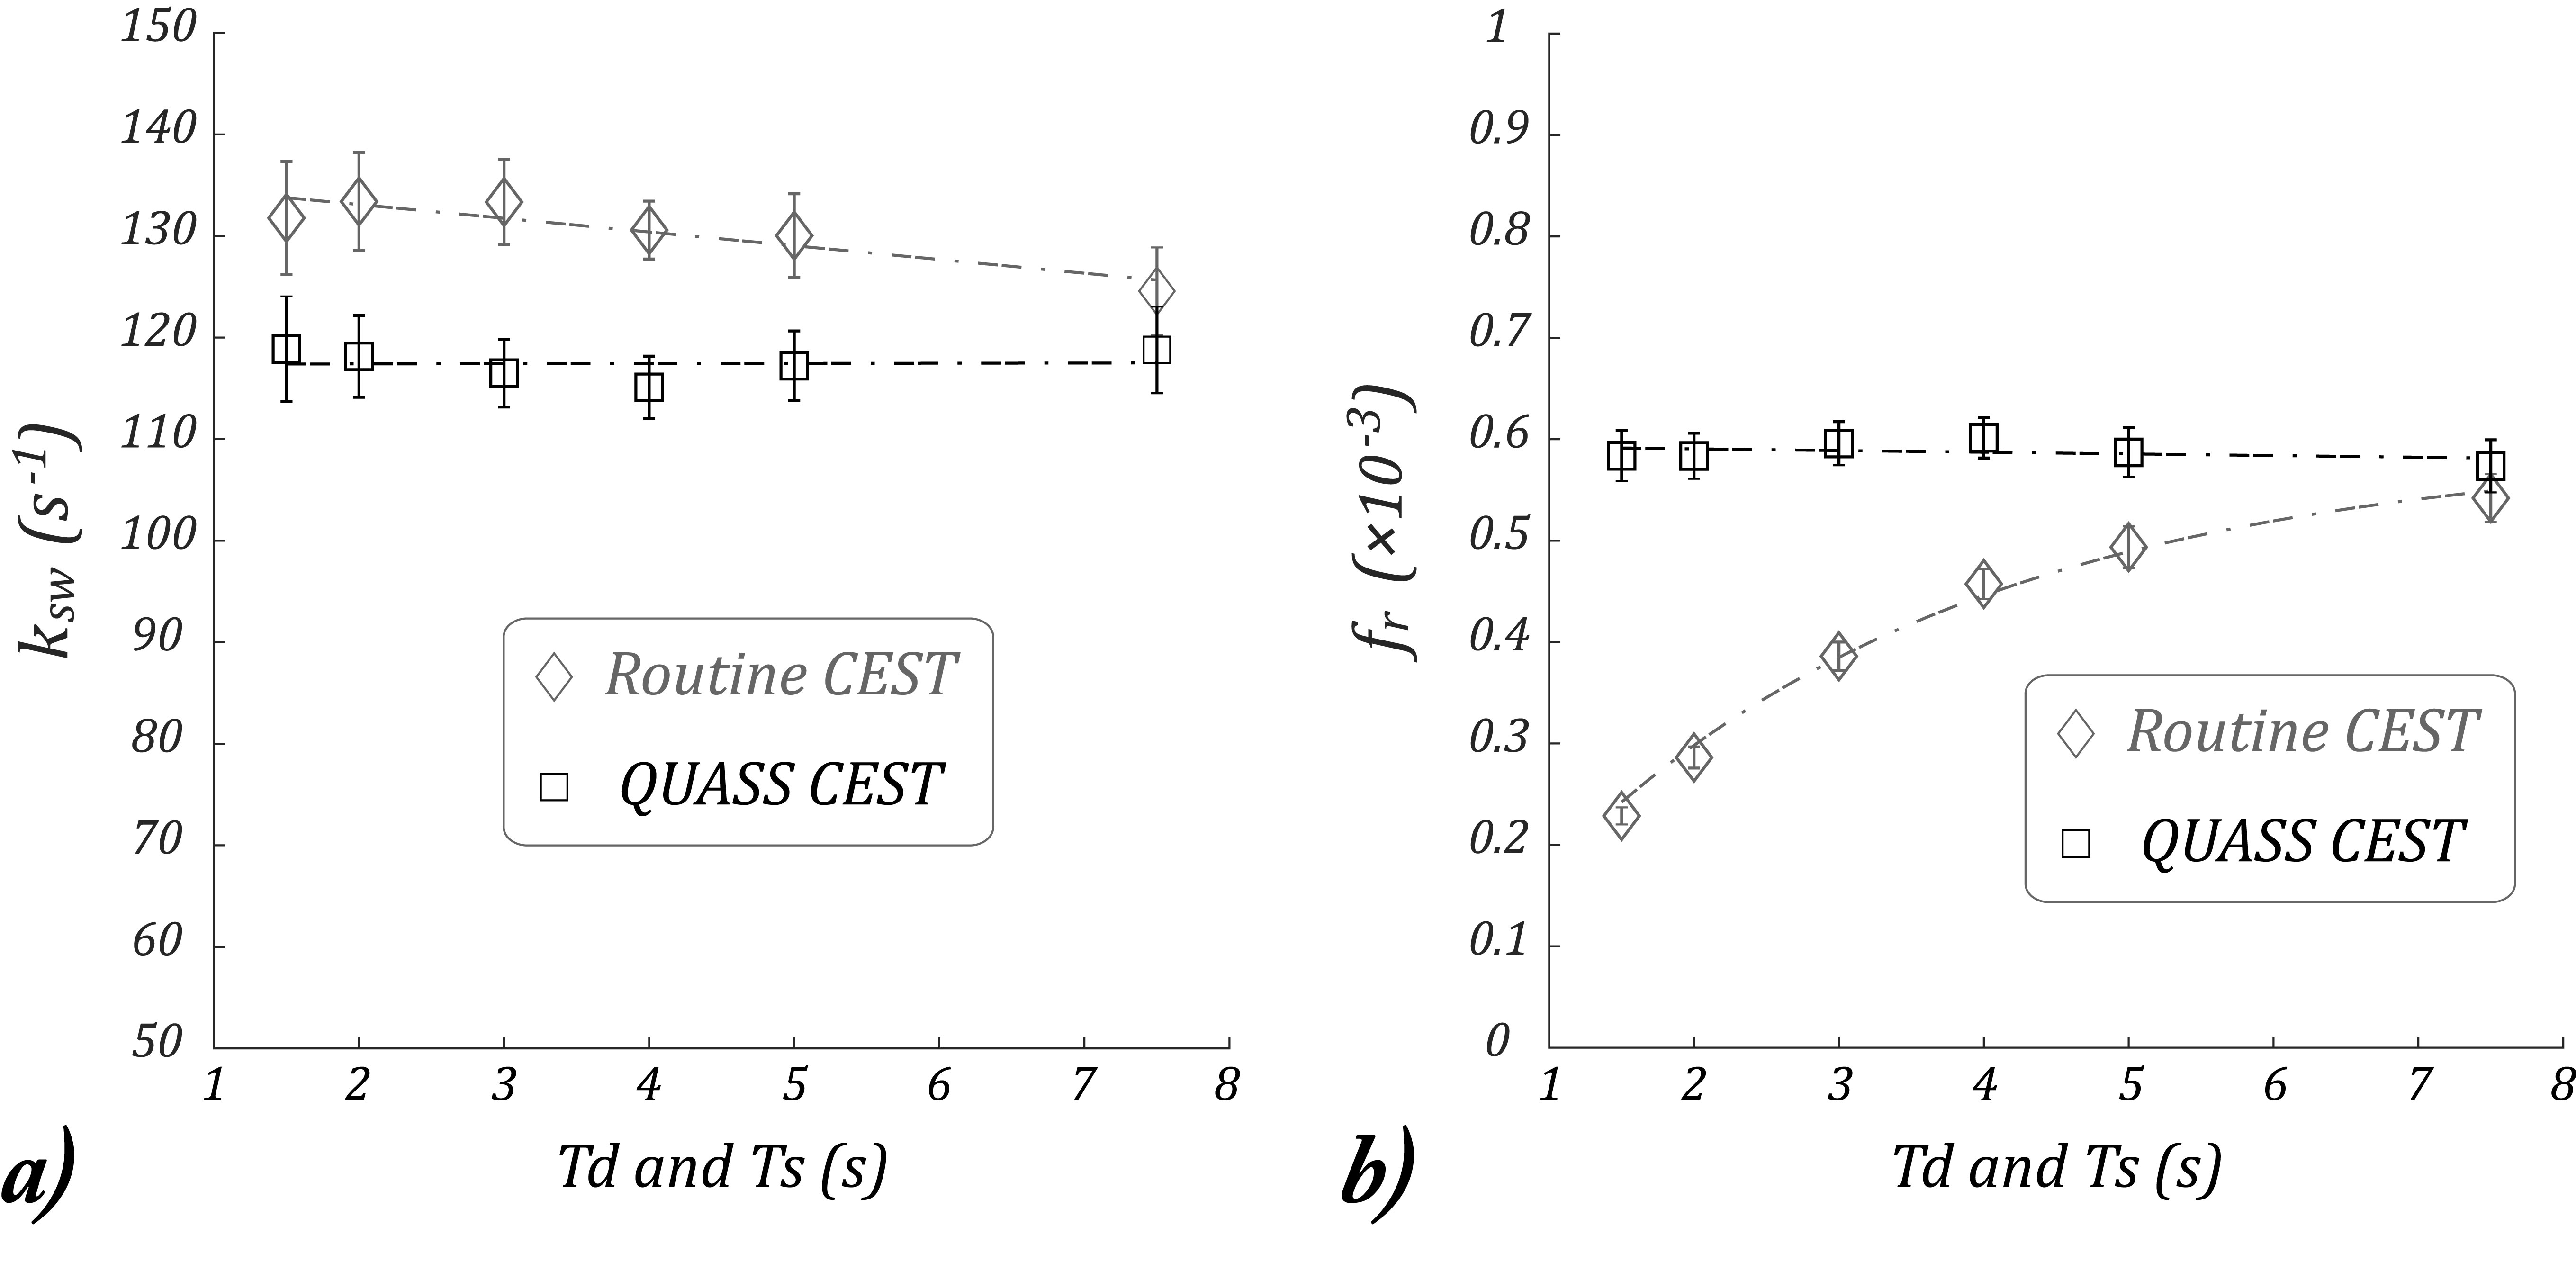
Fig. 4a shows that for the conventional apparent CEST MRI measurement, both the slope and intercept are significantly dependent on the Ts/Td. For the QUASS CEST MRI, we had the intercept (P < 1e-6) while the slope (P = 0.96) shows little dependence on Ts/Td. We modeled fr with a stretched exponential function in Matlab in Fig. 4b. We had all three terms significantly dependents on the Ts/Td. In comparison, for fr solved from the QUASS solution, the slope had little dependence on Ts/Td (P = 0.47).
Discussion
Our results did not find significant QUASS ksw and fr dependence over Td and Ts, while results from conventional apparent CEST MRI showed strong and significant Td and Ts dependency. This experimental finding suggests that the QUASS CEST MRI post-processing augments the conventional apparent CEST MRI measurement, enabling robust quantitative CEST analysis.Conclusion
Our study proposed a QUASS CEST MRI solution and demonstrated that it corrects the effects of finite saturation time and relaxation delay on the CEST MRI measurements, which augments CEST quantification accuracy.Acknowledgements
No acknowledgement found.References
1. Sun PZ, Lu J, Wu Y, Xiao G, Wu R. Evaluation of the dependence of CEST-EPI measurement on repetition time, RF irradiation duty cycle and imaging flip angle for enhanced pH sensitivity. Phys Med Biol 2013;58(17):N229-240.
2. Sun PZ, van Zijl PC, Zhou J. Optimization of the irradiation power in chemical exchange dependent saturation transfer experiments. J Magn Reson 2005;175(2):193-200.
3. Zhao X, Wen Z, Huang F, Lu S, Wang X, Hu S, Zu D, Zhou J. Saturation power dependence of amide proton transfer image contrasts in human brain tumors and strokes at 3 T. Magn Reson Med 2011;66(4):1033-1041.
4. McMahon MT, Gilad AA, Zhou J, Sun PZ, Bulte JW, van Zijl PC. Quantifying exchange rates in chemical exchange saturation transfer agents using the saturation time and saturation power dependencies of the magnetization transfer effect on the magnetic resonance imaging signal (QUEST and QUESP): Ph calibration for poly-L-lysine and a starburst dendrimer. Magn Reson Med 2006;55(4):836-847.
5. Randtke EA, Chen LQ, Pagel MD. The reciprocal linear QUEST analysis method facilitates the measurements of chemical exchange rates with CEST MRI. Contrast Media Mol Imaging 2014;9(3):252-258.
6. Zaiss M, Angelovski G, Demetriou E, McMahon MT, Golay X, Scheffler K. QUESP and QUEST revisited - fast and accurate quantitative CEST experiments. Magn Reson Med 2018;79(3):1708-1721.
7. Trott O, Palmer AG, 3rd. R1rho relaxation outside of the fast-exchange limit. J Magn Reson 2002;154(1):157-160.
8. Jin T, Wang P, Zong X, Kim SG. Magnetic resonance imaging of the Amine-Proton EXchange (APEX) dependent contrast. Neuroimage 2012;59(2):1218-1227. 9. Zaiss M, Bachert P. Exchange-dependent relaxation in the rotating frame for slow and intermediate exchange – modeling off-resonant spin-lock and chemical exchange saturation transfer. NMR Biomed 2013;26(5):507-518.
10. Jiang W, Zhou IY, Wen L, Zhou X, Sun PZ. A theoretical analysis of chemical exchange saturation transfer echo planar imaging (CEST-EPI) steady state solution and the CEST sensitivity efficiency-based optimization approach. Contrast Media Mol Imaging 2016;11(5):415-423.
11. Wu R, Xiao G, Zhou IY, Ran C, Sun PZ. Quantitative chemical exchange saturation transfer (qCEST) MRI - omega plot analysis of RF-spillover-corrected inverse CEST ratio asymmetry for simultaneous determination of labile proton ratio and exchange rate. NMR Biomed 2015;28(3):376-383.
Figures