1459
Simultaneous mapping of B0, B1 and T1 for the correction of CEST-MRI1Physikalisch-Technische Bundesanstalt (PTB), Braunschweig and Berlin, Germany
Synopsis
One of the bottlenecks in Chemical Exchange Saturation Transfer (CEST) MRI is its susceptibility to magnetic field inhomogeneities and dependency on T1 relaxation times. To enable efficient correction for these parameters, we propose a new method for simultaneous quantitative mapping of B0, B1 and T1 using a simple CEST sequence with a modified preparation block. For the analysis, we developed a neural network that provides an additional uncertainty estimation for each parameter. First results on phantom simulations demonstrate the feasibility of this approach as well as its applicability for the correction of CEST-MRI data.
Introduction
Chemical Exchange Saturation Transfer (CEST) MRI enables the detection of proton exchanging molecules at low concentrations. As CEST signals are susceptible to B0- and B1-field inhomogeneities and are strongly T1-dependent, it is crucial to correct for the influence of these parameters to isolate the CEST effects1. Conventional approaches for quantitative mapping of B0, B1 and T1 require separate scans for each parameter, which is inefficient and time-consuming. We therefore propose a new method to map all three parameters simultaneously using a simple adapted CEST sequence.Methods
We extended the Water Shift and B1 (WASABI)2 mapping method with a magnetization saturation/dephasing preparation block to enhance its intrinsic sensitivity to the T1 relaxation time. To improve the analysis, we implemented a neural network (NN) using a similar architecture as the deepCEST3 approach. Its probabilistic output layer yields estimates of the three parameters B0, B1 and T1 as well as their uncertainties for every pixel (voxel). The NN of 4 fully-connected hidden layers with 128 neurons each was implemented using the pyTorch framework.WASABI and CEST spectra were simulated with a self-developed Bloch-McConnell simulation tool4 implemented in Python. B0- and B1-inhomogeneity values as well as T1 and T2 relaxation times were varied using distributions that mimic in vivo-like probabilities. We simulated a spectrum with 31 offsets for each combination and added 10 different Gaussian noise levels to each spectrum, leading to ca. 20 million spectra that were used to train the NN. To investigate the performance and demonstrate the applicability of the proposed approach, we designed a virtual phantom with parameters similar to a brain scan at 3 T. We used these phantom simulations and the according maps generated by the NN to demonstrate the effects of different CEST post-processing correction methods for B05, B16 and T17.
Results
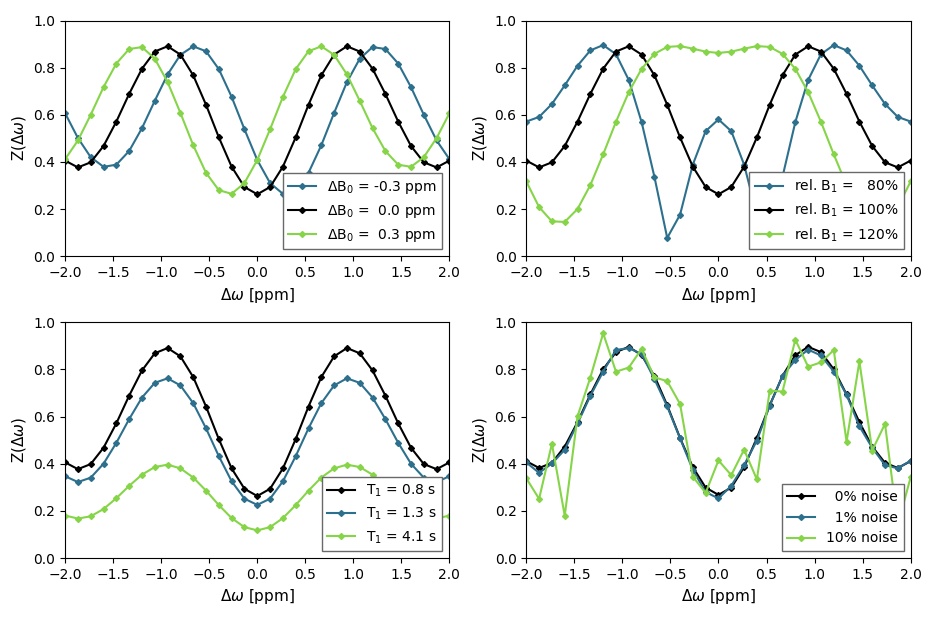
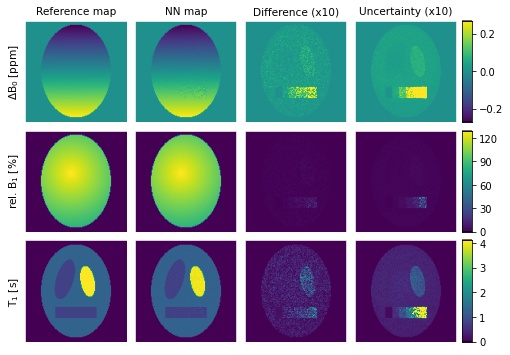
Simulated spectra for exemplary values of the different parameters, mainly the extrema, are shown in Figure 1. After training the NN for 100 epochs, the evaluation of a separate test set (5% of the data) resulted in a mean ΔB0-shift error of 0.003 ppm, a mean relative B1 error of 0.22% and a mean T1 error of 0.05 s.Figure 2 displays the results of the application of the NN on simulated phantom data. It shows the reference maps, respective NN predictions, differences between both maps and uncertainty estimations of the NN. All predicted parameter maps are in good agreement with the reference maps. The B0- and T1-maps both show a higher difference in the compartment with the longest T1 = 4.1 s and all maps show increasing differences with increasing noise. The uncertainty estimates match the difference maps well, displaying higher uncertainties for regions with higher differences and vice versa. Statistical evaluation of the phantom data yielded a mean ΔB0-shift error of 0.004 ppm with a maximum of 0.07 ppm, a mean B1 error of 0.14% with a maximum of 4.48% and a mean T1 error of 0.04 s with a maximum of 0.45 s.
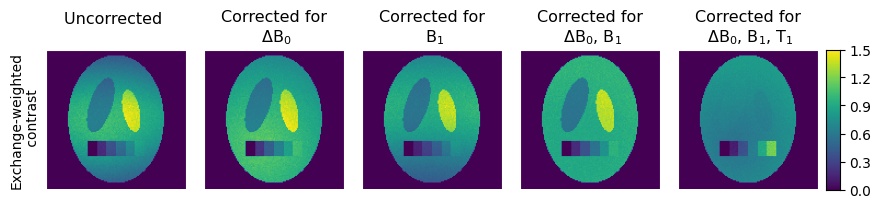
An exemplary application of the approach for the correction of simulated CEST data is displayed in Figure 3, which shows the individual and combined effects of the B0 and B1 corrections on the exchange-weighted contrast MTRRex and the additionally T1-compensated AREX contrast7. The correction for all three parameters eliminates the pseudo CEST contrast between the elliptical compartments (due to field inhomogeneities and differences in the relaxation times) and highlights the differentiation of the real CEST effects in the rectangular compartment (due to different CEST pool fractions).
Discussion
Our preliminary results prove the feasibility of simultaneous B0-, B1- and T1-mapping via NN analysis. Overall, the generated maps are in good agreement with the reference for most realistic scenarios. The phantom evaluation indicates that maximum errors occur for longest T1 and highest noise values. Therefore, representation of these values in the training data must be investigated and further pre-processing like adaptive denoising should be considered. Nevertheless, the uncertainty estimation, showing higher uncertainties for higher differences, allows for reliable evaluation of all mapping results.We are confident that pending in vitro and in vivo scans will validate the effectivity of the proposed method. The ongoing optimization of the NN architecture and post-processing will further improve mapping results and allow for a reduction of acquired offsets and thereby a reduction of acquisition time. Thus, combining the optimized approach with a single-shot 3D acquisition scheme like snapshot-CEST will enable simple and reliable 3D mapping of B0, B1 and T1 in about 1 minute.
Conclusion
We presented a new method for simultaneous mapping of B0, B1 and T1 that combines a modified WASABI acquisition with a NN analysis. Due to its simplicity and its intrinsic uncertainty estimation, we are confident that the approach will find a broad application in quantitative parameter mapping. As demonstrated, the necessity of a reliable B0, B1 and T1 quantification and correction to isolate real CEST effects from other pseudo effects makes this method especially valuable for the correction of CEST-MRI data.Acknowledgements
This work was funded by Deutsche Forschungsgemeinschaft
(DFG) under grants SCHU 3468/1-1 and SFB 1340/C03.
References
1. Zaiss M, Herz K, Deshmane A, et al. Possible artifacts in dynamic CEST MRI due to motion and field alterations. J Magn Reson. 2019;298:16–22.
2. Schuenke P, Windschuh J, Roeloffs V, et al. Simultaneous mapping of water shift and B1 (WASABI)-Application to field-inhomogeneity correction of CEST MRI data. Magn Reson Med. 2017;77(2):571-580
3. Glang F, Deshmane A, Prokudin S, et al. DeepCEST 3T: Robust MRI parameter determination and uncertainty quantification with neural networks-application to CEST imaging of the human brain at 3 T. Magn Reson Med. 2019;84(1):450–466
4. Pulseq-cest. https://pulseq-cest.github.io/. Accessed December 14, 2020
5. Kim M, Gillen J, Landman B, et al. Water saturation shift referencing (WASSR) for chemical exchange saturation transfer (CEST) experiments. Magn Reson Med. 2009;61(6):1441-1450.
6. Windschuh J, Zaiss M, Meissner J, et al. Correction of B1-inhomogeneities for relaxation-compensated CEST imaging at 7 T. NMR Biomed. 2015;28(5)529-537
7. Zaiss M, Xu J, Goerke S, et al. Inverse Z-spectrum analysis for spillover-, MT-, and T1-corrected steady-state pulsed CEST-MRI-application to pH-weighted MRI of acute stroke. NMR Biomed. 27(3):240–252
Figures