1458
Indirect Inference of Acidification in Exercised Skeletal Muscle using Creatine CEST1Radiology, University of Pennsylvania, Philadelphia, PA, United States, 2Siemens Medical Solutions USA Inc, Malvern, PA, United States
Synopsis
Intracellular acidosis, mainly due to lactic acid accumulation, has been regarded as the major contributor of skeletal muscle fatigue and may be a contributing factor across many musculoskeletal disorders, such as peripheral arterial disease (PAD), Duchenne dystrophy and Becker dystrophy, primary mitochondrial disorders, diabetes mellitus, and cardiovascular disease. Hence, an imaging biomarker capable of inferring the underlying acidification during varying exercise conditions could be valuable in assessing the efficacy of potential therapy options. Here, we demonstrate the feasibility of indirect detection of acidification in exercised skeletal muscle using creatine CEST.
Introduction
Creatine is an important biochemical metabolite that is involved in facilitating energy transport by converting phosphocreatine(PCr) to creatine(cr) via creatine kinase (CK) kinetics (i.e. PCr + ADP + H+ ⇌ Cr +ATP). The post exercise creatine recovery can be assessed via creatine weighted chemical exchange saturation transfer (CrCEST)[1]. The rate of PCr (1/τPCr) or Cr (1/τCr) recovery after exercise is strongly coupled to net mitochondrial oxidative phosphorylation (OXPHOS), with longer τPCr (or τCr) being suggestive of lower OXPHOS capacity. Here, we show the feasibility of making indirect inference about the acidification due to lactate generation based on CrCEST.Methods
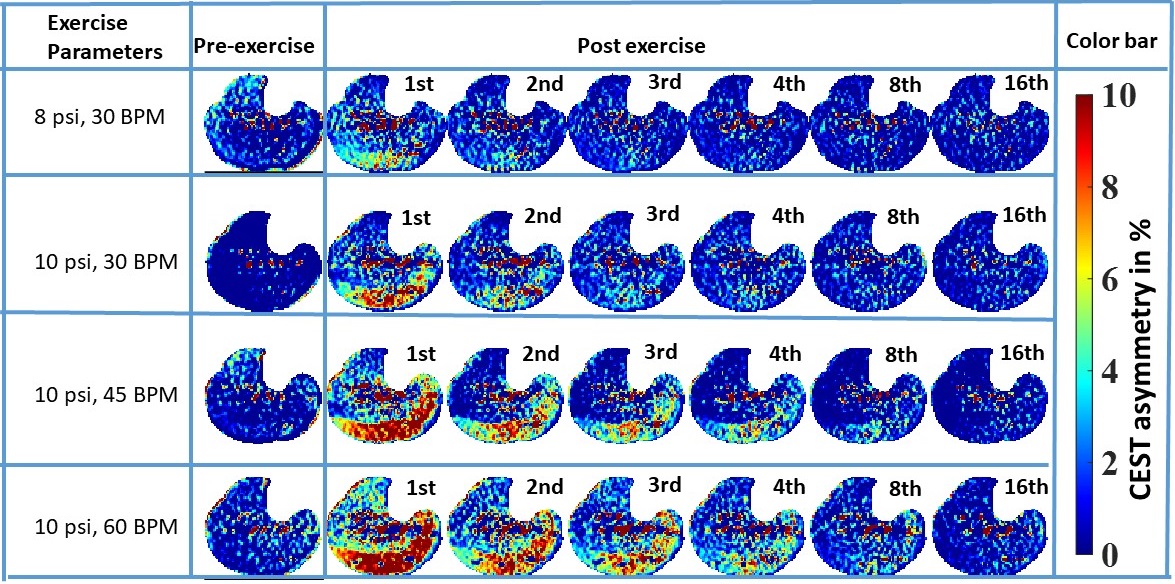
Subjects were scanned under an approved IRB by the University of Pennsylvania and gave written informed consent. All MR images were acquired at a 7T MRI scanner (MAGNETOM Terra, Siemens Healthcare, Erlangen, Germany) using a 28-Channel phased-array knee coil (Quality Electrodynamics, Mayfield Village, USA). First baseline CrCEST data was performed for 2 minutes. For moderate exercise one (ME1) and moderate exercise two (ME2) there were 2 minutes of plantar flexion exercise (PFE) with push pedal frequency (PPF) of 30 beats per minute (BPM) at 8 pound per square inch (psi) and 22% of the subject’s maximal voluntary contraction (MVC), respectively. The setup of intense exercise one (IE1) and intense exercise two (IE2) kept the patient’s MVC at 22% and the compression rate increased to 45 and 60 compressions/min, respectively. The prototype sequence consisted of the pulse train (5x100ms Hanning windowed, duty cycle 99%, B1,rms of 2.9 μT ), followed by GRE read out with TR = 3.5ms, TE = 1.47ms, BW= 710Hz/pixel. A turbo factor of 536 was needed to acquire data of the matrix size of 112×112×8 (resolution 1.4x1.4x5mm3) by employing the spiral view order with elliptical scanning. GRAPPA with acceleration factors of two along PE, no acceleration along 3Dand 24 reference lines were used to speed up the acquisition. B0- and B1-correction: Water saturation shift referencing (WASSR) images (from ±0 to ±0.9 ppm with a step-size of ±0.15 ppm), with a saturation pulse at B1,rms of 0.29μT with 200ms duration, was used to correct for B0-inhomogeneities [2]. For B1-correction, a nonlinear correction was used as described in our earlier work [3].Results
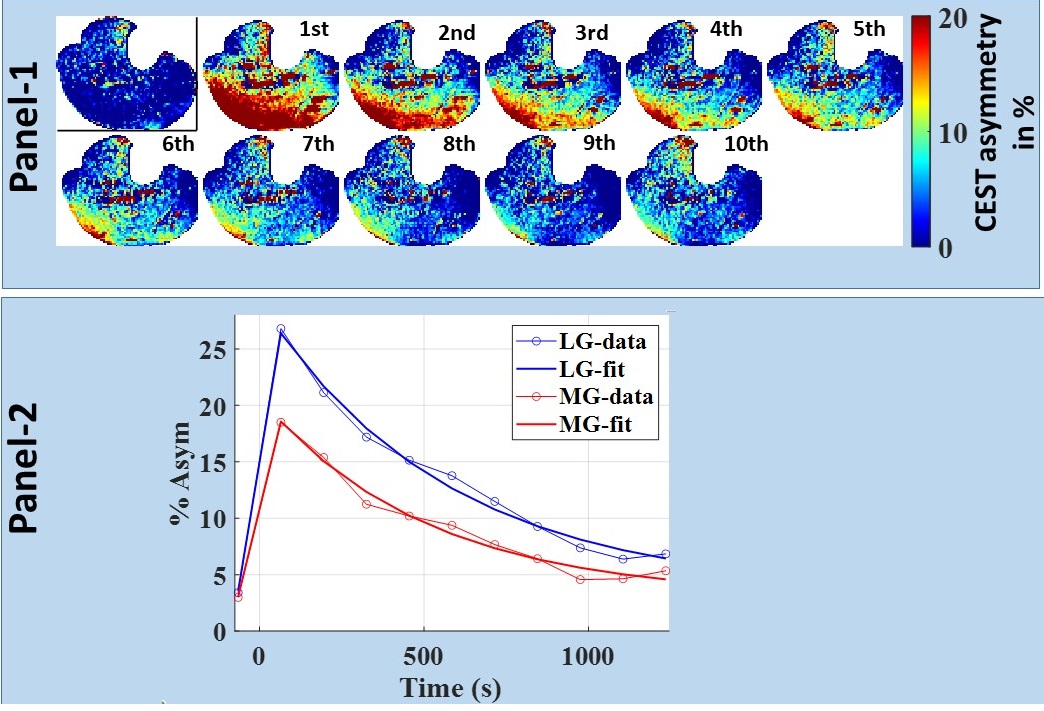
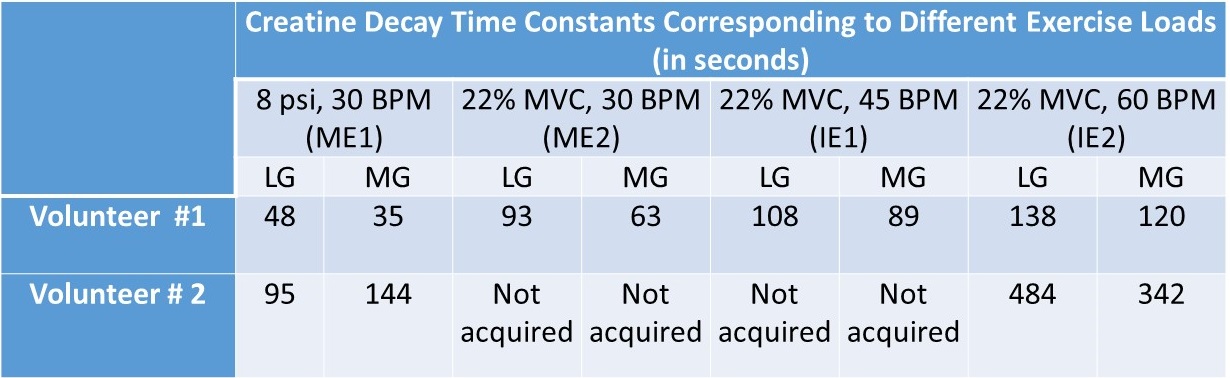
For better visual assessment of time-series of CrCEST maps, Fig. 1 depicts the difference between CrCEST maps at intermediate time points (t) and at the last time point (tend): ΔCrCEST(t) = CrCEST(t)- CrCEST(tend). Since the baseline values for CrCEST are significant, such subtraction suppresses the effect of baseline across all frames, making the temporal trend more conspicuous. As evident from Fig. 1, the muscle specific τCr-values increases with increased exercise load. This trend was consistent across both volunteers (refer Tab. 1). We also verified the significant lactate accumulation in volunteer #1 using lactate CEST with sequence parameters as described in DeBrosse et al. [4].Discussion
For mild plantar flexion exercise (PFE) in healthy controls, CK kinetics is mostly responsible for supplying the ATP needed during exercise. However, as the exercise load is increased, pushing PFE to an intense workload regime, the lactate pathway increasingly starts getting utilized and that leads to acidification due to lactate generation. Subsequently, we have demonstrated that the τCr decreases with the increased exercise intensities. We have also conclusively detected lactate being generated at the exercise workload of 22% MVC and PPF = 60 BPM with an exercise time of 2 minutes. Our findings are consistent with an in vitro study on a 31P-NMR based study, where an appreciable reduction in the forward reaction of creatine enzyme kinetics with decreased pH (approximately 20%-30% drop from pH 7.0 to pH 6.5) has been shown. Intracellular acidosis mainly due to lactic acid accumulation has been regarded as the major contributor of skeletal muscle fatigue and may be a contributing factor across many musculoskeletal disorders, such as Peripheral arterial disease (PAD), Duchenne dystrophy, and Becker dystrophy, and mitochondrial systemic disorder, namely primary mitochondrial disorders [5], diabetes mellitus [6] and cardiovascular disease [7]. Hence, there is an unmet need for an imaging biomarker capable of inferring the underlying acidification during varying exercise conditions. Such a tool could be valuable in assessing the efficacy of potential therapy options. Though the acidification can also be assessed using lactate CEST as well, it cannot be performed at lower field strength (≤3T) as the lactate hydroxyl peak resonates close to the water. On the other hand, CrCEST has been successfully implemented at the field strength of 3T as well.In future, we will be working on recruiting more participants and would be investigating whether the change in τCr or some other aspect of CrCEST can be calibrated to measure pH changes indirectly.
Conclusions
We have demonstrated the feasibility of indirectly inferring the state of acidification in skeletal muscle due to lactate generation using CrCEST, a method which could be employed at field strength (≥3T).Acknowledgements
This project was supported by National Institute of Biomedical Imaging and Bioengineering of the National Institute of Health through grant number P41-EB015893 (NIH/NIBIB) and R56-AG062665 (NIH).References
1. Kogan F, Haris M, Debrosse C, et al. In vivo chemical exchange saturation transfer imaging of creatine (CrCEST) in skeletal muscle at 3T. J Magn Reson Imaging. Published online 2014. doi:10.1002/jmri.24412
2. Kim M, Gillen J, Landman BA, Zhou J, Van Zijl PCM. Water saturation shift referencing (WASSR) for chemical exchange saturation transfer (CEST) experiments. Magn Reson Med. Published online 2009. doi:10.1002/mrm.21873
3. Kumar D, Nanga RPR, Thakuri D, et al. Recovery kinetics of creatine in mild plantar flexion exercise using 3D creatine CEST imaging at 7 Tesla. Magn Reson Med. Published online 2021. doi:10.1002/mrm.28463
4. DeBrosse C, Nanga RPR, Bagga P, et al. Lactate Chemical Exchange Saturation Transfer (LATEST) Imaging in vivo A Biomarker for LDH Activity. Sci Rep. 2016;6. doi:10.1038/srep19517
5. DeBrosse C, Nanga RPR, Wilson N, et al. Muscle oxidative phosphorylation quantitation using creatine chemical exchange saturation transfer (CrCEST) MRI in mitochondrial disorders. JCI Insight. Published online 2016. doi:10.1172/jci.insight.88207
6. Popovich BK, Boheler KR, Dillmann WH. Diabetes decreases creatine kinase enzyme activity and mRNA level in the rat heart. Am J Physiol - Endocrinol Metab. Published online 1989. doi:10.1152/ajpendo.1989.257.4.e573
7. Ooi DS, Isotalo PA, Veinot JP. Correlation of antemortem serum creatine kinase, creatine kinase-MB, troponin I, and troponin T with cardiac pathology. Clin Chem. Published online 2000. doi:10.1093/clinchem/46.3.338
Figures