1453
Open source Pulseq interpreter for CEST MRI on Bruker systems1High-field Magnetic Resonance Center, Max Planck Institute for Biological Cybernetics, Tuebingen, Germany, 2Department of Biomedical Magnetic Resonance, Eberhard Karls University Tuebingen, Tuebingen, Germany, 3Department of Neuroradiology, University Hospital Erlangen, Erlangen, Germany
Synopsis
CEST MRI becomes a frequently applied tool, however, a lot of method development is still done on pre-clinical scanners. Here we propose an approach that allows a fully automatic combination of existing MRI readouts for Bruker systems with open source pulseq-files for definition of CEST pre-saturation, without additional sequence programming. We believe that our work facilitates both basic research on CEST MRI and straightforward implementation of sophisticated, precisely defined CEST experiments on Bruker systems. Additionally, the use of Pulseq provides a universal, sharable standard to run the exact same pre-saturation in simulations and on clinical devises at a later stage.
Introduction
Chemical Exchange Saturation Transfer (CEST) MRI (1,2) is gaining increased attention in the field of clinical MR imaging as it provides not only anatomic but also metabolic and micro-environmental information without the need of external contrast agents. CEST MRI requires a specific pre-saturation module depending on the targeted CEST contrast, which means the MR imaging sequence needs to be adapted. Recently it was shown that the open source Pulseq project (3) provides an elegant framework of sharing information on the CEST pre-saturation (4). In this work, we propose an implementation that automatically combines an existing Bruker readout with a pulseq-file, generating a fully functional CEST MR sequence. The implementation does not require any manual sequence programming in the Bruker framework and should therefore facilitate a faster development and broader application of preclinical CEST MRI, as well as direct comparison with clinical systems. Finally, the same pulseq-file can be used for numerical simulations to directly compare with Bloch-McConnell theory.Methods
Code to generate sequences is implemented in MATLAB (The Mathworks Inc., USA; code: https://gitlab.com/SebMue/pulseq_cest_hybrid_bruker) and consist of two parts: first the pulseq-file is parsed and converted to a Bruker-compatible format; second a Bruker (Bruker BioSpin GmbH, Germany) “method” is read. This Bruker "method" is analyzed in a way that the pulseq-file can be integrated automatically. Finally, an adapted version of the original sequence is returned, now containing the CEST pre-saturation as defined by the pulseq-file and the original readout subsequently. The returned “method” can directly be copied onto the MR scanner and maintains full flexibility of the readout settings. With this, it becomes possible to perform snapshot (5) CEST MRI acquisitions without the need of any sequence programming. The CEST pre-saturation module is included into the outermost repetition (Bruker notation: NR) loop of the readout (order: slice-3D-averages-NR). Due to the flexibility of Pulseq, complex saturation patterns can be implemented easily. This for instance also enables CEST fingerprinting (6) experiments. All measurements were exemplarily performed in a model solution that contained phosphate buffered saline (1X stock solution; according to (7)), agarose (Agarose NEEO ultra‐quality, Carl Roth, Germany) and L-arginine (Fluka Chemie, Switzerland). The pH value was adjusted using hydrochloric acid (Sigma-Aldrich Laborchemikalien, Germany) and Gd-DOTA (gadoterate meglumine (dotarem® 500 mmol/L), Guerbet, Germany) was used to reduce T1.Results
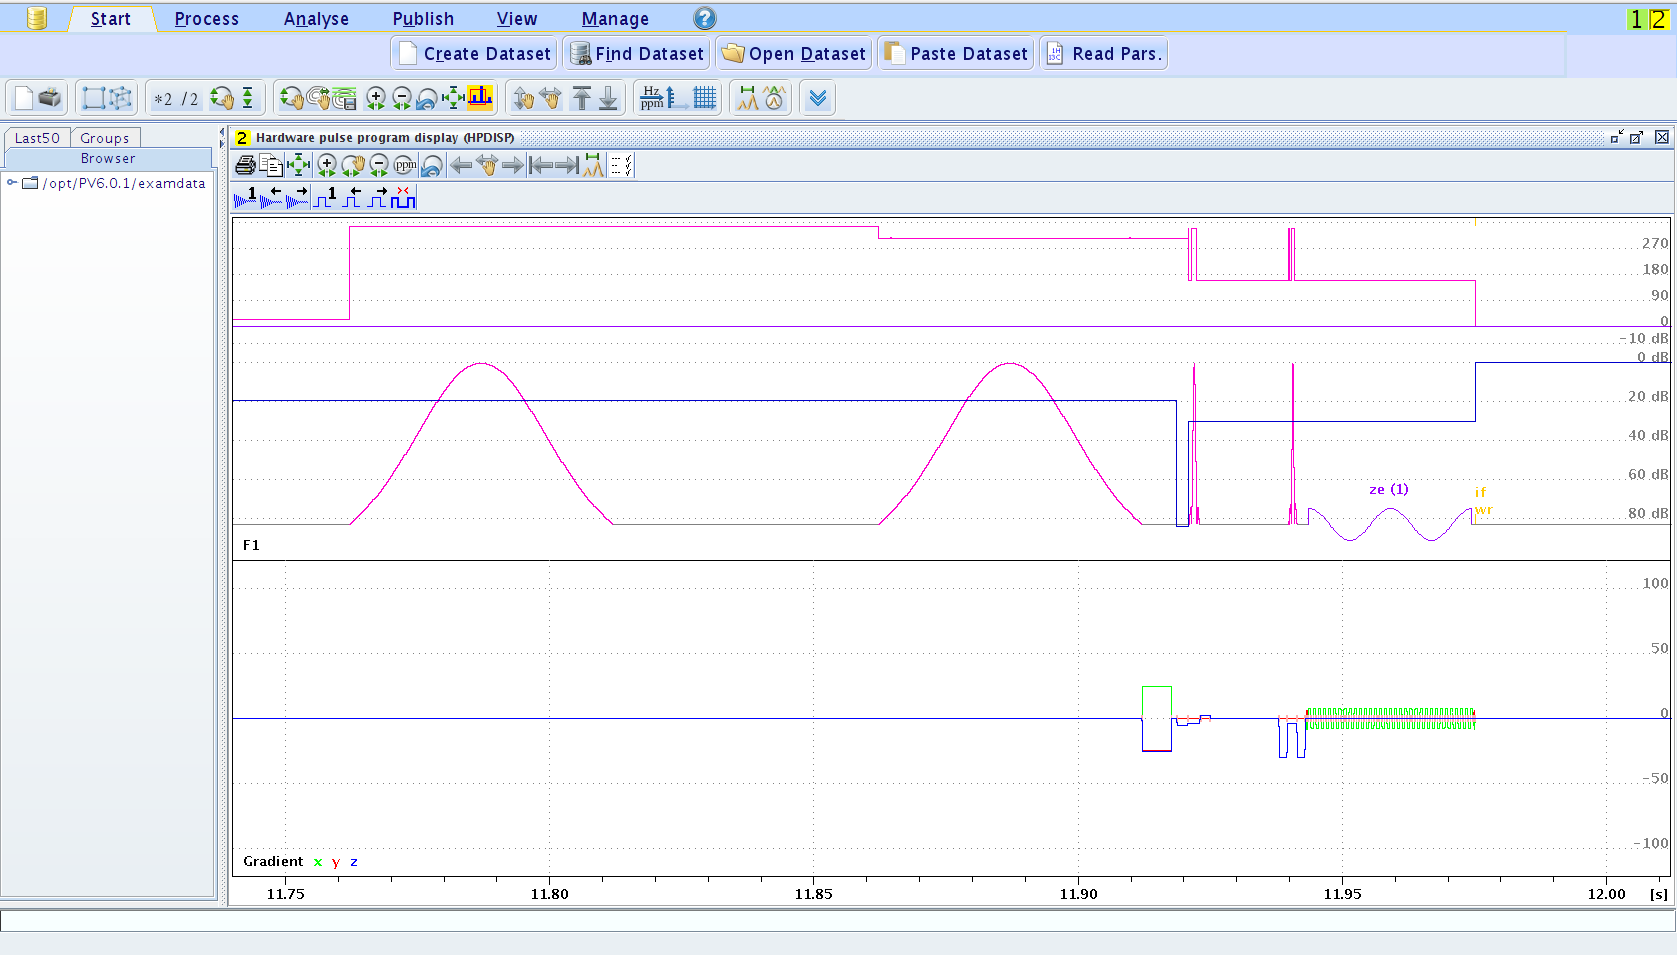
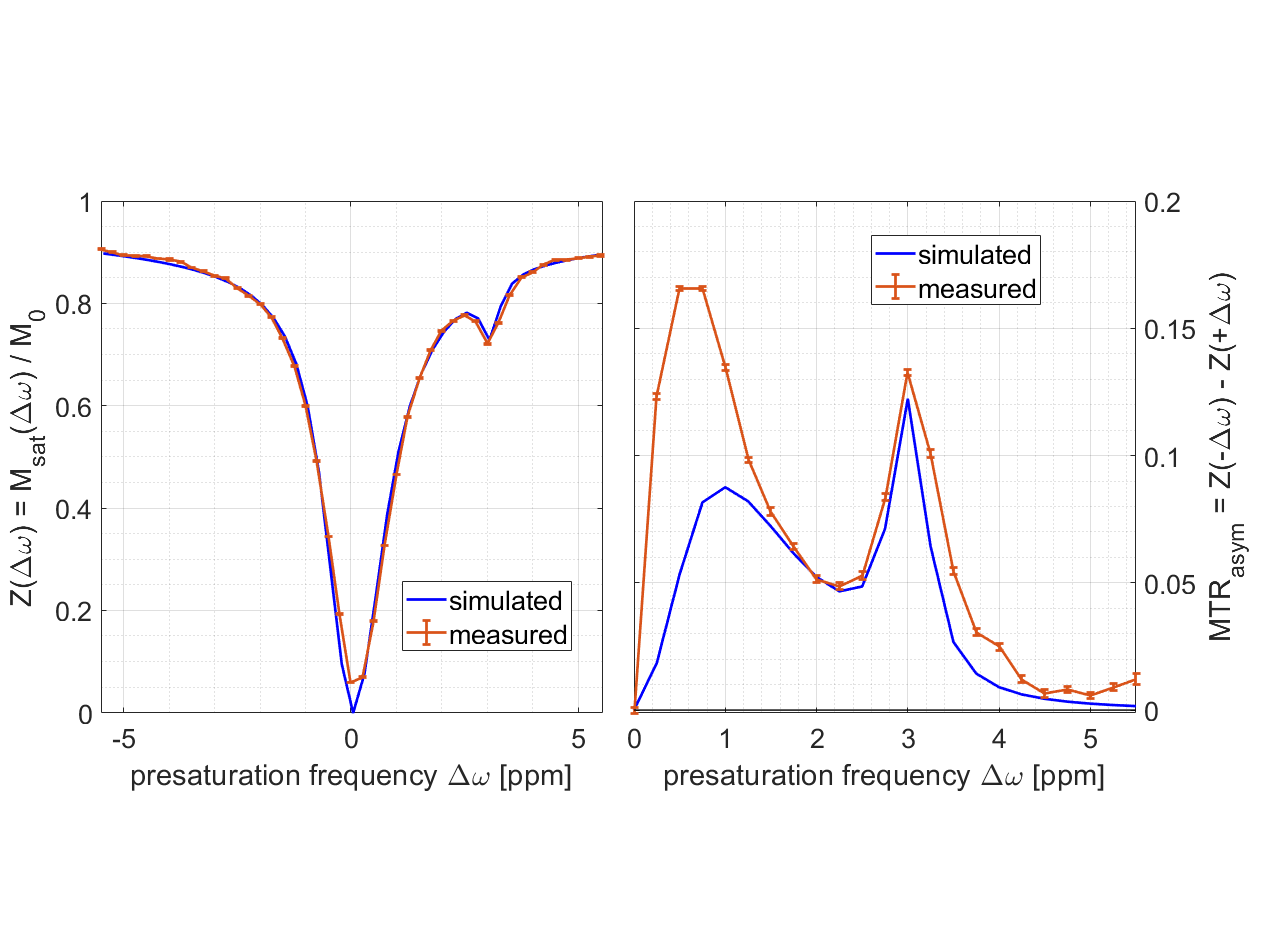
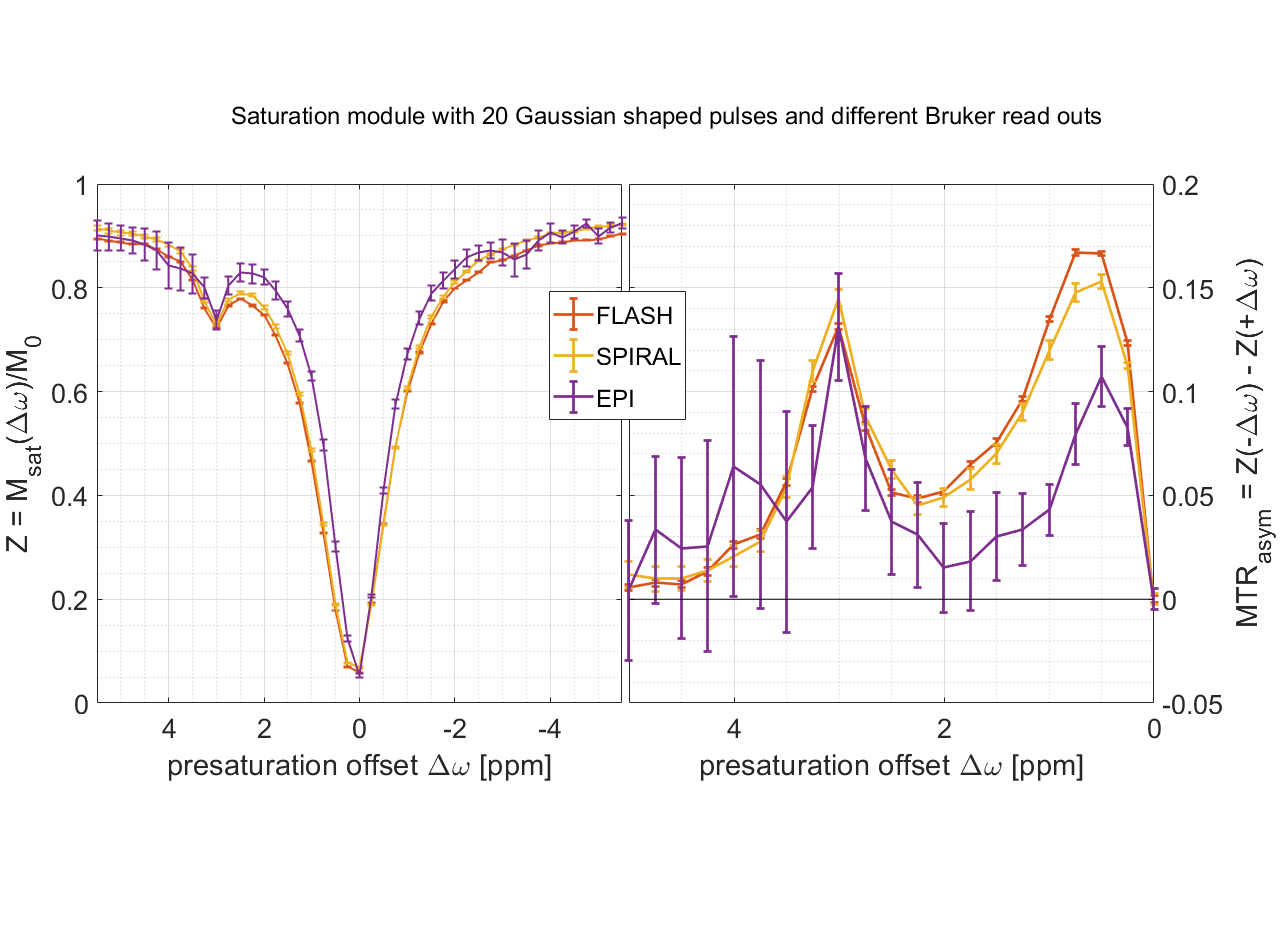
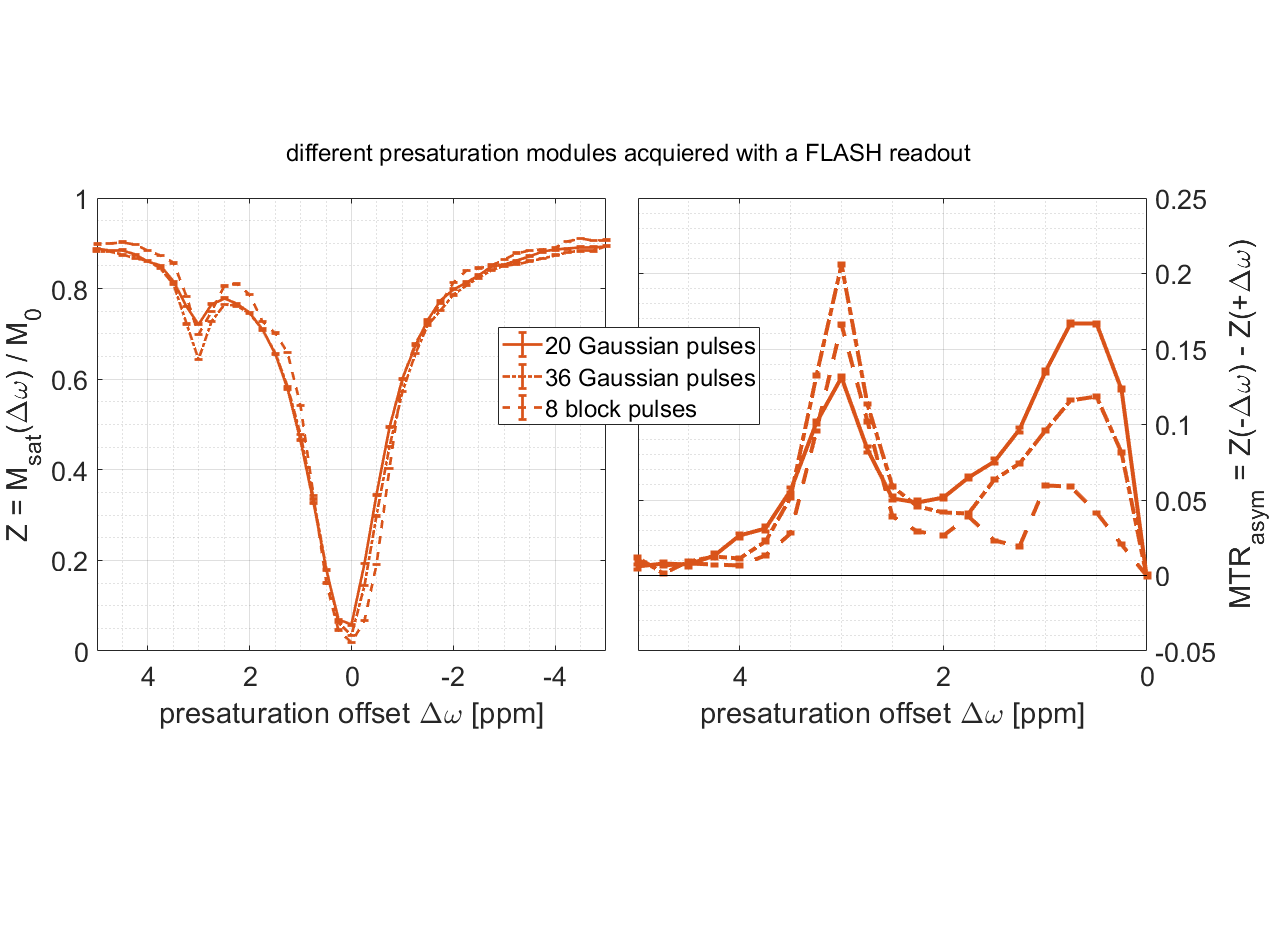
As a proof of principle, three published APTw pre-saturation modules [APTw_001-003 on https://pulseq-cest.github.io/] as well as WASABI (8) and T1 weighted (saturation recovery with adiabatic half passages) preparation modules were considered. The referring pulseq-files were exemplarily combined with Bruker’s RARE, EPI, FISP, FLASH and SPIRAL readouts and measured in the L-arginine model solution at a 14.1 T animal scanner (Magnex Scientific, United Kingdom/Bruker Biospin, Germany). An exemplary Bruker simulation of the sequence diagrams for a single pre-saturation offset is shown in Figure 1. As the pulseq-files contain all information about the CEST pre-saturation, they can directly be used to simulate the Z-spectrum and compare this expectation to the measured data, or to fit a Bloch simulation to the data. One exemplary simulation is shown in Figure 2 with used Bloch parameters stated in the caption. Arbitrary pre-saturation pulse shapes are supported, for instance matched adiabatic spinlock pulses (9), too. Resulting Z-spectra for different readouts and different pre-saturation modules for the vendor provided FLASH readout are shown in Figures 3 and 4.Discussion
Herein we presented a fully automatic approach to combine CEST pre-saturation modules with established readout methods for Bruker, without the requirement of sequence programming in the Bruker framework. While the CEST pre-saturation is strictly defined by the corresponding pulseq-file, all settings for the readout method can be adapted in the user interface in the typical way. As only the outermost NR-loop is modified, the user may stick to the established read out, which solely gets extended by the possibility of performing CEST MRI. This should also allow well designed CEST experiments even though the user might not be specialized on CEST MRI.Conclusion
The proposed method provides a straightforward way to perform sophisticated CEST MRI experiments on Bruker MR systems without explicit knowledge on CEST MRI or sequence programming. Additionally, by exploiting the benefits of pulseq-files for sharing information on CEST pre-saturation it is possible to share exact pre-saturation blocks and perform the same experiments on different platforms, this especially bridges the gap between pre-clinical and clinical implementations.Acknowledgements
The financial support of the Max Planck Society is gratefully acknowledged.References
1. Wolff SD, Balaban RS. NMR imaging of labile proton exchange. Journal of Magnetic Resonance (1969) 1990;86:164–169 doi: 10.1016/0022-2364(90)90220-4.
2. Guivel-Scharen V, Sinnwell T, Wolff SD, Balaban RS. Detection of Proton Chemical Exchange between Metabolites and Water in Biological Tissues. Journal of Magnetic Resonance 1998;133:36–45 doi: 10.1006/jmre.1998.1440.
3. Layton KJ, Kroboth S, Jia F, et al. Pulseq: A rapid and hardware-independent pulse sequence prototyping framework. Magnetic Resonance in Medicine 2017;77:1544–1552 doi: https://doi.org/10.1002/mrm.26235.
4. Herz K. pulseq-CEST: Towards reproducible CEST experiments using an open source sequence definition standard. In: 8th International Workshop on Chemical Exchange Saturation Transfer Imaging, Atlanta, USA (virtual); 2020.
5. Zaiss M, Ehses P, Scheffler K. Snapshot‐CEST: Optimizing spiral‐centric‐reordered gradient echo acquisition for fast and robust 3D CEST MRI at 9.4 T. NMR in Biomedicine 2018;31 doi: 10.1002/nbm.3879.
6. Cohen O, Huang S, McMahon MT, Rosen MS, Farrar CT. Rapid and quantitative chemical exchange saturation transfer (CEST) imaging with magnetic resonance fingerprinting (MRF). Magnetic Resonance in Medicine 2018;80:2449–2463 doi: 10.1002/mrm.27221. 7. Phosphate-buffered saline (PBS). Cold Spring Harb Protoc 2006;2006:pdb.rec8247 doi: 10.1101/pdb.rec8247.
8. Schuenke P, Windschuh J, Roeloffs V, Ladd ME, Bachert P, Zaiss M. Simultaneous mapping of water shift and B1 (WASABI)-Application to field-Inhomogeneity correction of CEST MRI data. Magn Reson Med 2017;77:571–580 doi: 10.1002/mrm.26133.
9. Herz K, Gandhi C, Schuppert M, Deshmane A, Scheffler K, Zaiss M. CEST imaging at 9.4 T using adjusted adiabatic spin-lock pulses for on- and off-resonant T1⍴-dominated Z-spectrum acquisition. Magnetic Resonance in Medicine 2019;81:275–290 doi: 10.1002/mrm.27380.
10. Mueller S, Scheffler K, Zaiss M. On the interference from agar in chemical exchange saturation transfer MRI parameter optimization in model solutions. NMR in Biomedicine n/a:e4403 doi: 10.1002/nbm.4403.
Figures