1452
Reduction of 7T CEST scan time and evaluation by L1-regularised linear projections1Department of Neuroradiology, University Hospital Erlangen, Friedrich Alexander University Erlangen-Nürnberg, Erlangen, Germany, 2High-field Magnetic Resonance Center, Max Planck Institute for Biological Cybernetics, Tübungen, Germany, 3Department of Neuroradiology, University Hospital Erlangen, Erlangen, Germany, 4Department of Neurology, Epilepsy Center, University Hospital Erlangen, Erlangen, Germany
Synopsis
Measurement and evaluation of multi-parametric CEST protocols requires complex and time consuming processing for correction of field inhomogeneities and contrast generation. In this work, we expand the linear projection approach for mapping motion corrected 7T CEST data directly to Lorentzian target parameters by L1-regularisation. This translates to subsampling in the frequency offset domain, resulting in reduced acquisition time. The method generalizes from healthy subject training data to unseen healthy test data and a tumor patient dataset. The L1-regularized linear projection approach integrates shortcutting of B0 and B1 correction, denoising, and Lorentzian fitting. It enforces sparsity of required frequency offsets.
INTRODUCTION
Chemical exchange saturation transfer (CEST) imaging, while offering insight into low concentrated solutes, often requires both long scan times and complex mathematical models for extraction of CEST contrast parameters1-4. Isolated evaluation necessitates densely sampled Z-spectra, determining the acquisition time of CEST protocols. It is desirable to have a fast and simple method to measure and evaluate CEST data. In this work, linear projection-based CEST reconstruction 14 is expanded by L1-regularisation (‘LASSO’), addressing a guided subsampling of Z-spectra.METHODS
Data were acquired from 6 healthy subjects and a tumor patient, after written informed consent and under approval of the local ethics committee, at a MAGNETOM Terra 7-Tesla scanner (Siemens Healthcare GmbH, Erlangen, Germany) with an 32ch Rx and 8ch pTx head coil.Homogeneous Gaussian pre-saturation was realized using the MIMOSA scheme (120 pulses, tp=15 ms, duty cycle DC=60.56%). B1 maps were acquired to form B1-CP and B1-MIMOSA maps.5
Two different saturation B1 power levels of 0.72 μT and 1.00 μT were applied. Image readout was a centric 3D snapshot GRE6 (TE=1770ms, TR=3700ms, FA=6°, FOV=230x186.875x21mm, matrix size 104x128x18). GRAPPA 2 was applied in the first phase encoding direction.7 For the full measurement, 56 frequency offsets were distributed non-equidistantly between -100 and 100 ppm, finer between -5 and 5 ppm. A normalization image was acquired at an offset frequency of -300 ppm. Total acquisition time for both B1 was 13min 24s. The LASSO-reduced measurement was performed with 15 offsets at low B1 and 23 offsets at high B1, with a total measurement time of 4min 48s.
Z-spectra of both B1 levels, B1-CP and B1-MIMOSA values in each voxel form vectors , which are collected over several subject datasets, resulting in the (N x O) input data matrix Z. Lorentzian parameters generated according to 10 are assembled into the (N x L) target matrix Y. A target CEST parameter in a voxel is approximated by [1]
$$y=\vec{z}_i \cdot \vec{\beta}=\sum_{k=1}^O z_k \beta_k \qquad \mathrm{[1]}$$
with linear regression coefficient $$$\vec{\beta}$$$. For multiple target parameters, the regression coefficients form the matrix B.14
Potential reduction of scan time is achieved by enforcing row sparsity on $$$𝑩$$$ via L2-L1-regularization9, leading to the convex optimization objective [2]
$$\hat{\mathbf{B}}_{rowLASSO} = argmin_B(||\mathbf{Y}-\mathbf{ZB}||_F^2 + \lambda ||\mathbf{B}||_{1,2}) \qquad ||\mathbf{B}||_{1,2}=\sum_{i=1}^O \sqrt{\sum_{j=1}^L B_{ij}^2} \qquad \mathrm{[2]}$$
which has globally optimal solutions that can be found iteratively.8 The L2-L1 norm (‘rowLASSO’) forces rows of B, corresponding to the contribution of individual offsets, to become zero. Solutions for various lambdas are fast to calculate allowing to find solutions for all possible numbers of retained offsets. In this work, the number of non-zero rows still allowing the generation of multiple target parameters was chosen to be $$$N_{retained}=38$$$ out of $$$110$$$.
The generation of Lorentzian parameter maps from a new reduced dataset, where all offsets rendered irrelevant by the LASSO have been removed, is a linear projection onto B as in [3].
$$\mathbf{Y}_{new} = \mathbf{Z}_{new} \mathbf{\hat{B}}_{rowLASSO} \qquad \mathrm{[3]}$$
The retrospective optimization of equation [2] for $$$N_{retained}=38$$$, performed on fully sampled spectra, yielded a reduced offset table.
RESULTS
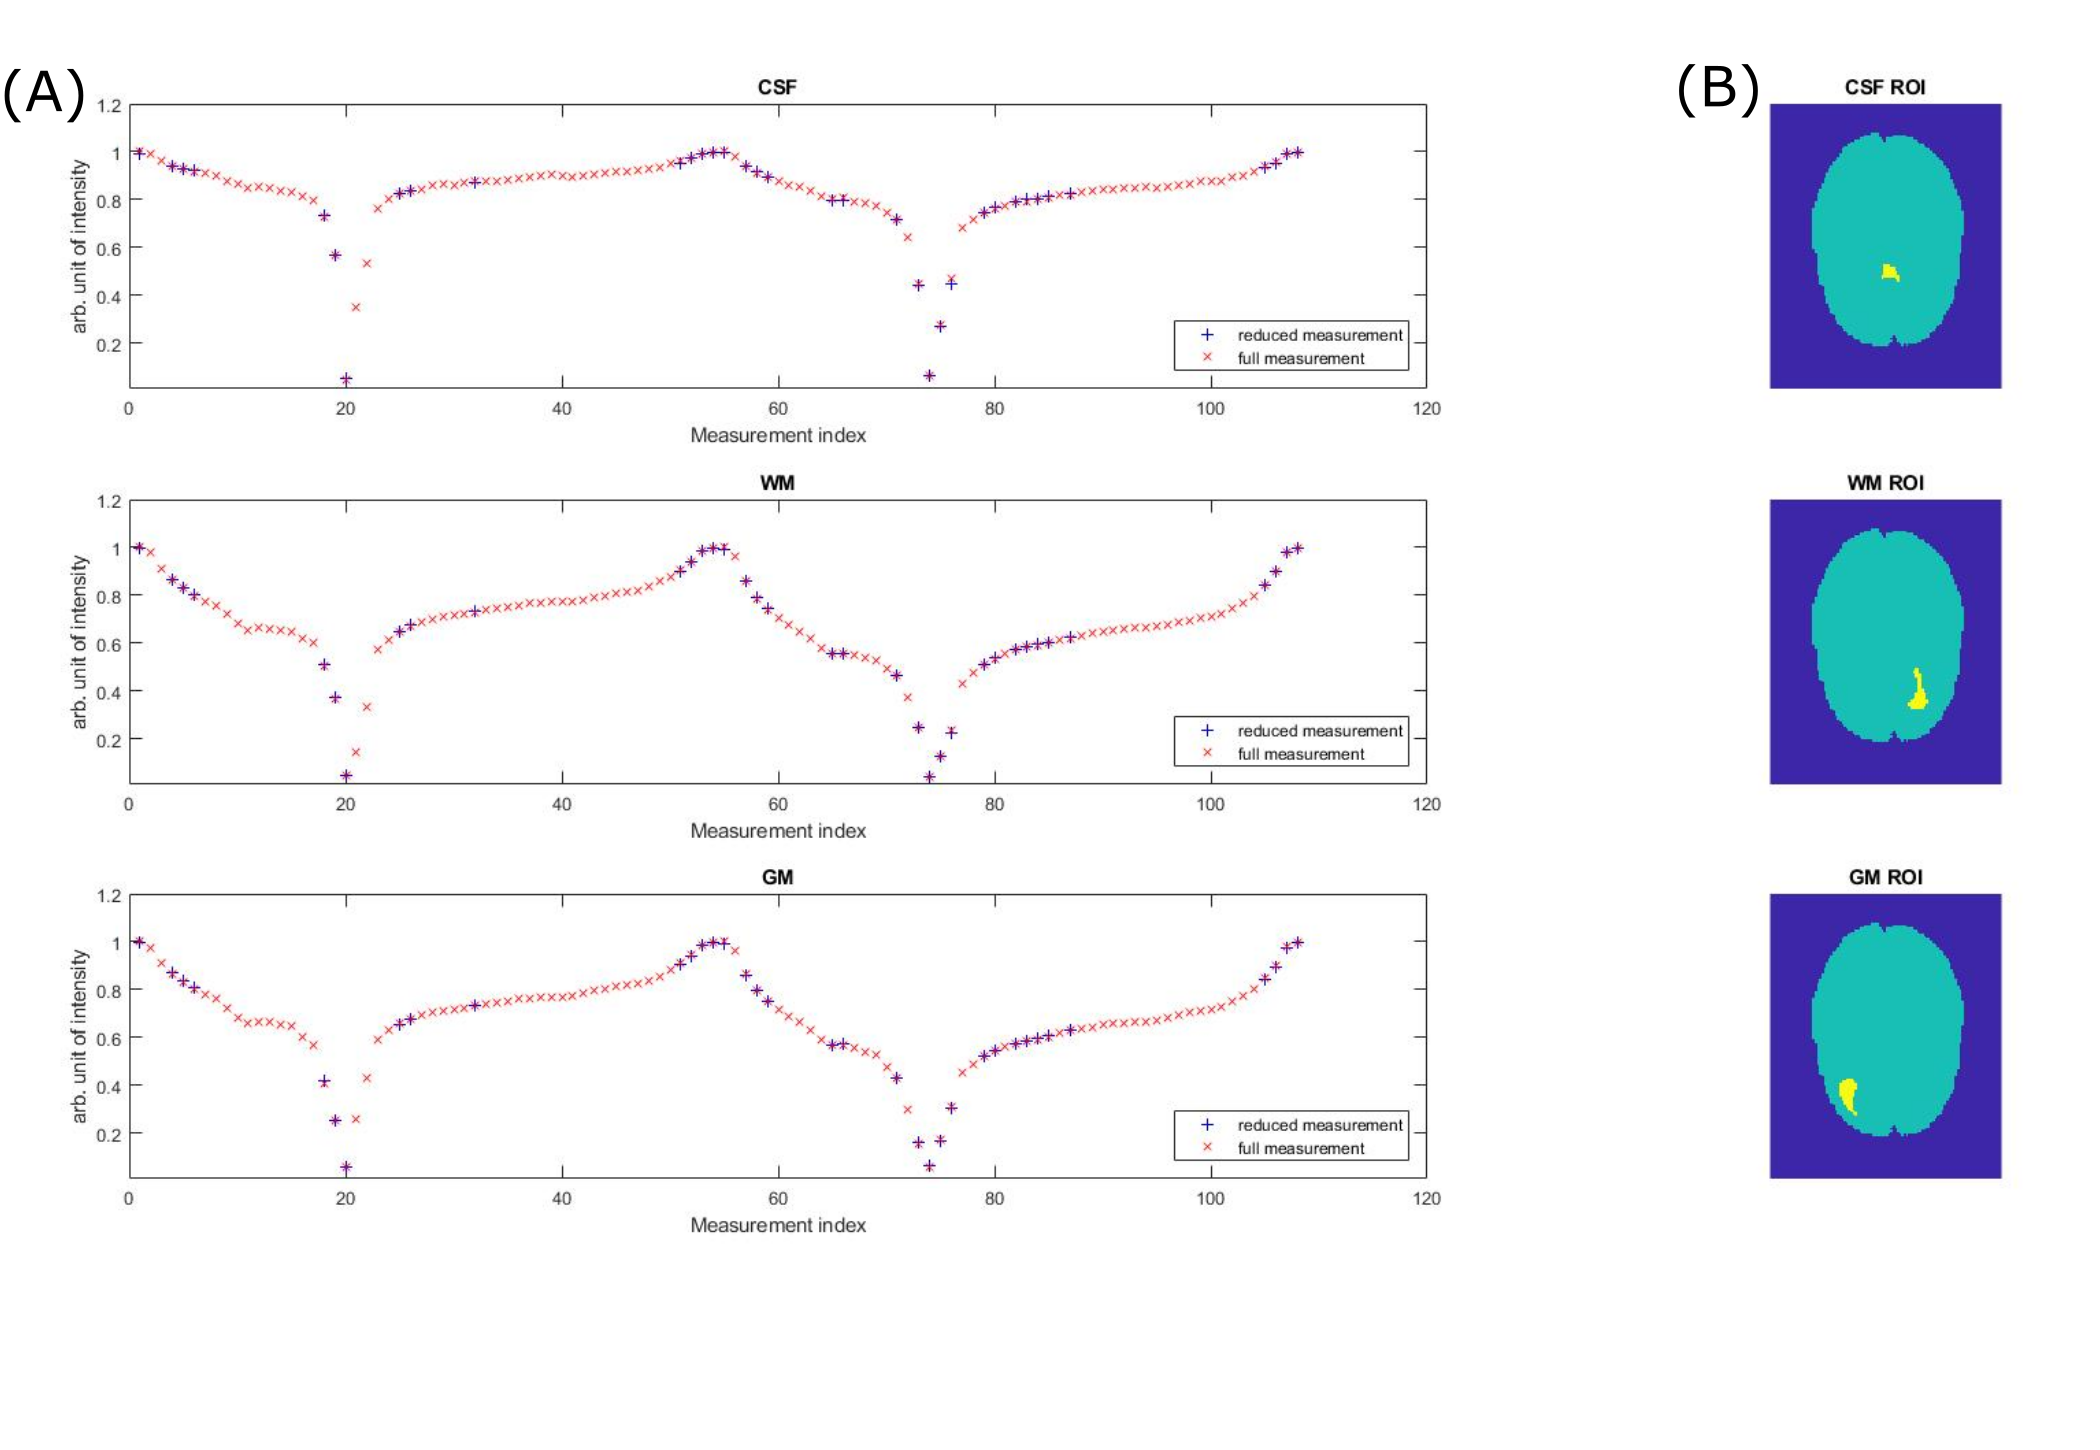
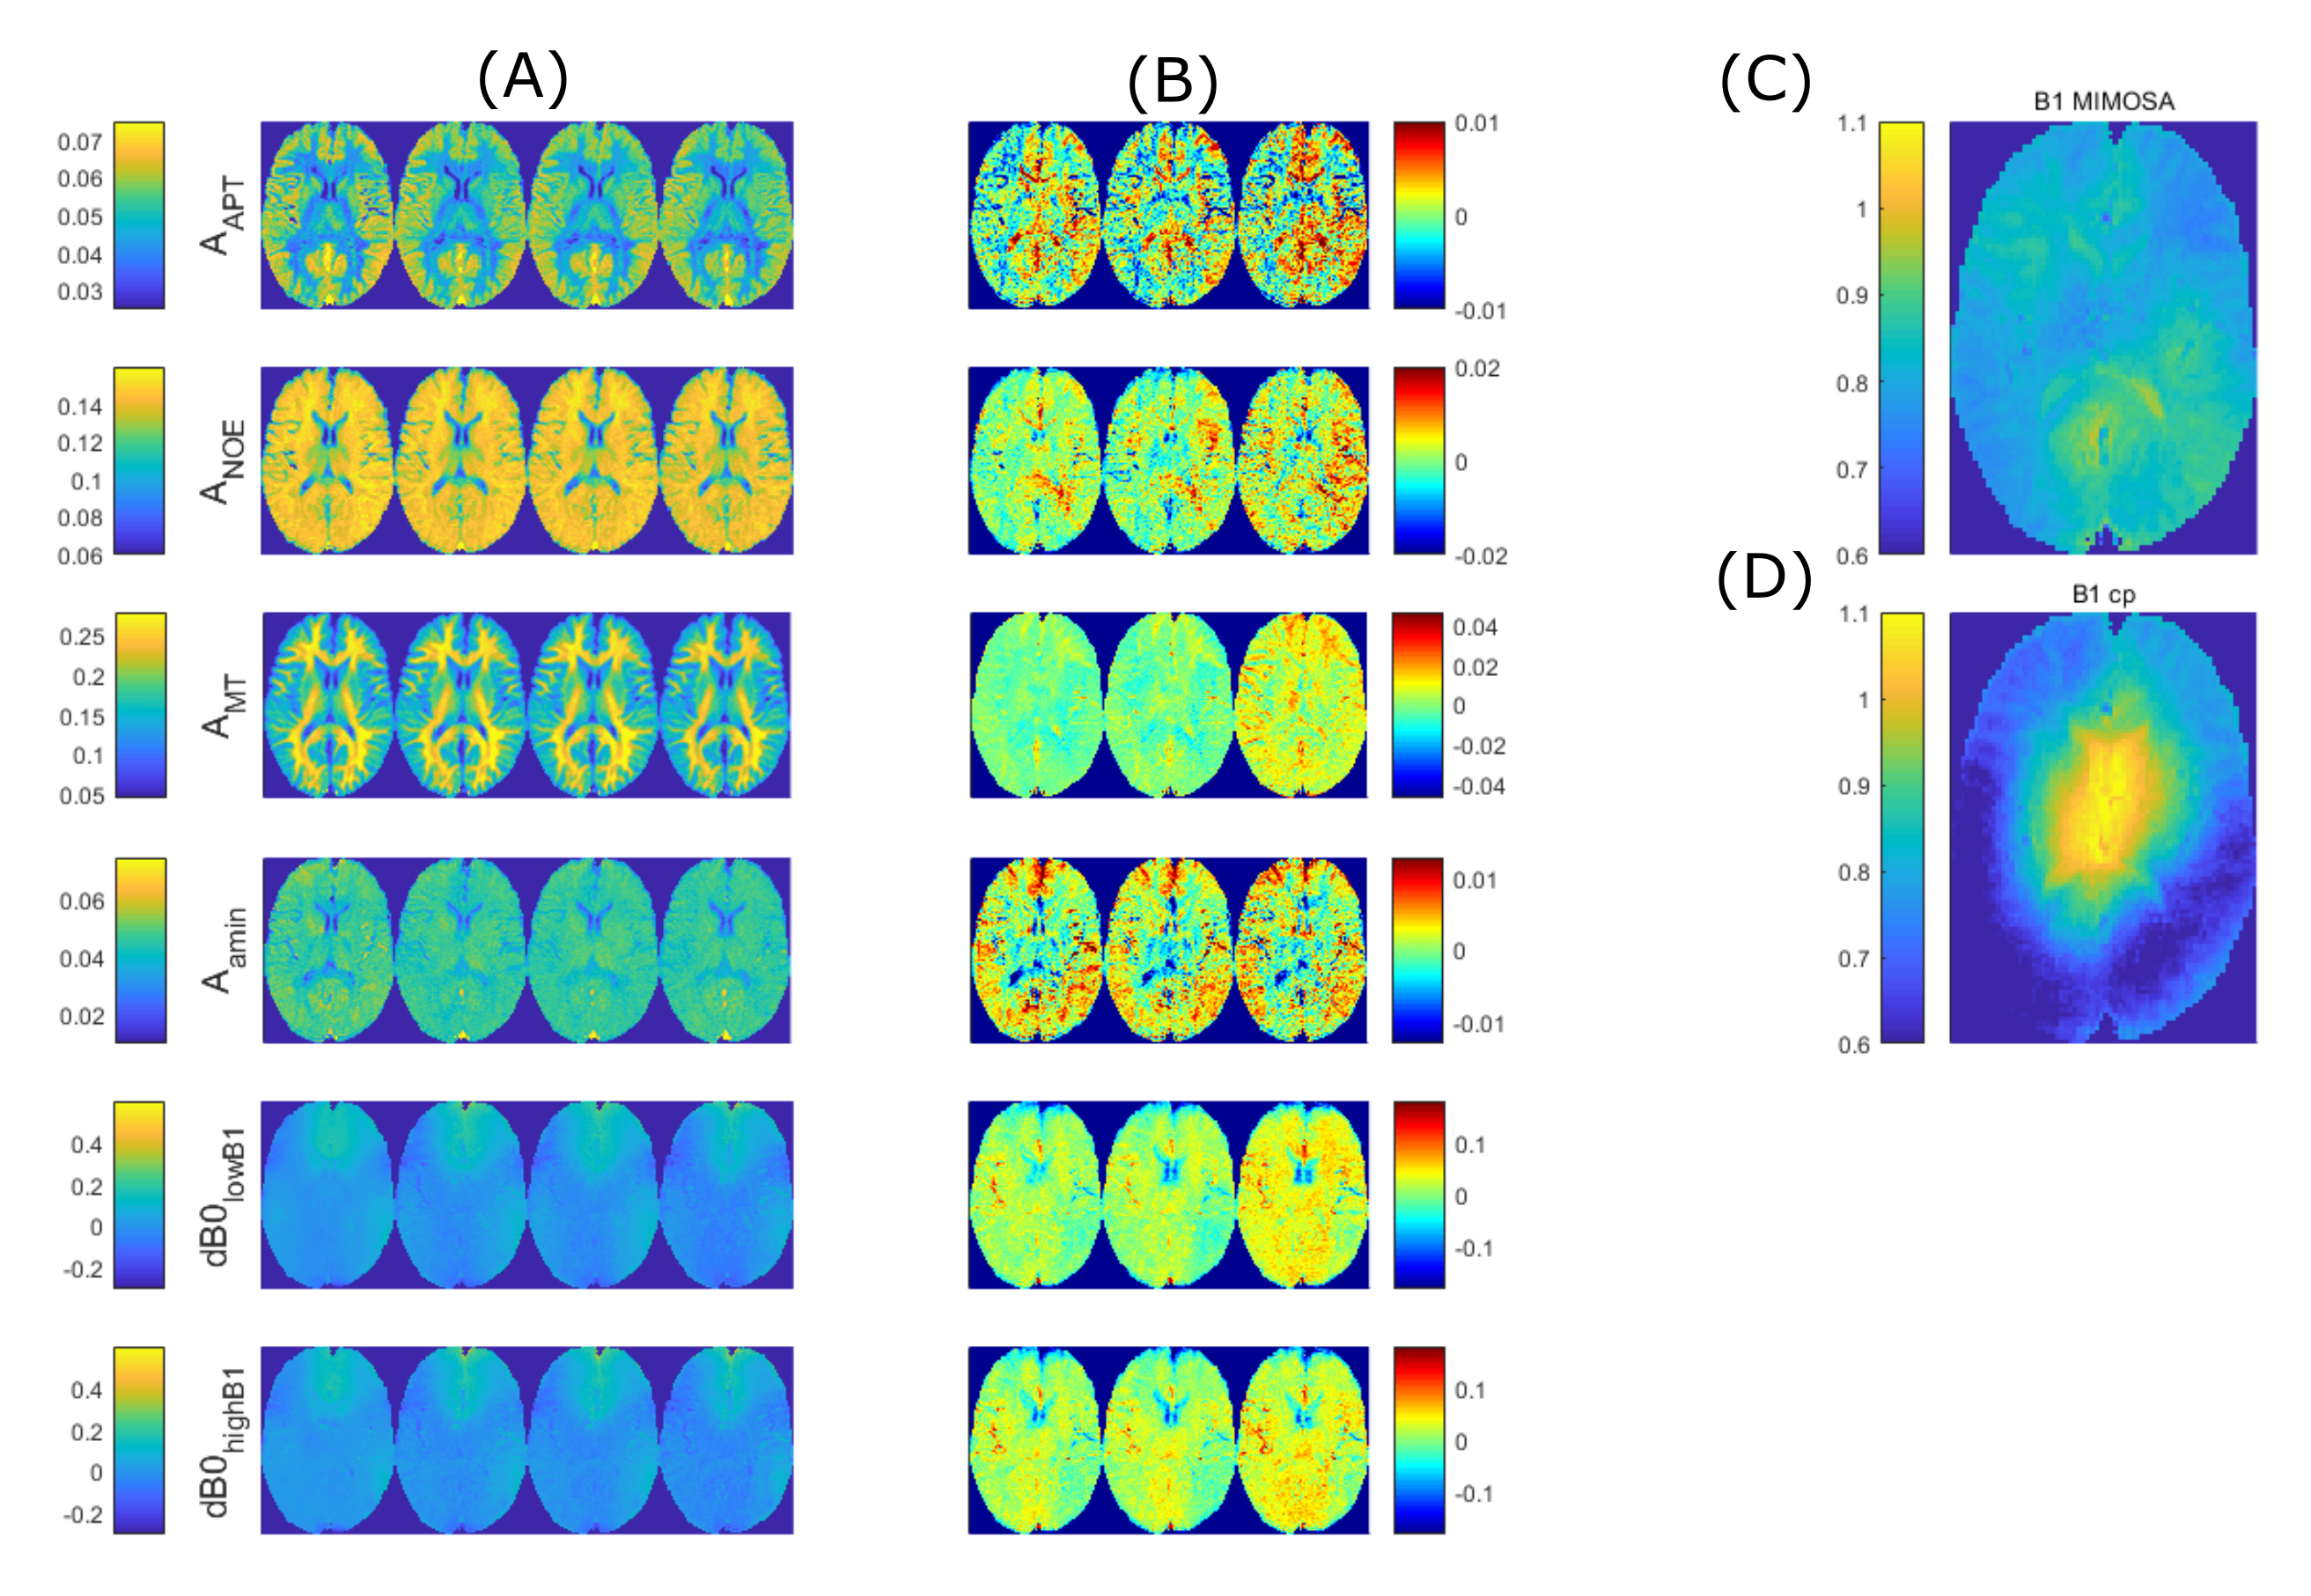
Average tissue ROI Z-spectra (Figure 1B) of a reduced and full measurement are shown in Figure 1A. Both spectra match each other closely, showing that there is little signal interaction between individual offsets.Data of 5 healthy subjects were used as training set to obtain $$$\hat{\mathbf{B}}_{rowLASSO}$$$. Figure 2 shows application of these coefficients to a sixth healthy subject dataset. The Lorentzian maps shown in Figure 2A are generated as described in 10. Reducing the linear prediction of an unreduced set to the rowLASSO subset, the comparison of retrospective and prospective subsampling yields a good agreement for APT, NOE, Amine and dB0. For MT amplitudes, a slightly decreased overall intensity is visible. Difference maps between all three linear predictions and the ground truth (Figure 2B) partially coincide with the B1-MIMOSA map (Figure 2C).
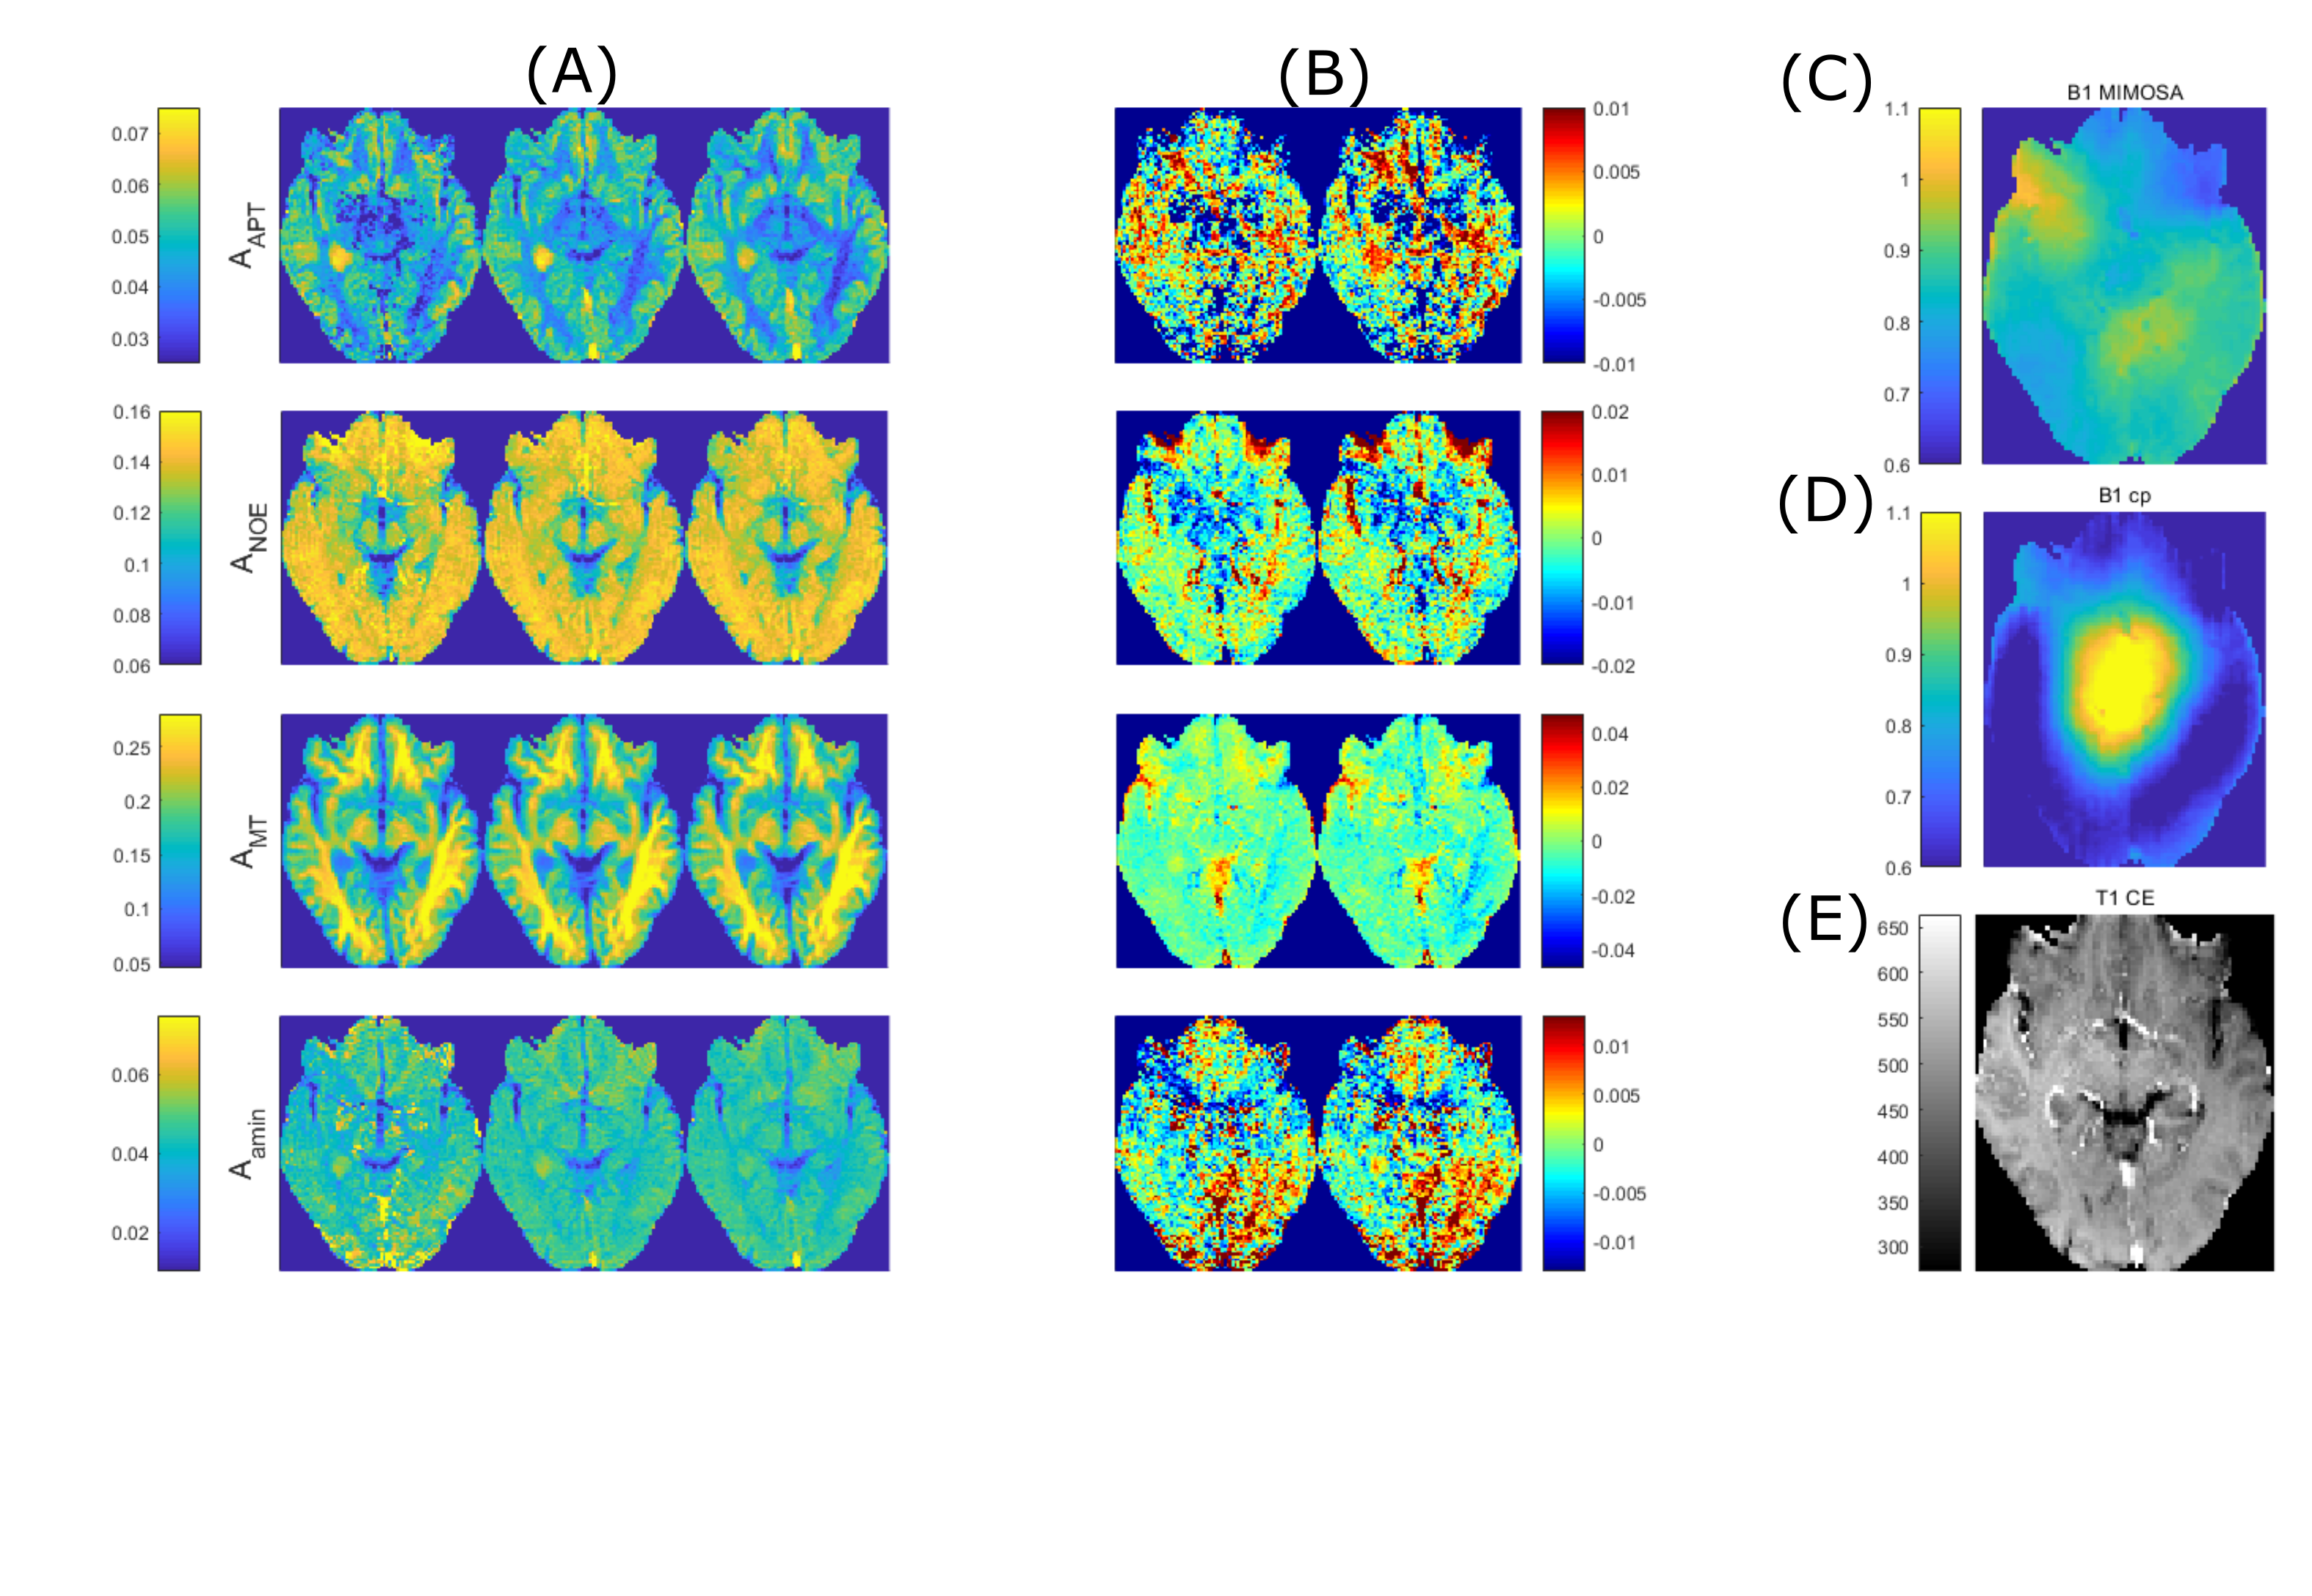
Figure 3 shows generalisation from healthy training data to the tumor patient dataset set. The APT hyperintensity in the tumor is still visible for linear projection from the retrospectively reduced subset, despite showing decreased intensity in this region (Figure 3B).
DISCUSSION
Sharing the advantages of the linear projection approach14, the LASSO regularization additionally optimizes for subsampling of frequency offsets. This sets it apart from k-space subsampling approaches for scan time acceleration, e.g. compressed sensing11.Tee et al.13 applied an approach to optimization of the sampling schedule for a fixed number of $$$N_{retained}$$$ concerning amine quantification. The proposed - completely data driven - LASSO approach compromises between parameter quantification and acquisition time, while being able to find subsets of arbitrary length $$$N_{retained}$$$. In comparison with deep neural networks12, the LASSO method shows a similar denoising property and - surprisingly - comparable performance, but remains an explainable approach for input feature selection and parameter prediction.
Reproducibility of linear predictions from full and reduced measurements is comparable with conventional Lorentz fitting10 (data not shown).
CONCLUSION
Prospective and retrospective reduction of CEST measurement offsets by the proposed LASSO method still allows reproducible and accurate linear prediction of Lorentzian parameter maps from uncorrected Z-spectra. An acceleration factor of ~2.8 was shown to be feasible in this work.Future combination of compressed sensing and LASSO subsampling can be expected to enable further scan time reduction.
Acknowledgements
No acknowledgement found.References
1. Liu D, Zhou J, Xue R, Zuo Z, An J, Wang DJJ. Quantitative characterization of nuclear overhauser enhancement and amide proton transfer effects in the human brain at 7 Tesla. Magnetic Resonance in Medicine 2013;70:1070–1081 doi: 10.1002/mrm.24560.
2. Zaiss M, Windschuh J, Paech D, et al. Relaxation-compensated CEST-MRI of the human brain at 7T: Unbiased insight into NOE and amide signal changes in human glioblastoma. NeuroImage 2015;112:180–188 doi: 10.1016/j.neuroimage.2015.02.040.
3. Goerke S, Soehngen Y, Deshmane A, et al. Relaxation-compensated APT and rNOE CEST-MRI of human brain tumors at 3 T. Magnetic Resonance in Medicine 2019 doi: 10.1002/mrm.27751.
4. Deshmane A, Zaiss M, Lindig T, et al. 3D gradient echo snapshot CEST MRI with low power saturation for human studies at 3T. Magnetic Resonance in Medicine 2019;81:2412–2423 doi: 10.1002/mrm.27569.
5. Liebert A, Zaiss M, Gumbrecht R, et al. Multiple interleaved mode saturation (MIMOSA) for B1+ inhomogeneity mitigation in chemical exchange saturation transfer. Magnetic Resonance in Medicine 2019;82:693–705 doi: 10.1002/mrm.27762.
6. Zaiss M, Ehses P, Scheffler K. Snapshot-CEST: Optimizing spiral-centric-reordered gradient echo acquisition for fast and robust 3D CEST MRI at 9.4 T. NMR in Biomedicine 2018;31:e3879 doi: 10.1002/nbm.3879.
7. Griswold, Mark A., et al. "Generalized autocalibrating partially parallel acquisitions (GRAPPA)." Magnetic Resonance in Medicine: An Official Journal of the International Society for Magnetic Resonance in Medicine 47.6 (2002): 1202-1210.
8. Beck A, Teboulle M. A Fast Iterative Shrinkage-Thresholding Algorithm for Linear Inverse Problems. SIAM J. Imaging Sci. 2009;2:183–202 doi: 10.1137/080716542.
9. Obozinski G, Wainwright MJ, Jordan MI. Support union recovery in high-dimensional multivariate regression. Ann. Statist. 2011;39:1–47 doi: 10.1214/09-AOS776.
10. Khakzar, Katrin et al., 7 tricks for 7T CEST – improving reproducibility of multi-pool evaluation, In: 8th International Workshop on Chemical Exchange Saturation Transfer Imaging; 2020
11. M. Lustig, D. L. Donoho, J. M. Santos and J. M. Pauly, Compressed Sensing MRI, in IEEE Signal Processing Magazine, vol. 25, no. 2, pp. 72-82, March 2008, doi: 10.1109/MSP.2007.914728.
12. Glang F, Deshmane A, Prokudin S, et al. DeepCEST 3T: Robust MRI parameter determination and uncertainty quantification with neural networks—application to CEST imaging of the human brain at 3T. Magnetic Resonance in Medicine 2020;84:450–466 doi: 10.1002/mrm.28117.
13. Tee YK, Khrapitchev AA, Sibson NR, Payne SJ, Chappell MA. Optimal sampling schedule for chemical exchange saturation transfer. Magnetic Resonance in Medicine 2013;70:1251–1262 doi: 10.1002/mrm.24567.
14. Glang, Felix et al., Linear projection-based CEST reconstruction, submitted to the ISMRM&SMRT conference 2021
Figures