1451
DeepCEST: 7T Chemical exchange saturation transfer MRI contrast inferred from 3T data via deep learning with uncertainty quantification1Department of Neuroradiology, University Hospital Erlangen, Friedrich-Alexander-Universität Erlangen-Nürnberg (FAU), Erlangen, Germany, 2High-field Magnetic Resonance Center, Max Planck Institute for Biological Cybernetics, Tübingen, Germany, 3Pattern Recognition Lab, Friedrich-Alexander-University Erlangen-Nürnberg, Erlangen, Germany, 4Institute of Radiology, University Hospital Erlangen, Friedrich-Alexander-Universität Erlangen-Nürnberg (FAU), Erlangen, Germany
Synopsis
The deepCEST approach enables to perform CEST experiments at a lower magnetic field strength and predict the contrasts of a higher field strength. This is possible through the application of a neural network, which was trained with low and high B1 Z-spectra acquired at 3T as input data, and as target data 5-pool-Lorentzian fitted amplitudes obtained from 7T spectra were used. The network included an uncertainty quantification to verify the reliability of the predicted images.
Introduction
A neural networt architecture could be found to predict 9.4T CEST contrasts from 3T chemical exchange saturation transfer (CEST) data and has been presented by 1 as deepCEST. In the following, a version of this approach to predict 7T contrasts from 3T CEST data, including an uncertainty quantification 2 and B1 correction will be presented.Methods
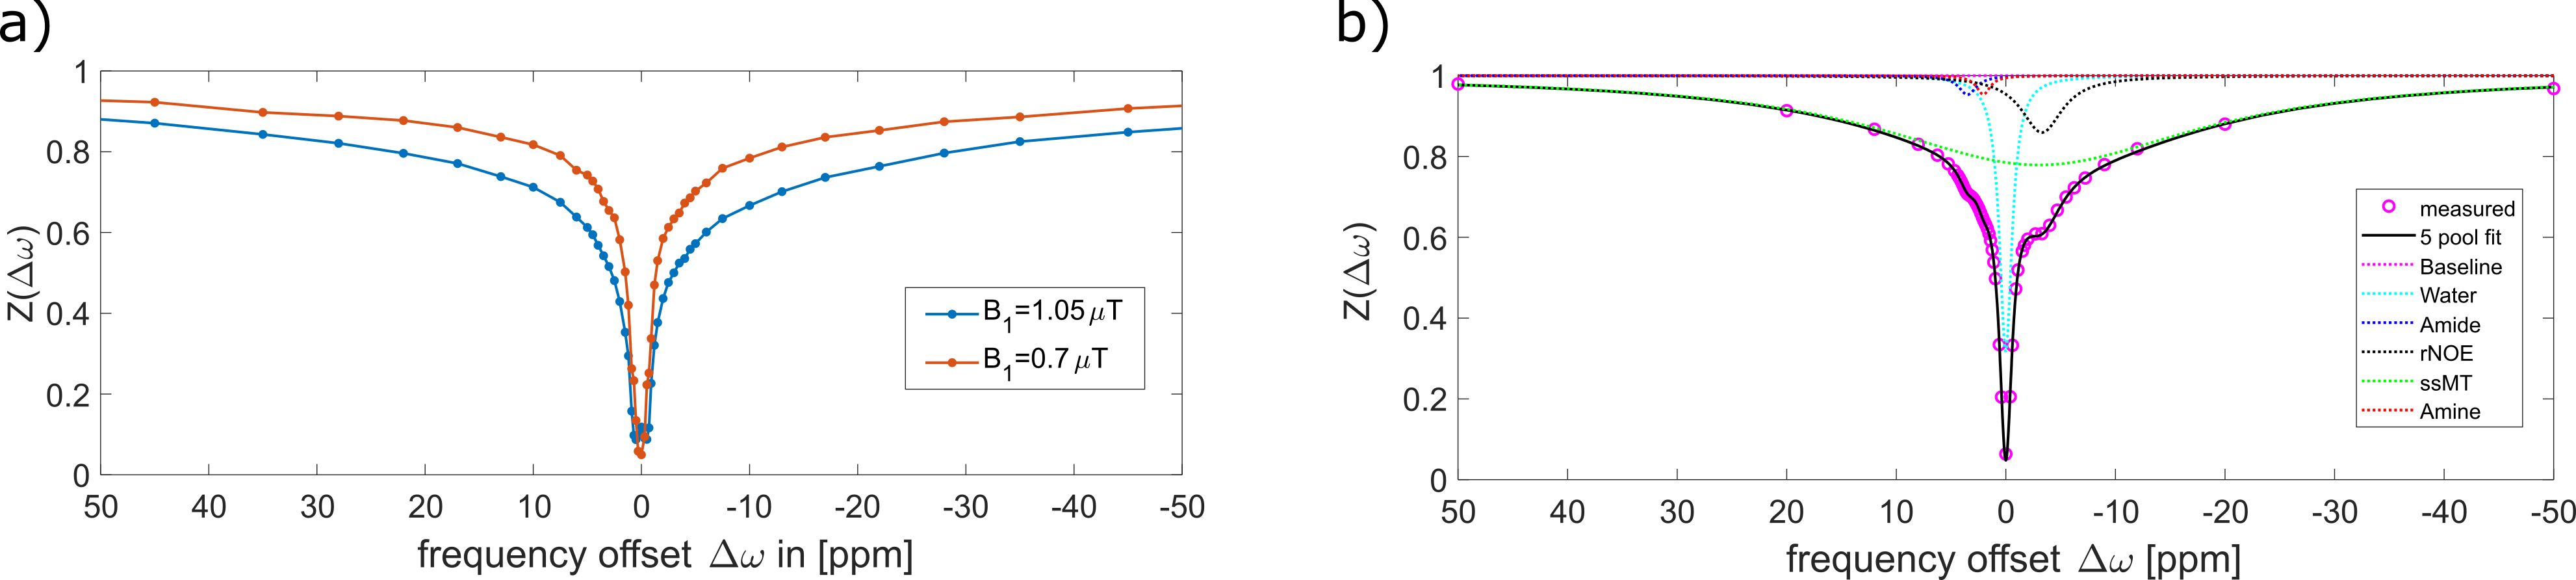
All measurements were performed after written informed consent. The 3T raw data was acquired at a Siemens MAGNETOM Trio scanner. Pre-saturation (n=110, tp=20 ms, DC=57%) at two B1 levels (0.7 µT, 1.05 µT) and 57 frequency offsets distributed non-equidistantly between -250 ppm and 250 ppm, finer between -10 and 10 ppm was followed by a readout with a centric 3D snapshot GRE 3. The 7T raw data was acquired by applying homogeneous MIMOSA pre-saturation as in 4 (n=120, tp=15 ms, td=10 ms, DC=60.56%), at two B1 levels (0.72 µT, 1.00 µT) and 54 frequency offsets distributed non-equidistantly between -100 and 100 ppm, finer between -5 and 5 ppm followed by a centric 3D snapshot GRE readout 3 at a Siemens MAGNETOM 7T scanner. The training data at both field strengths was taken from the same 6 healthy subjects. Input data were normalized but uncorrected augmented 3T Z-spectra of two B1 levels and the corresponding B1 map, the augmentation was on the one hand side a B0 shift and on the other hand side Gaussian noise was applied. These were mapped voxel-wise on target data consisting of Lorentzian amplitudes conventionally generated by 5-pool-Lorentzian fitting performed on normalized, denoised, B0- and B1-corrected Z-spectra 5. Before the voxel-wise training, it was crucial to register the input to the target data using SPM and adapt the resolution by reslicing to the target data resolution. The network was trained with an ELU activation function, with 115 input features, including all offsets and the B1 map using a fully connected network with 5 hidden layers.Results
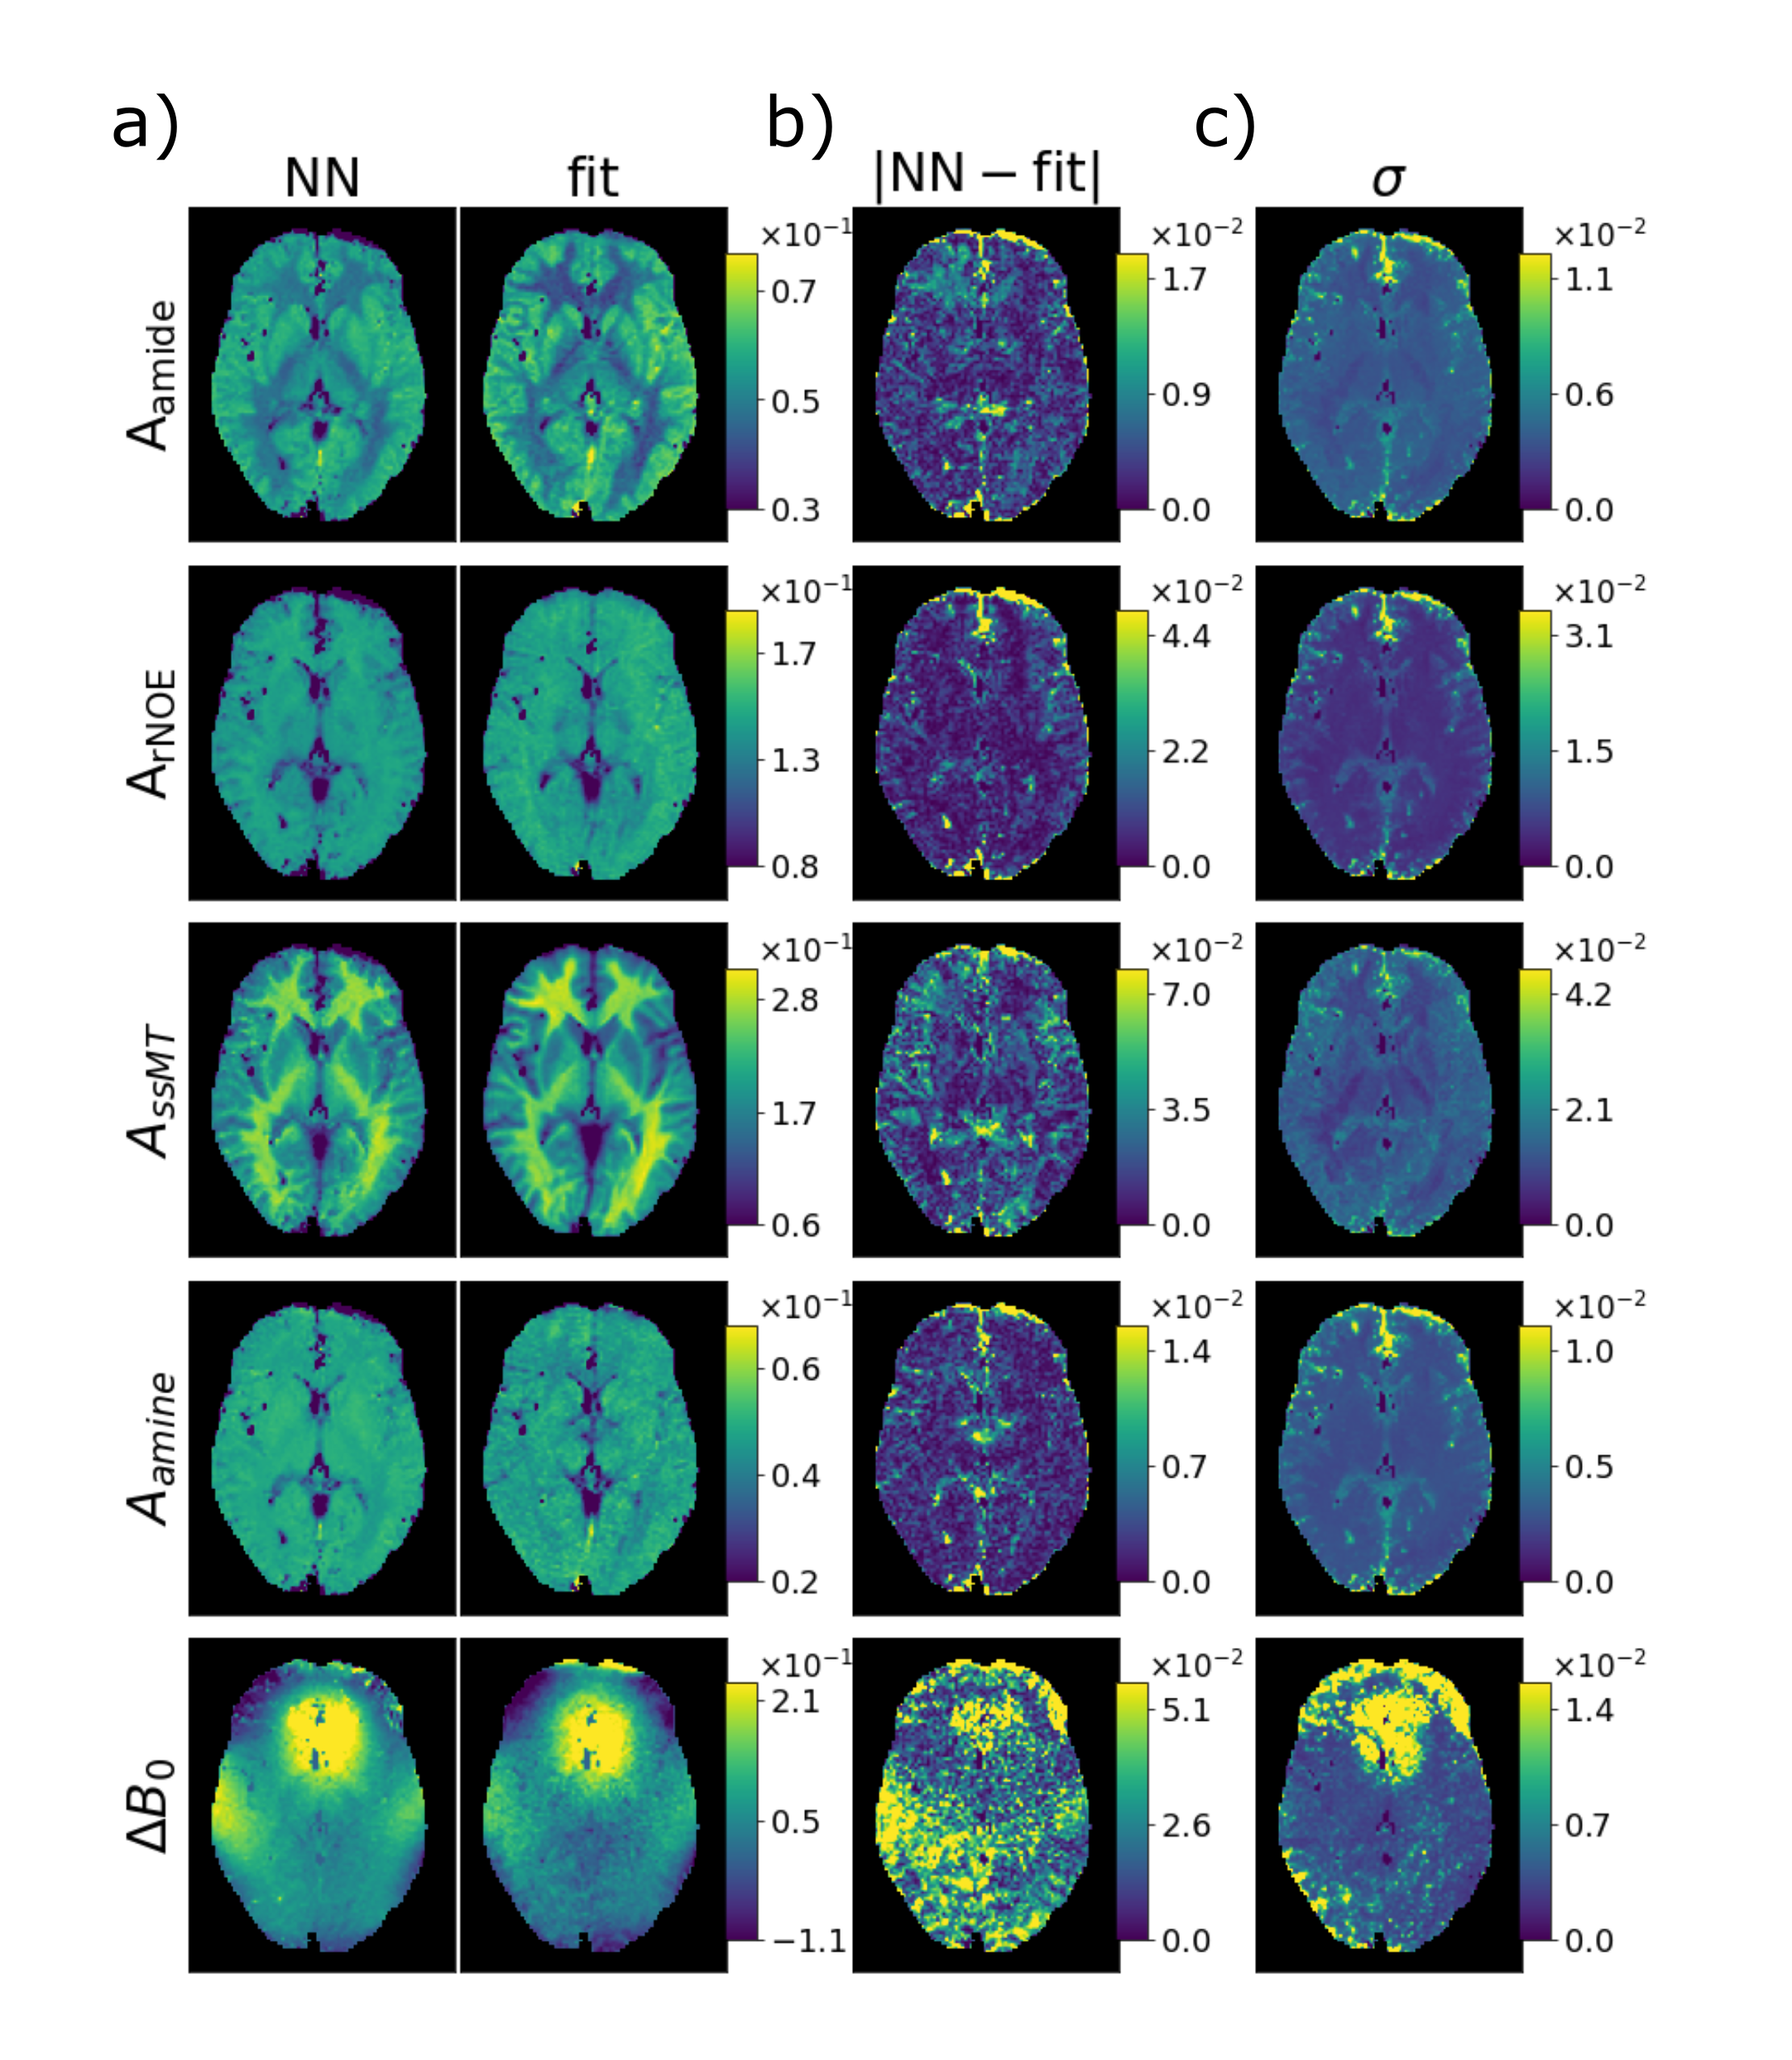
Figure 2 shows that it is possible with the deepCEST approach to map from 3T to 7T and to shortcut a complete evaluation of the CEST data including denoising, B1 and B0 correction. By comparing the contrasts of the Lorentzian fit model from the 7T data and the contrasts of the 3T data prediction from the network in figure 2 a) and with taking in account the uncertainty quantification, one can see that the prediction of the network closely match the result of the Lorentzian fit. The deepCEST uncertainty quantification allows a confident interpretation of the CEST maps. Increased uncertainties were detected around vessels and above the nasal cavity, where B0 inhomogeneities are largest.Discussion
The deepCEST approach was already shown for 9.4T predictions from 3T data1. The clear benefit of 7T target data is that 7T scanners are more common than 9.4T scanners, thus it is easier to acquire target data, but also to validate predictions of e.g. tumor patients. We were able to show this approach for mapping 3T to 7T, with an additional uncertainty quantification for the predictions, previously shown for pure 3T data 2. In contrast to previous approaches, we took normalized Z-spectra of two power levels instead of one as input data, and with that we were able to shortcut both B0 and B1 correction, leading to homogeneous CEST contrast.Conclusion
7T CEST features can be inferred accurately from 3T CEST data. An additional uncertainty quantification gives a measure for the quality and interpretability of these predictions.Acknowledgements
No acknowledgement found.References
1. Zaiss, Moritz, et al. "DeepCEST: 9.4 T Chemical exchange saturation transfer MRI contrast predicted from 3 T data–a proof of concept study." Magnetic resonance in medicine 81.6 (2019): 3901-3914.
2. Glang, Felix, et al. "DeepCEST 3T: Robust MRI parameter determination and uncertainty quantification with neural networks—application to CEST imaging of the human brain at 3T." Magnetic Resonance in Medicine 84.1 (2020): 450-466.
3. Zaiss, Moritz, Philipp Ehses, and Klaus Scheffler. "Snapshot‐CEST: optimizing spiral‐centric‐reordered gradient echo acquisition for fast and robust 3D CEST MRI at 9.4 T." NMR in Biomedicine 31.4 (2018): e3879.
4. Liebert, Andrzej, et al. "Multiple interleaved mode saturation (MIMOSA) for B1+ inhomogeneity mitigation in chemical exchange saturation transfer." Magnetic resonance in medicine 82.2 (2019): 693-705.
5. Breitling, Johannes, et al. "Adaptive denoising for chemical exchange saturation transfer MR imaging." NMR in Biomedicine 32.11 (2019): e4133.
Figures