1446
Lactate concentration in breast cancer using advanced magnetic resonance spectroscopy1Institute of Medical Sciences, University of Aberdeen, Aberdeen, United Kingdom, 2Pathology Department, Aberdeen Royal Infirmary, Aberdeen, United Kingdom, 3School of Medicine, University of Aberdeen, Aberdeen, United Kingdom, 4Breast Unit, Aberdeen Royal Infirmary, Aberdeen, United Kingdom, 5Strathclyde Institute of Pharmacy and Biological Sciences, University of Strathclyde, Glasgow, United Kingdom
Synopsis
Upregulation of aerobic glycolysis and an elevated lactate accumulation have been linked to tumour aggressiveness. However, current evidence drawn from cell culture and small animal models remains controversial. Since lactate and lipid share the same spectral frequency, conventional MRS is inadequate in quantification of lactate under overwhelming lipid signal. Double quantum filtered (DQF) MRS allows excellent suppression of lipid signal from adipose breast tissues. We conducted a cross sectional study to examine the prognostic role of lactate concentration in grade II and III whole breast tumours using DQF MRS for the quantification of lactate concentration.
Introduction
Aerobic glycolysis, a central feature of tumour metabolism, fuels rapid growth with elevated glucose consumption and subsequent lactate production. An elevation of lactate has been suggested to induce increased proliferative activity and in turn poor prognosis1. A higher concentration of lactate (> 9 mmol/L) has been found in metastatic orthotopically implanted mammary tumours in mice2,3, however opposite results were also observed with hyperpolarised 13C-pyruvate MRS4. Current controversy might arise from a predominant reliance on cell and animal models and a lack of patient studies. Since lactate and lipid share the same spectral frequency, conventional MRS is inadequate in quantification of lactate in breast tissues. Double quantum filtered (DQF) MRS shows excellent suppression of lipid signal5. We hypothesised that there is a difference in lactate concentration between high and low grade human breast cancer, and we applied DQF MRS in whole tumours freshly excised from patients with breast cancer.Methods
Thirty female patients (age 39 – 78 years, 15 grade II and 15 grade III) with invasive ductal carcinoma participated in the study. The study was approved by the North West – Greater Manchester East Research Ethics Committee (REC Ref: 16/NW/0032), and written informed consent was obtained from all the patients. Only patients undergoing breast surgery, with a tumour size larger than 1 cm on ultrasound were eligible. After tumour excision, the fresh specimen was immediately transported to the imaging centre for MRS scan. Once the scan was completed, the fresh specimen was transported to Pathology Department for formalin treatment and histopathological analysis, including tumour size, lactate dehydrogenase A (LDH-A)6,7, Ki-678 and Nottingham Prognostic Index (NPI) (Figure 1).MRS Acquisition
All data were acquired on a 3 T whole body clinical MRI scanner (Achieva TX, Philips Healthcare, Best, Netherlands) using a body coil for uniform transmission and a 32-channel receiver coil for high sensitivity detection. Standard T1-weighted anatomical images were acquired with an isotropic voxel size of 1 mm, repetition time (TR) of 5.2 ms, echo time (TE) of 2.7 ms, imaging volume encompassing the whole specimen. Lactate spectrum was acquired from a single voxel snug-fit to the tumour using DQF PRESS sequence5, with TR/TE of 1.25 s/144 ms, spectral editing frequency at 4.1 ppm and 512 averages. The reference spectrum was acquired from the same voxel using single voxel PRESS sequence with TR/TE of 1.25 s/144 ms, 16 averages.
Data Processing
All spectral data were pre-processed following standard procedures9 and quantified using AMARES algorithm10 in the jMRUI software11. Lactate and water signal peak amplitudes, with corresponding chemical shifts at 1.3 ppm and 4.7 ppm, were quantified from lactate and reference spectra respectively. Lactate concentration was then computed from lactate and water amplitudes, accounting for literature breast tissue biochemical composition12 and relaxation properties13.
Statistical Analysis
Statistical analysis was performed in SPSS software (Release 23.0, SPSS Inc., Chicago, IL, USA). Two-tailed independent sample t-tests were carried out on patient characteristics and lactate concentration to assess group difference between grades, and Mann Whitney U tests for non-normally distributed LDH-A, Ki-67 and NPI. Correlation analysis was conducted to determine the association between lactate concentration against LDH-A, Ki-67, NPI and tumour size. A p value < 0.05 was considered statistically significant.
Results
The patient characteristics of the two groups are shown in Table 1. There was a significantly higher lactate concentration (p = 0.0349, Table 2, Figure 2a) in grade III (7.7 ± 2.9 mM) than in grade II (5.5 ± 2.4 mM) breast tumours. NPI was significantly higher (p = 0.0001, Table 1, Figure 2b) in grade III (median: 4.50, interquartile range (IQR): 4.44 – 5.02) than in grade II (3.62, 3.46 – 4.29). There was a significantly higher Ki-67 expression (p = 0.0002, Table 2, Figure 2c) in grade III (22.9%, 16.7-40.2%) than in grade II (9.7%, 6.3-16.4%). There was a significantly higher LDH-A expression (p = 0.0061, Table 2, Figure 2d) in grade II (300, 250 – 300) than in grade III (100, 80 – 250).There was a significant correlation between lactate concentration and NPI (r = 0.3618, p = 0.0495, Table 2, Figure 3a). There were no significant correlations between lactate concentration against Ki-67 expression (p = 0.1023, Table 2, Figure 3b) or tumour size (p = 0.3645, Figure 3c). There was a significant negative correlation between lactate concentration and LDH-A (r = -0.3734, p = 0.0421, Table 2, Figure 3d).
Discussion
We found lactate concentration was significantly higher in grade III breast tumours compared to grade II, confirming aerobic glycolysis in human breast cancer. Lactate concentration was correlated with NPI, indicating the potential value of lactate in patient prognosis. Lactate concentration was independent of proliferative marker Ki-67 and tumour size, indicating that lactate concentration is a sensitive biomarker specific to the underlying tumour metabolism. Lactate concentration was negatively correlated with LDH-A, potentially due to feedback inhibition14 and depletion of pyruvate and nicotinamide adenine dinucleotide hydrogen15 in higher grade tumour.Conclusion
Lactate concentration from DQF MRS is a non-invasive marker sensitive to breast tumour grade and is associated with NPI with significant prognostic value. This paves the way for potential clinical assessment of tumour aggressiveness and monitoring of disease progression and treatment effectiveness.Acknowledgements
The authors would like to thank Dr Nicholas Senn for conducting data auditing, Dr Matthew Clemence for clinical scientist support, Dr Tim Smith for biologist support, Ms Bolanle Brikinns for patient recruitment support, Ms Dawn Younie for logistic support, Prof Andrew M Blamire for advice on MRS. This project was funded by Friends of Aberdeen and North Centre for Haematology, Oncology and Radiotherapy (ANCHOR), and Sai Man Cheung’s PhD study was jointly supported by Elphinstone scholarship, Roland Sutton Academic Trust and John Mallard scholarship.References
1. Doherty JR, Cleveland JL. Targeting lactate metabolism for cancer therapeutics. J Clin Invest. 2013; 123(9): 3685–3692.
2. Serganova I, Rizwan A, Ni X, et al. Metabolic Imaging: A Link between Lactate Dehydrogenase A, Lactate, and Tumor Phenotype. Clin Cancer Res. 2011; 17(19): 6250–6261.
3. Rizwan, A, Serganova, I, Khanin, R, et al. Relationships between LDH-A, lactate, and metastases in 4T1 breast tumors. Clin Cancer Res. 2013; 19(18): 5158 – 5169.
4. Xu HN, Kadlececk S, Profka H, et al. Is higher lactate an indicator of tumor metastatic risk? A pilot MRS study using hyperpolarized 13C-Pyruvate. Acad Radiol. 2014; 21(2): 223–231.
5. He, Q, Shungu, DC, van Zijl, PCM, et al. Single-scan in vivo lactate editing with complete lipid and water suppression by selective multiple-quantum-coherence transfer (Sel-MQC) with application to tumors. J Magn Reson, Series B. 1995; 106(3): 203 – 211.
6. Dong, T, et al. Tumor LDH-A expression and serum LDH status are two metabolic predictors for triple negative breast cancer brain metastasis. Sci Rep. (2017); 7: 6069.
7. McClelland, RA, et al. Automated Quantitation of Immunocytochemically Localized Estrogen Receptors in Human Breast Cancer. Cancer Research. (1990); 50: 3545–3550.
8. Tuominen, VJ, Ruotoistenmäki, S, Viitanen, A, Jumppanen, M & Isola, J. ImmunoRatio: a publicly available web application for quantitative image analysis of estrogen receptor (ER), progesterone receptor (PR), and Ki-67. Breast Cancer Res. (2010); 12: R56.
9. Baik H-M, Su M-Y, Yu H, Nalcioglu O, Mehta R. Quantification of Choline-containing Compounds in Malignant Breast Tumors by 1H MR Spectroscopy Using Water as an Internal Reference at 1.5 T. MAGMA. 2006;19(2):96-104.
10. Vanhamme L, van den Boogaart A. Improved method for accurate and efficient quantification of MRS data with use of prior knowledge. J Magn Reson. 1997; 129(1): 35–43.
11. Naressi A, Couturier C, Castang I, et al. Java-based graphical user interface for MRUI, a software package for quantitation of in vivo/medical magnetic resonance spectroscopy signals. Comput Biol Med. 2001; 31(4): 269–286.
12. Sijens, PE, Dorrius, MD, Kappert, P, et al. Quantitative multivoxel proton chemical shift imaging of the breast. Magn Reson Imag. 2010; 28(3): 314 – 319.
13. Annarao, S, Thomas, K, Pillarsetty, N, et al. In vivo lactate T1 and T2 relaxation measurements in ER-positive breast tumours using SS-SelMQC editing sequence. Proceedings of the 19th Annual International Society of Magnetic Resonance in Medicine (ISMRM), Montréal, Québec. 2011; p.3158.
14. Valvona, CJ, Fillmore, HL, Nunn, PB, Pilkington, GJ. The regulation and function of lactate dehydrogenase A: Therapeutic potential in brain tumour. Brain Pathology. (2016); 26(1): 3–17.
15. Spriet, LL, Howlett, RA, Heigenhauser, GJF. An enzymatic approach to lactate production in human skeletal muscle during exercise. Med Sci Sports Exerc. (2000); 32(4): 756 – 763.
Figures
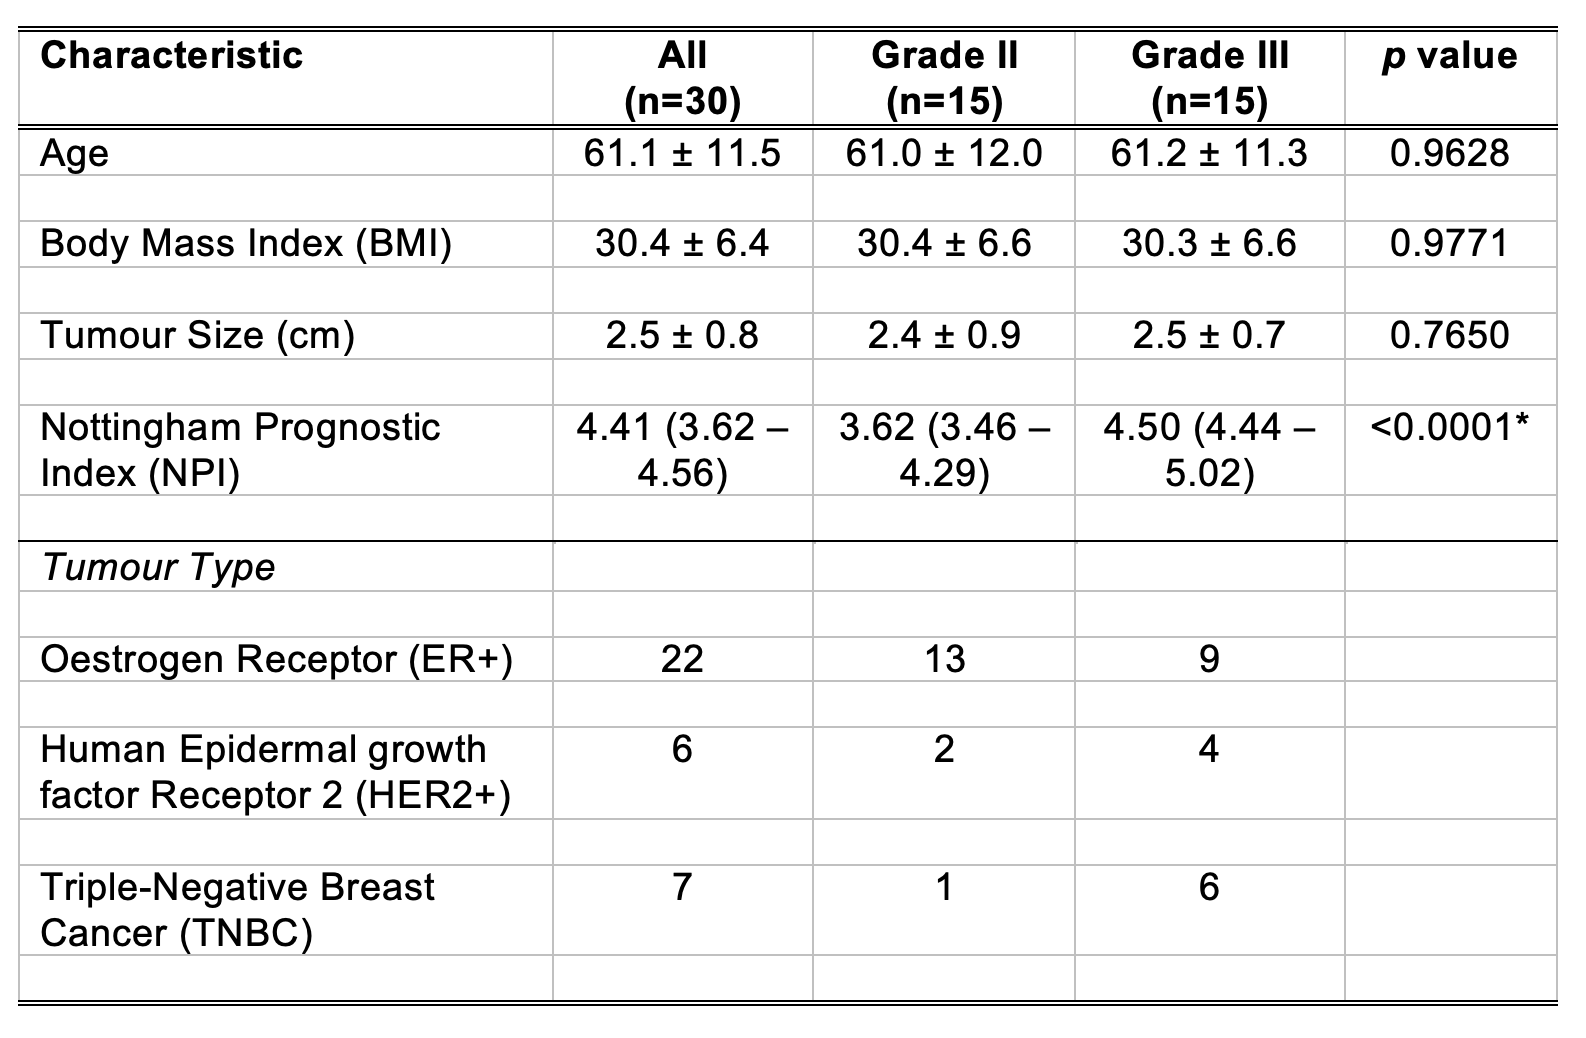
Table 1. Patient demography.
Clinical and histopathological findings of excised breast tumours are shown for each group and the entire cohort. Quantitative data were expressed as mean and standard deviation (apart from Nottingham Prognostic Index where median and interquartile range are shown), while qualitative data expressed as number of positive cases. Statistically significant differences (p < 0.05) are marked by ‘*’.
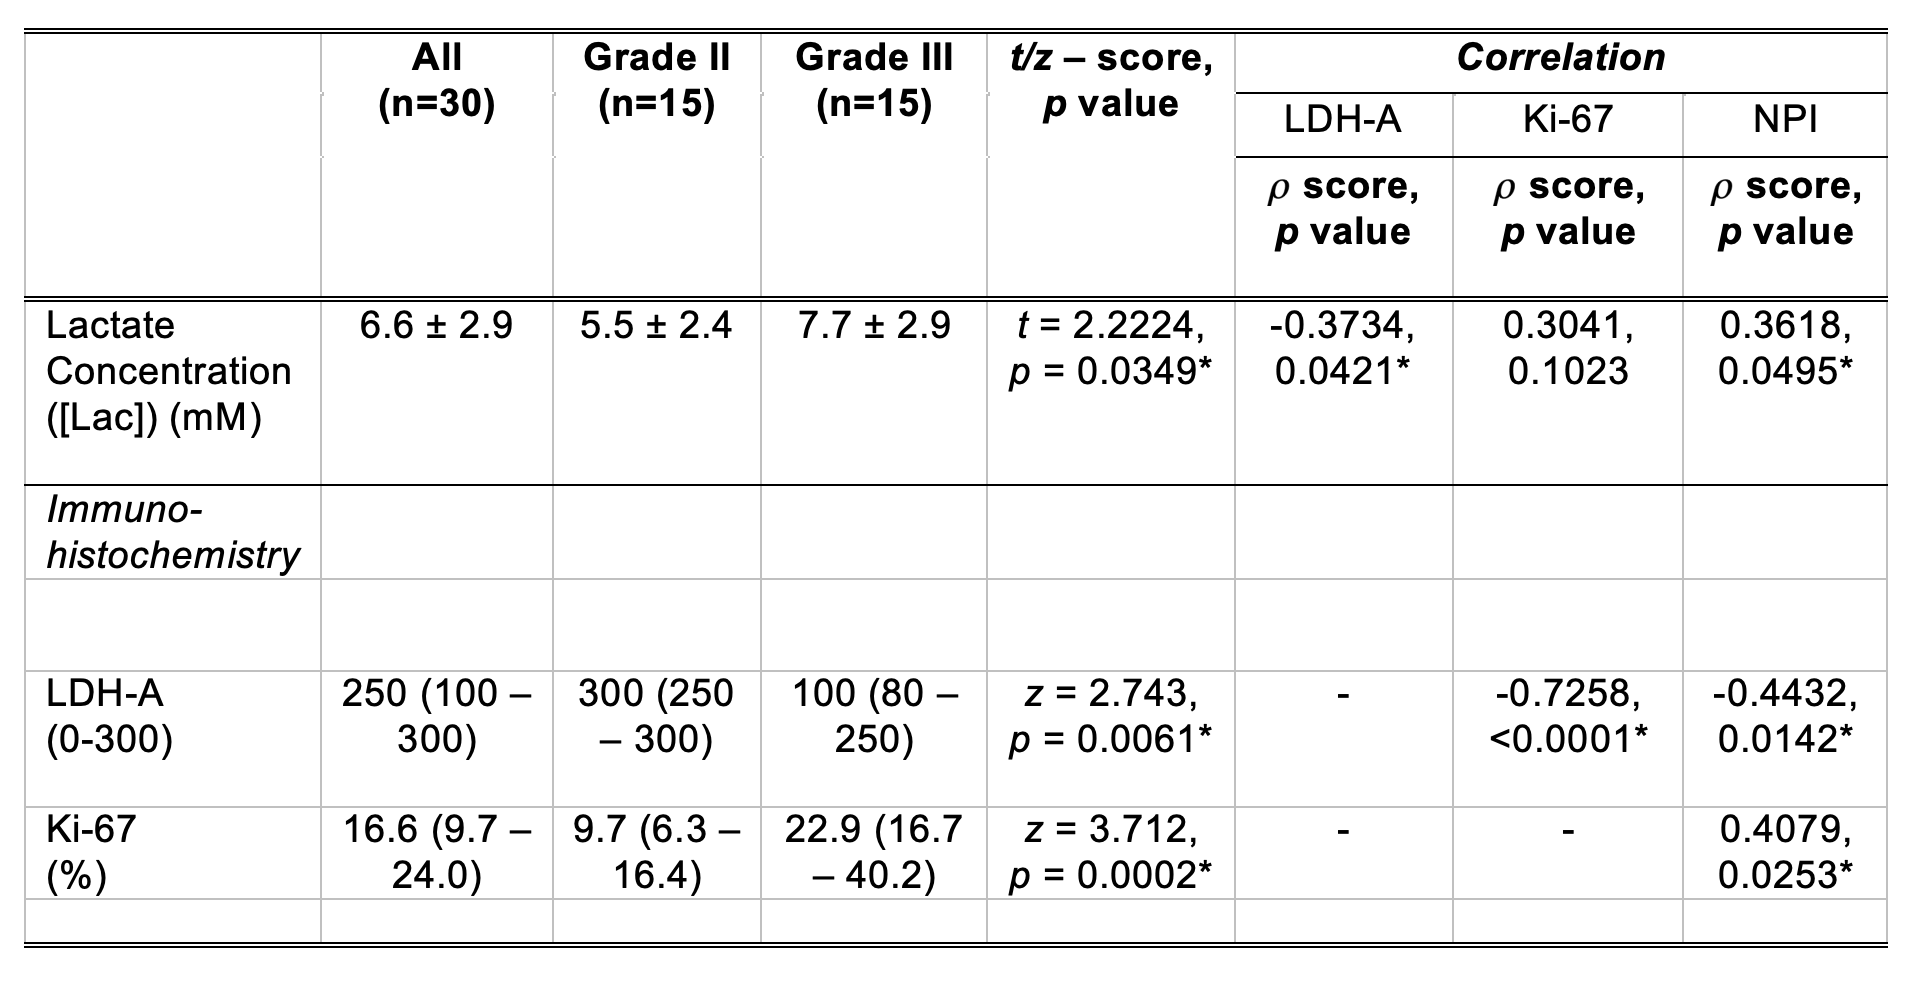
Table 2. Lactate concentration, histological markers and Nottingham Prognostic Index (NPI).
Lactate concentration, lactate dehydrogenase A (LDH-A) expression and proliferative marker Ki-67 expression are shown for groups and the entire cohort. The Spearman’s rank correlation (rho (ρ) scores) of lactate concentration against LDH-A, Ki-67 and NPI are also shown. There was a significant higher lactate concentration in grade III breast tumour compared to grade II. Lactate concentration was correlated with NPI. Statistically significant findings (p < 0.05) are marked by ‘*’.
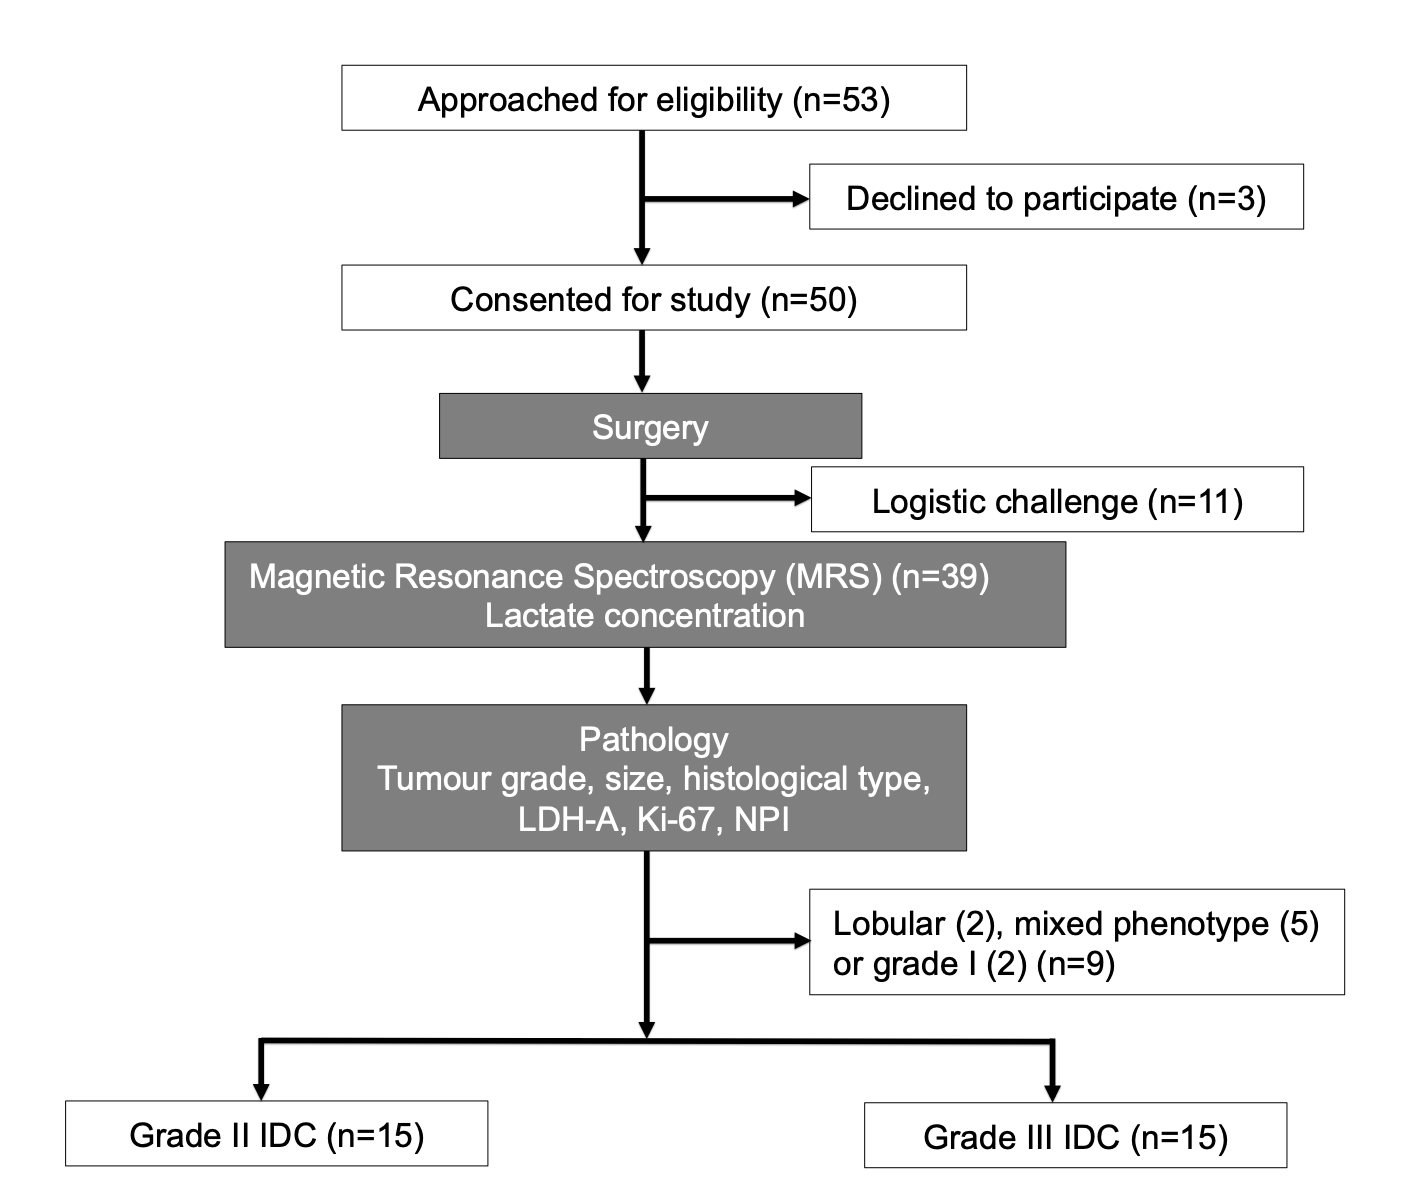
Figure 1. Study design.
A two-group cross sectional study in a flow chart. After surgery, the freshly excised breast tumours were scanned on a 3 T clinical MRI scanner. Lactate spectra were acquired from the whole tumour using double quantum filtered (DQF) MRS and subsequently lactate concentration was computed. Histopathological analysis was conducted to obtain tumour grade, size, lactate dehydrogenase A, proliferative marker Ki-67 and Nottingham Prognostic Index (NPI). Thirty patients with invasive ductal carcinoma (IDC) (15 grade II and 15 grade III) participated in the study.
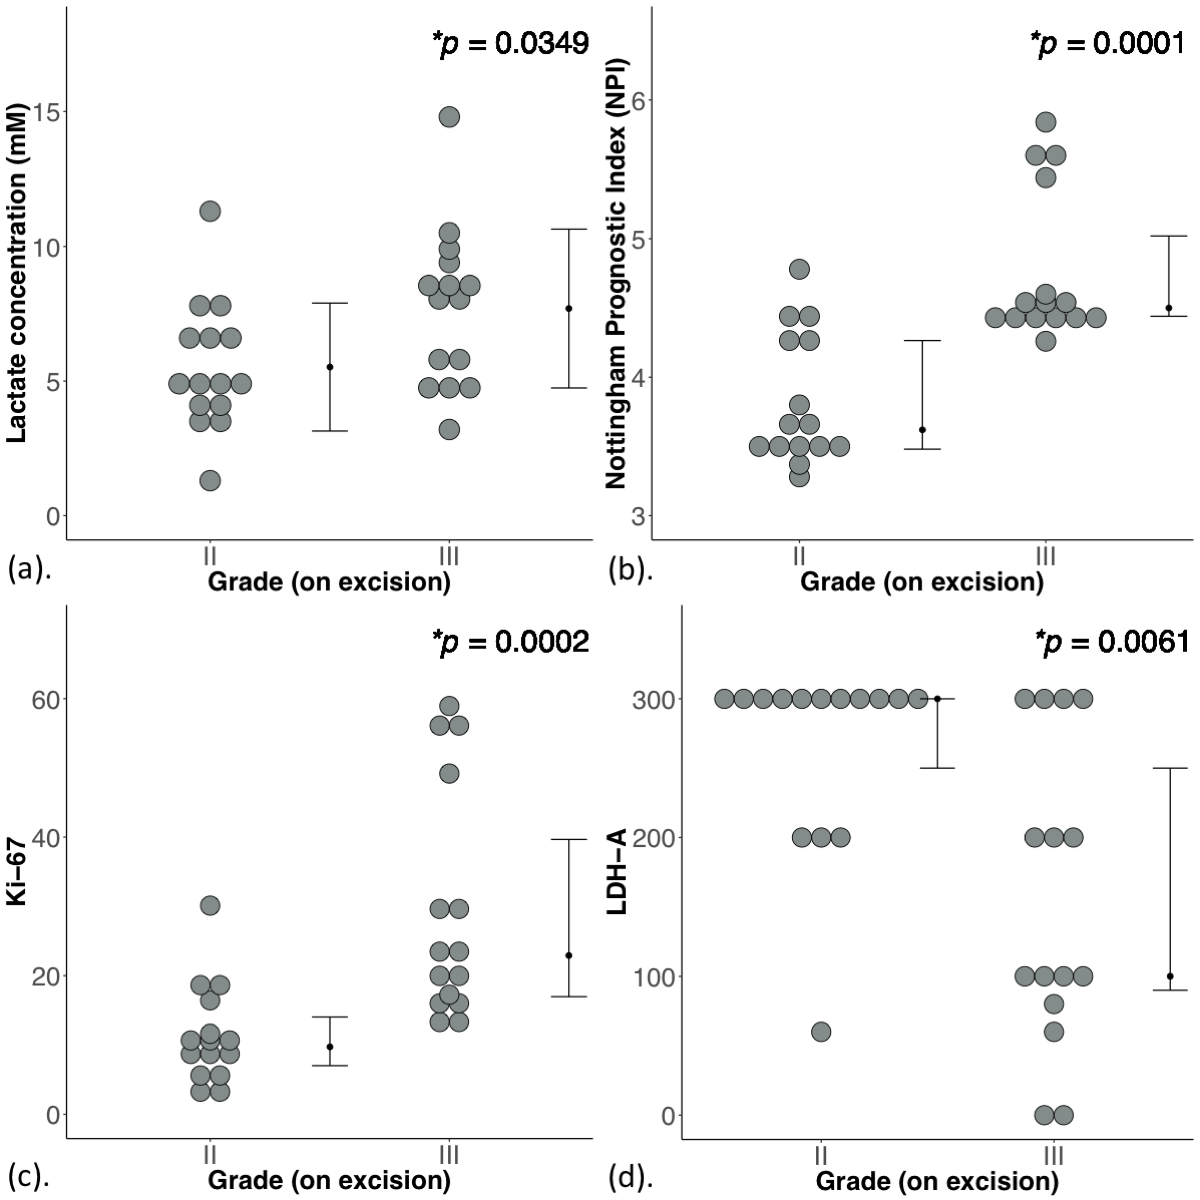
Figure 2. Lactate concentration, NPI and histological markers in grade II and III breast tumours.
The difference in (a) lactate concentration, (b) NPI, (c) Ki-67 and (d) lactate dehydrogenase A (LDH-A) expression are shown in dot plots. Each dot represents the measurement obtained in each patient, and the dots are organised in two columns corresponding to the tumour grades. The t-test was performed for lactate concentration, while Mann Whitney U tests for NPI, Ki-67 and LDH-A. Statistically significant findings (p < 0.05) are marked by ‘*’.
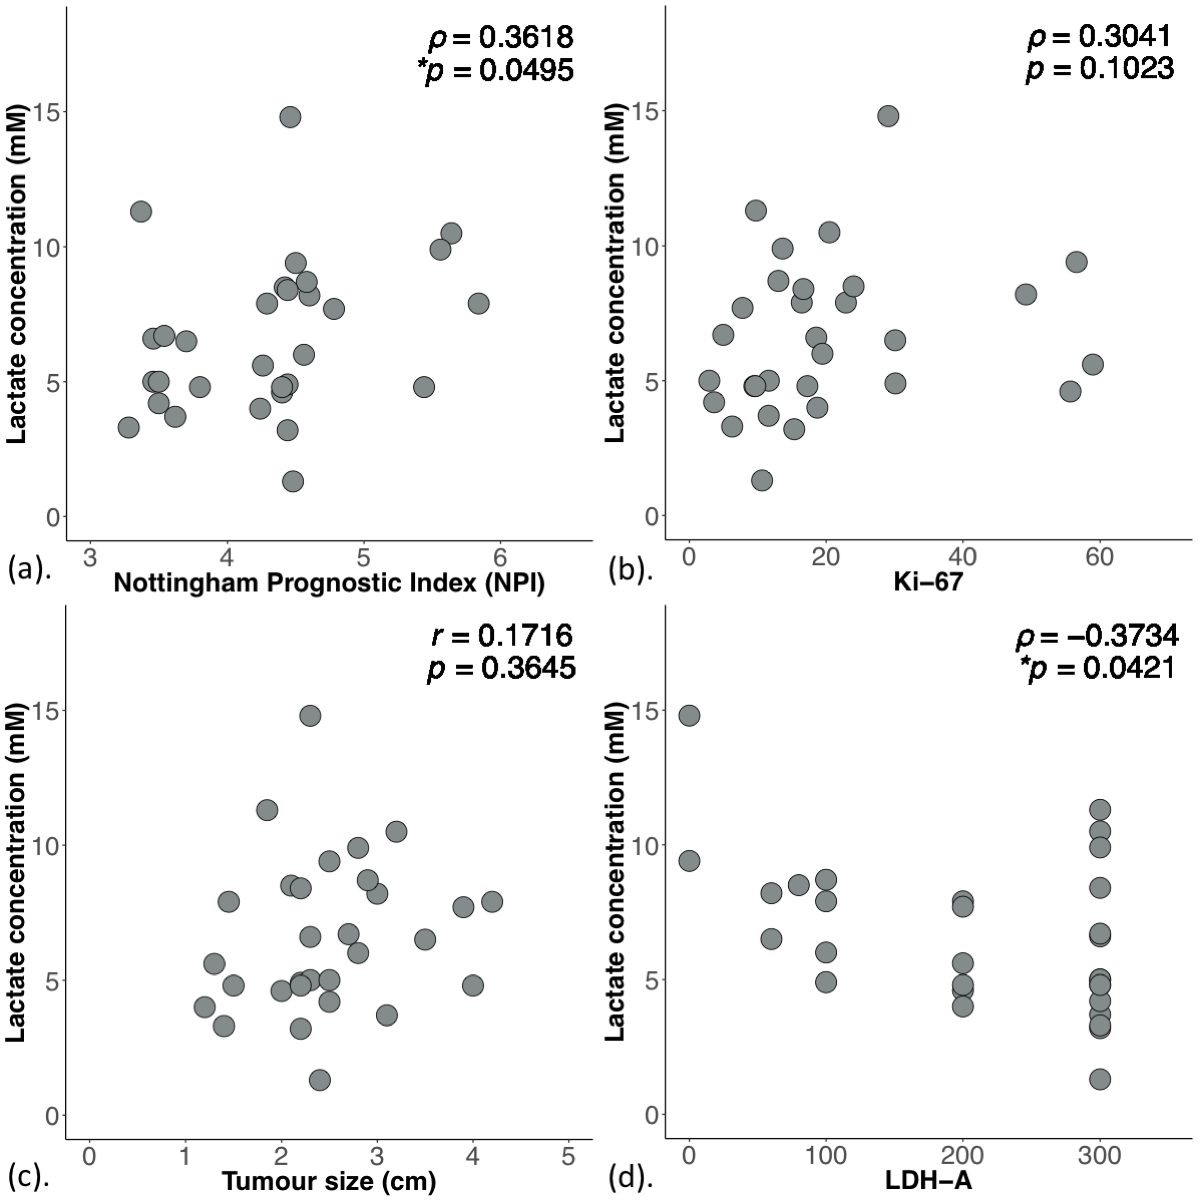
Figure 3. Association between lactate concentration and NPI, Ki-67, tumour size and LDH-A.
The correlation of lactate concentration with (a) NPI, (b) Ki-67, (c) tumour size and (d) lactate dehydrogenase A (LDH-A) expression within the entire cohort are shown in scatter plots. The corresponding Spearman’s rank correlation (ρ score: a, b, d), Pearson’s correlation (r score: c) and p value are displayed. Statistically significant findings (p < 0.05) are marked by ‘*’.