1444
BI-RADS 4 Breast Lesions: Could Synthetic MRI Be Helpful for Their Diagnosis?1The Third Affiliated Hospital of Kunming Medical University,Yunnan Cancer Hospital, Kunming, China, 2GE Healthcare, MR Research China, Beijing, China, Beijing, China, 3The Third People's Hospital of Yunnan Province, China, Kunming, China
Synopsis
Synthetic MRI (syMRI) can quantify multiple relaxation parameters at the same time, which might have potential application value in the BI-RADS 4 lesions. 77 breast disease patients who were defined as BI-RADS 4 in the preoperative MRI examination were prospectively enrolled in this study. Before and after contrast injection, all patients underwent routine MRI and syMRI examinations. The result show that relaxation time and ADC values provided by syMRI and DWI are useful in distinguishing breast BI-RADS 4 lesions. The multi parameter model combined with clinical and imaging features can significantly improve the diagnostic ability of BI-RADS 4 breast lesions.
Background
Based on signal intensity, morphology and dynamics contrast imaging, BI-RADS-MRI is widely regarded as the reference standard for MRI interpretation of breast lesions. These standards are subjective and qualitative assessments. The malignant probability of BI-RADS 4 lesions ranges from 2% to 95%. Such a wide range makes a large part of patients receive unnecessary histological biopsy. Therefore, an objective, rapid, and stable quantitative technique is needed to further assist the diagnosis of such patients. Synthetic MRI (syMRI) can quantify multiple relaxation parameters at the same time, which might have potential application value in the BI-RADS 4 lesions.Purpose
In order to evaluate the value of syMRI in quantitative analysis of breast BI-RADS type 4 lesions, and to develop a method that can diagnose BI-RADS type 4 lesions more efficiently, so as to help patients avoid unnecessary tissue biopsy as much as possible.Assessment
77 breast disease patients who were defined as BI-RADS 4 in the preoperative MRI examination were retrospectively enrolled in this study.Before and after contrast injection, all patients underwent routine MRI and syMRI examinations on 3.0T MRI scanners. Two methods were used to draw the region of interest (ROI) on the T1 and T2 relaxation maps and measured the relaxation time. Two types of measured values were obtained "Tlocal" and "Ttumor". “T” was used to represent the relaxation time of flat scan, and “T+” was used to represent the relaxation time after enhanced scan. Univariate and multivariate logistic regression analysis, the receiver operating characteristic (ROC) analysis, nomogram, calibration curve and clinical decision curve (DCA), the intraclass correlation analysis and the Bland-Altman analysis.Field Strength/Sequence
T1-weighted imaging (T1WI), T2-weighted imaging (T2WI), diffusion-weighted imaging (DWI), and synthetic MRI (syMRI) at 3.0T.Results
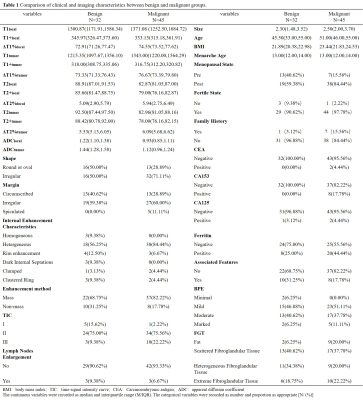
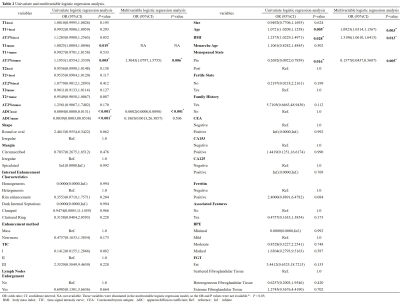
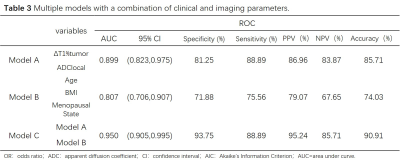
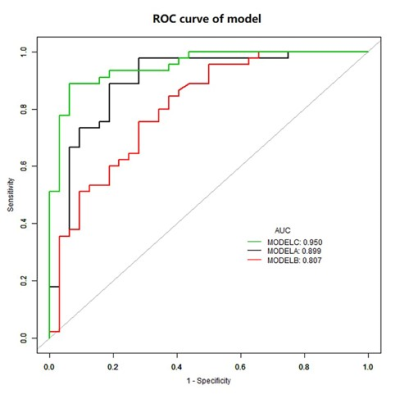
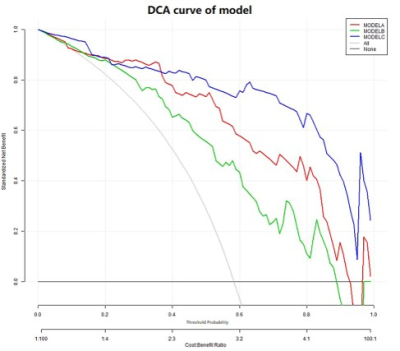
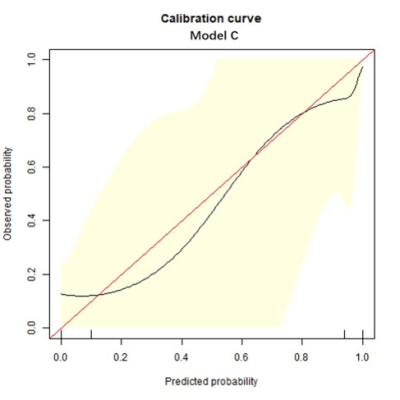
Univariate and multivariable logistic regression analysis showed that age, BMI, menopausal state, ΔT1%tumor and ADClocal were independent variables for differentiating breast cancer from other benign lesions. Combined above variables to construct prediction model A, B and C. The model C and A showed a similar area under the curve (AUC) (AUC =0.950 and 0.899, P =0.124), which were higher than that of model B (AUC =0.807, P =0.002 and 0.047). The DCA indicated that when the threshold probability ranges between 2-10% and 30%-99%, the net benefit of model C was better than other 2 models. The calibration curve of the nomogram providing evidence of good calibration.Conclusions
The relaxation time and ADC values provided by syMRI and DWI are useful in distinguishing breast BI-RADS 4 types of benign and malignant lesions. The multi parameter model combined with clinical and imaging features can significantly improve the diagnostic ability of BI-RADS 4 breast lesions.Acknowledgements
Grant Support: The project was supported by a grant from the Department of science and technology of Yunnan Province, China. NO.2018FE001(-066).References
[1] Magny SJ, Shikhman R, Keppke AL. Breast, Imaging, Reporting and Data System (BI RADS). BTI - StatPearls[J].
[2] Newell MS, Birdwell RL, D'Orsi CJ, et al. ACR Appropriateness Criteria® on nonpalpable mammographic findings (excluding calcifications)[J]. Journal of the American College of Radiology : JACR, 2010, 7(12): 920-930.
[3] Shah VI, Raju U, Chitale D, et al. False-negative core needle biopsies of the breast: an analysis of clinical, radiologic, and pathologic findings in 27 concecutive cases of missed breast cancer[J]. Cancer, 2003, 97(8): 1824-1831.
[4] Bennani-Baiti B, Dietzel M, Baltzer PA. MRI for the assessment of malignancy in BI-RADS 4 mammographic microcalcifications[J]. PloS one, 2017, 12(11): e0188679-e0188679.
[5] Hrkac Pustahija A, Ivanac G, Brkljacic B. US and MRI in the evaluation of mammographic BI-RADS 4 and 5 microcalcifications[J]. Diagnostic and interventional radiology (Ankara, Turkey), 2018, 24(4): 187-194.
[6] Stehouwer BL, Merckel LG, Verkooijen HM, et al. 3-T breast magnetic resonance imaging in patients with suspicious microcalcifications on mammography[J]. European radiology, 2014, 24(3): 603-609.
[7] Strobel K, Schrading S, Hansen NL, et al. Assessment of BI-RADS category 4 lesions detected with screening mammography and screening US: utility of MR imaging[J]. Radiology, 2015, 274(2): 343-351.
[8] Zhang L, Tang M, Min Z, Lu J, Lei X, Zhang X. Accuracy of combined dynamic contrast-enhanced magnetic resonance imaging and diffusion-weighted imaging for breast cancer detection: a meta-analysis. Acta Radiol. 2016;57(6):651-660.
[9] Mann RM, Balleyguier C, Baltzer PA, et al. Breast MRI: EUSOBI recommendations for women's information. Eur Radiol. 2015;25(12):3669-3678.
[10] Partridge SC, DeMartini WB, Kurland BF, Eby PR, White SW, Lehman CD. Quantitative diffusion-weighted imaging as an adjunct to conventional breast MRI for improved positive predictive value. AJR Am J Roentgenol. 2009;193(6):1716-1722.
[11] Strobel K, Schrading S, Hansen NL, Barabasch A, Kuhl CK. Assessment of BI-RADS category 4 lesions detected with screening mammography and screening US: utility of MR imaging. Radiology. 2015;274(2):343-351.
[12] Dijkstra H, Dorrius MD, Wielema M, Pijnappel RM, Oudkerk M, Sijens PE. Quantitative DWI implemented after DCE-MRI yields increased specificity for BI-RADS 3 and 4 breast lesions. J Magn Reson Imaging. 2016;44(6):1642-1649.
[13] Stanisz GJ, Odrobina EE, Pun J, et al. T1, T2 relaxation and magnetization transfer in tissue at 3T. Magn Reson Med. 2005;54(3):507-512.
[14] Jung Y, Gho SM, Back SN, Ha T, Kang DK, Kim TH. The feasibility of synthetic MRI in breast cancer patients: comparison of T2 relaxation time with multiecho spin echo T2 mapping method [published online ahead of print, 2018 Sep 21]. Br J Radiol. 2018;92(1093):20180479.
[15] Krauss W, Gunnarsson M, Andersson T, Thunberg P. Accuracy and reproducibility of a quantitative magnetic resonance imaging method for concurrent measurements of tissue relaxation times and proton density. Magn Reson Imaging. 2015;33(5):584-591.
[16] Hagiwara A, Hori M, Cohen-Adad J, et al. Linearity, Bias, Intrascanner Repeatability, and Interscanner Reproducibility of Quantitative Multidynamic Multiecho Sequence for Rapid Simultaneous Relaxometry at 3 T: A Validation Study With a Standardized Phantom and Healthy Controls. Invest Radiol. 2019;54(1):39-47.
[17] Veronesi U, Boyle P, Goldhirsch A, et al. Breast cancer[J]. Lancet (London, England), 2005, 365(9472): 1727-1741.
[18] Odle TG. Precision Medicine in Breast Cancer[J]. Radiologic technology, 2017, 88(4): 401M-421M.
[19] Sun Y-S, Zhao Z, Yang Z-N, et al. Risk Factors and Preventions of Breast Cancer[J]. International journal of biological sciences, 2017, 13(11): 1387-1397.
[20] S E Hankinson, J E Manson, D Spiegelman,et al. Reproducibility of plasma hormone levels in postmenopausal women over a 2-3-year period.[J]. Cancer epidemiology, biomarkers & prevention : a publication of the American Association for Cancer Research, cosponsored by the American Society of Preventive Oncology, 1995, 4(6):649.
[21] Fisher B, Costantino JP, Wickerham DL, et al. Tamoxifen for the prevention of breast cancer: current status of the National Surgical Adjuvant Breast and Bowel Project P-1 study. J Natl Cancer Inst. 2005;97(22):1652-1662.
[22] Key T, Appleby P, Barnes I, Reeves G; Endogenous Hormones and Breast Cancer Collaborative Group. Endogenous sex hormones and breast cancer in postmenopausal women: reanalysis of nine prospective studies. J Natl Cancer Inst. 2002;94(8):606-616.
[23] Stanczyk FZ, Mathews BW, Sherman ME. Relationships of sex steroid hormone levels in benign and cancerous breast tissue and blood: A critical appraisal of current science. Steroids. 2015;99(Pt A):91-102.
[24] Lønning PE, Helle H, Duong NK, Ekse D, Aas T, Geisler J. Tissue estradiol is selectively elevated in receptor positive breast cancers while tumour estrone is reduced independent of receptor status. J Steroid Biochem Mol Biol. 2009;117(1-3):31-41.
[25] Lønning PE, Haynes BP, Straume AH, et al. Recent data on intratumor estrogens in breast cancer. Steroids. 2011;76(8):786-791.
[26] Lonning P E , Haynes B P , Straume A H , et al. Exploring Breast Cancer Estrogen Disposition: The Basis for Endocrine Manipulation[J]. Clinical Cancer Research An Official Journal of the American Association for Cancer Research, 2011, 17(15):4948-58.
[27] Renehan AG, Tyson M, Egger M, Heller RF, Zwahlen M. Body-mass index and incidence of cancer: a systematic review and meta-analysis of prospective observational studies. Lancet. 2008;371(9612):569-578.
[28] Suzuki R, Orsini N, Saji S, Key TJ, Wolk A. Body weight and incidence of breast cancer defined by estrogen and progesterone receptor status--a meta-analysis. Int J Cancer. 2009;124(3):698-712.
[29] Key TJ, Appleby PN, Reeves GK, et al. Body mass index, serum sex hormones, and breast cancer risk in postmenopausal women. J Natl Cancer Inst. 2003;95(16):1218-1226.
[30] Siiteri, P K. Adipose Tissue as a Source of Hormones[J]. American Journal of Clinical Nutrition, 1987, 45(1):277-282.
[31] Calle EE, Kaaks R. Overweight, obesity and cancer: epidemiological evidence and proposed mechanisms. Nat Rev Cancer. 2004;4(8):579-591.
[32] Caterson ID, Inoue S, Zimmet PZ. The Asia-Pacific Perspective: Redefining Obesity and Its Treatment[J]. Www.iotf.org/asiapacific, 2000.
[33] Zhang M, Horvat JV, Bernard-Davila B, et al. Multiparametric MRI model with dynamic contrast-enhanced and diffusion-weighted imaging enables breast cancer diagnosis with high accuracy. J Magn Reson Imaging. 2019;49(3):864-874.
[34] Partridge SC, McDonald ES. Diffusion weighted magnetic resonance imaging of the breast: protocol optimization, interpretation, and clinical applications. Magn Reson Imaging Clin N Am. 2013;21(3):601-624.
[35] Bottomley PA, Hardy CJ, Argersinger RE, Allen-Moore G. A review of 1H nuclear magnetic resonance relaxation in pathology: are T1 and T2 diagnostic?. Med Phys. 1987;14(1):1-37.
[36] Bottomley PA, Foster TH, Argersinger RE, Pfeifer LM. A review of normal tissue hydrogen NMR relaxation times and relaxation mechanisms from 1-100 MHz: dependence on tissue type, NMR frequency, temperature, species, excision, and age. Med Phys. 1984;11(4):425-448.
[37] Kvistad KA, Rydland J, Vainio J, et al. Breast lesions: evaluation with dynamic contrast-enhanced T1-weighted MR imaging and with T2*-weighted first-pass perfusion MR imaging. Radiology. 2000;216(2):545-553.
[38] Liu L, Yin B, Geng DY, Lu YP, Peng WJ. Changes of T2 Relaxation Time From Neoadjuvant Chemotherapy in Breast Cancer Lesions. Iran J Radiol. 2016;13(3):e24014. Published 2016 Jan 9.
[39] Boné B, Wiberg MK, Parrado C, Falkmer U, Aspelin P, Gad A. Mechanism of contrast enhancement in breast lesions at MR imaging. Acta Radiol. 1998;39(5):494-500.
[40] Gail MH, Brinton LA, Byar DP, et al. Projecting individualized probabilities of developing breast cancer for white females who are being examined annually[J]. Journal of the National Cancer Institute, 1989, 81(24): 1879-1886.
[41] Cintolo-Gonzalez JA, Braun D, Blackford AL, et al. Breast cancer risk models: a comprehensive overview of existing models, validation, and clinical applications[J]. Breast cancer research and treatment, 2017, 164(2): 263-284.
[42] McCarthy AM, Keller B, Kontos D, et al. The use of the Gail model, body mass index and SNPs to predict breast cancer among women with abnormal (BI-RADS 4) mammograms[J]. Breast cancer research : BCR, 2015, 17(1): 1-1.
[43] Armstrong K, Handorf EA, Chen J, et al. Breast cancer risk prediction and mammography biopsy decisions: a model-based study[J]. American journal of preventive medicine, 2013, 44(1): 15-22.
Figures