1443
Multiparametric prediction model for triple negative breast cancer subtypes using MR parameters including ultrafast DCE MRI1Radiology, National Hospital Organisation, Kyoto Medical Center, Kyoto, Japan, 2Diagnostic Imaging and Nuclear Medicine, Kyoto University Graduate School of Medicine, Kyoto, Japan, 3Siemens Healthcare K.K., Tokyo, Japan, 4Siemens Healthcare GmbH, Erlangen, Germany, 5Breast Surgery, Kyoto University Graduate School of Medicine, Kyoto, Japan
Synopsis
We tried to construct MRI-based multiparametric model to predict triple negative (TN) subtype among invasive cancers presenting as masses using 165 lesions (including 26 TN subtype). Maximum slope (MS) and time to enhancement (TTE) from ultrafast (UF)-DCE MRI, apparent diffusion coefficient (ADC), signal to noise ratio on T2-WI, rim enhancement on different phases of the DCE MRI were examined with univariate and multivariate logistic regression analysis. The model using MS from UF-DCE MRI and rim enhancement from early phase of DCE MRI demonstrated the AUC of 0.74 in identifying TN subtype, indicating the MRI’s potential to identify TN subtype noninvasively.
Introduction
Triple negative (TN) subtype of breast cancer is a highly proliferative subtype needing chemotherapy1. The overall survival rate of TN subtype patients was worse than non-TN subtype patients2. High T2-signal intensity (SI), high apparent diffusion coefficient (ADC) value, high perfusion, and rim enhancement are considered as key parameters for predicting TN subtype3-5. Ultrafast (UF) DCE MRI can evaluate breast lesions with high spatial and temporal resolution. Some parameters from UF-DCE MRI show high diagnostic performance6.7. There are limited studies to use UF-DCE MRI as imaging prognostic biomarkers8,9. Rim enhancement is one of the features suggesting malignancy and often seen among TN subtype, yet the frequency of rim enhancement may differ between UF-DCE MRI and conventional DCE MRI. Therefore, we aimed to identify TN subtype among invasive cancers presenting as masses using the following MRI derived parameters: maximum slope (MS) and time to enhance (TTE) from ultrafast UF-DCE MRI, ADC from DWI, signal noise ratio of T2WI (T2-SNR) and rim enhancement on UF-DCE MRI and early phase of conventional DCE MRI.Materials & Methods
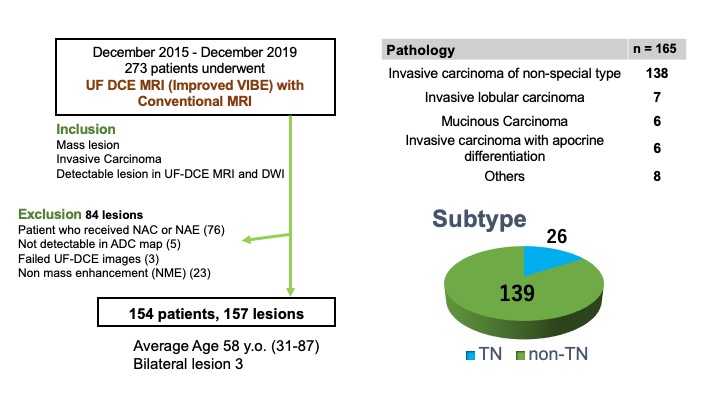
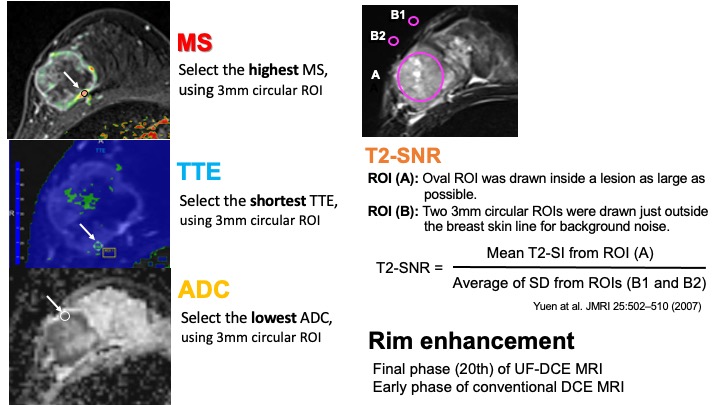
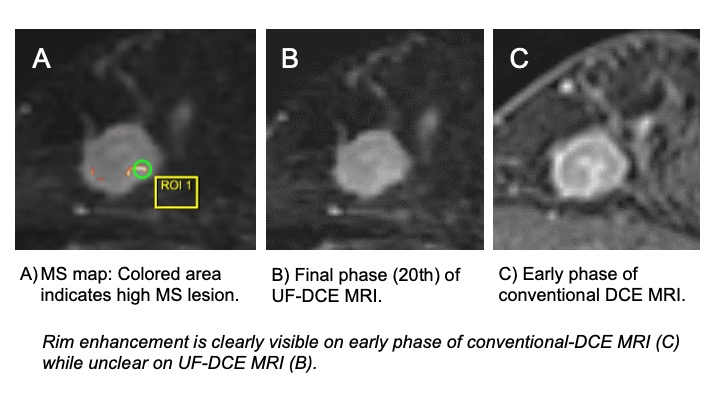
Study population: Study population included patients who underwent breast MRI including the UF-DCE MRI with conventional MRI protocols, between December 2015 until November 2019. In total, 273 patients with histopathologically diagnosed invasive breast carcinomas were identified. Those who received neoadjuvant chemotherapy or neoadjuvant endocrine-therapy, whose lesions were not visible on ADC maps, or the failure of UF-DCE imaging acquisition were excluded. Lesions presenting as non-mass enhancement (NME) were excluded. A total of 165 lesions in 162 patients (age range 31-87 y.o., mean 58 y.o.) were included ( bilateral lesions in 3 patients) (Fig.1).MRI protocols and Image analysis: Breast MRI was performed with a 3T scanner using dedicated 16 or 18 channel bilateral breast coils. Protocol included T2WI (TR/TE 5660/ 79ms, FA 140˚, 0.74 x 0.74 x 3.0 mm3/voxel), T1WI, diffusion weighted imaging (DWI) (TR/TE 6300/ 50ms, FA 90˚, 2.0 x 2.0 x 3.0 mm3/voxel) and fat-suppressed T1WI DCE images (TR/TE 3.8/1.4 ms, FA 15˚; matrix, 384 × 384 × 1.0 mm3/voxel) were obtained. Compressed Sensing Volumetric Interpolated Breath hold Examination (CS-VIBE, prototype sequence) was obtained as UF-DCE MRI: 15 seconds before contrast injection to 60 seconds after contrast injection, 2 seconds preparation time followed by 20 continuous phases taken at a rate of 3.7 s/phase immediately after gadolinium injection (TR/TE 5.0-4.8/2.5ms, FA 15˚, 0.94 x 0.94 x 2.5 mm3/voxel). Two post contrast standard DCE images were obtained immediately after UF-DCE protocol.MS was defined as a percentage relative enhancement per seconds (%/s) and TTE was defined as a time interval between aorta and lesion enhancement. To quantify the highest MS, the shortest TTE and the lowest ADC value, 3mm circular ROI was used. To quantify signal-to-noise ratio (SNR) of T2WI, T2WI (SNR): the region-of-interest (ROI) of the tumors and background noise on T2WI was measured and SI values of tumor were divided by the corresponding SD of the background noise to derive the SNR. Rim enhancement was recorded as qualitative value using final phase (20th) of UF-DCE MRI and early phase of conventional DCE MRI (Fig.2).Statistical Analysis: Each MRI parameter was measured independently by two radiologists, and the inter-rater agreements were evaluated using intra-class correlation coefficients (ICC). Univariate logistic regression analysis was performed to predict significant parameters to select significant predicted parameters (p<0.05) to predict TN and non-TN subtypes using MS, TTE, ADC, T2-SI and two different rim enhancements. Then, multivariate logistic regression analysis was performed. The prediction model was created from multivariate logistic regression analysis using an area under the ROC curve (AUC).Results
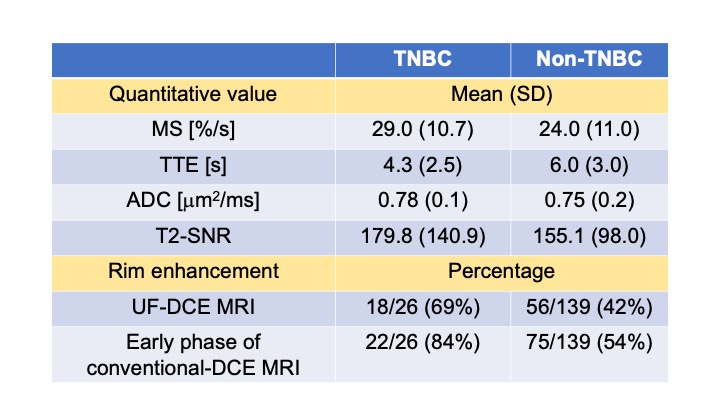
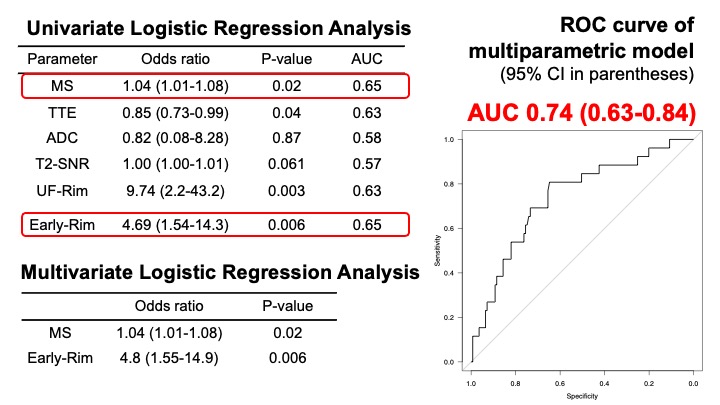
Among 165 lesions, there were 26 lesions with TN subtype. An interrater agreement of MS, TTE, ADC was excellent (ICC 0.97, 0.97, 0.83, respectively). The averaged values were used for further analysis. A mean and SD of quantitative value (MS, TTE and ADC), and percentage of rim enhancement from two DCE MRI between TNBC and non-TNBC were listed in Table (Fig.3). After univariate and multivariate logistic regression analysis, MS from UF-DCE MRI and rim enhancement from early phase of DCE-MRI remained as significant parameters. The multiparametric prediction model using these significant parameters yielded an area under the ROC curve (AUC) of 0.74 (confidence interval of 0.63-0.84 ) (Fig.4).A case of TNBC with rim enhancement is shown in fig.5.Discussion
Our results suggest that parameter from UF-DCE MRI (MS) and rim enhancement from the early phase of DCE MRI can be used to identify TN subtype among invasive breast cancers presenting as masses. Rim enhancement on the early phase of DCE-MRI is more frequently observed with stronger association with TN subtype than that on UF-DCE MRI UF-DCE MRI may not be ideal to evaluate detailed morphological information including rim enhancement that may be linked to subtype classifications. Multiparametric approach improves diagnostic accuracy, yet the optimal weight of each parameter can be different between subtype classification and diagnosis of malignant lesions6.Conclusion
A multiparametric model using MS from UF-DCE MRI and rim enhancement from early phase of DCE MRI can be a promising imaging biomarker to identify TN subtype.Acknowledgements
This work was partly supported by JSPS KAKENHI Grant number 18K07673 "Tumor vascularity and tumor-related vessels using ultrafast DCE MRI of the Breast".References
1. P.L. Nguyen, J. Clin. Oncol. 26 (2008) 2373–2378.,
2. X.Li., Breast Cancer Res. Treat. 161 (2017) 279–287.
3. Uematsu et al.,Radiology, 2009 Mar;250(3):638-47.
4. Ji Hyun et al., Eur Radiol. Aug;22(8):1724-34.
5. Li SP et al, Eur Radiol 2011 Jul;21(7):1364-73.
6. A. Ohashi, Eur. Journal of Radiol. 2019 Sep;118:285-292.
7. M. Honda, J. Magn. Reson. Imaging. 2020 Jan;51(1):164-174.
8. N. Onishi, Breast Cancer Res. 22 (2020) 1–13
9. S.U. Shin, Eur. Radiol. 2020 Jul;30(7):4058-4068.
Figures