1440
Ultrafast DCE MRI Using Compressed Sensing: Separate Visualization of Arteries and Veins in Differential Diagnosis of Breast Tumors (BI-RADS 4)1The First Affiliated Hospital of Dalian Medical University, Dalian, China, 2Dalian Medical University, Dalian, China, 3Philips Healthcare, Beijing, China, Beijing, China
Synopsis
Dynamic contrast-enhanced magnetic resonance imaging (DCE-MRI) is an important tool for the diagnosis of breast cancer. It is of great importance to develop new MRI acquisition and analysis methods that can yield improved biomarkers with higher specificity for the diagnosis of breast lesions. The purpose of the present study is to explore visualization and quantitative information of tumor-associated vessels to improve diagnostic accuracy of breast tumors (MR BI-RADS 4). The results show that combination of quantitative breast vascular information may provide an accurate means for the diagnosis of breast cancer.
Introduction
Both semi-quantitative and quantitative analysis of DCE-MRI have been shown to provide important insights in both the diagnostic and prognostic settings for breast cancer. The sensitivity of DCE-MRI has been reported as 88% to 100% but with a variable specificity of 63% to 96% [1]. Vascular assessment may be useful in breast MRI interpretation. The time interval between arterial and venous visualization (AVI) was also reported as a novel parameter, with which to identify malignant lesions [2]. Recent studies suggested that both Ultrafast Dynamic Contrast-Enhanced (UF-DCE) MRI and conventional kinetic analysis showed relatively low specificity [3, 4]. The application of compressed sensing (CS) technology is expected to improve the diagnostic ability of breast MRI by knowing the number of vessels associated with hypervascularized benign and malignant lesions.Methods:
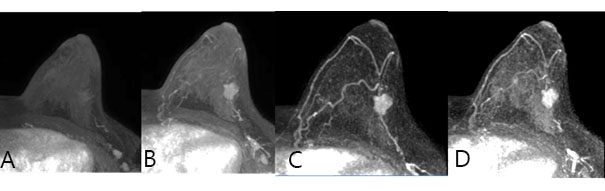
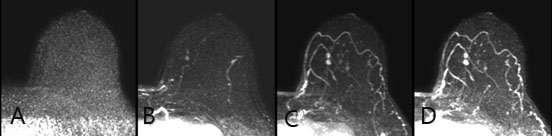
In this prospective study, a total of 22 female patients (49.95±10.52, range: 24-68 years) were enrolled and informed consent was acquired from each patient. All patients were performed MR scan using a 3.0 T whole-body MR scanner (Philips Ingenia CX, Philips Healthcare, the Netherlands) with a dedicated seven-channel bilateral phase-array breast coil, and were diagnosed as MR BI-RADS 4. Specifically, Group 1 included 11 patients with malignant breast tumors, including 3 Invasive Ductal Carcinoma (IDC) II and 8 IDC III (Fig1); Group 2 included 11 patients with 11 benign breast tumors, including 3 fibroadenomas and 8 intraductal papilliomas (one patient had two intraductal papilliomas and the bigger one was enrolled, Fig2). The region of interest (ROI) was draw based on DCE-MRI images. Permeability paraments, including the volume transfer constant (Ktrans), extracellular volume fraction (Ve) and backflux rate (Kep), in lesion were measured based on DCE-MRI. Other image values (maximal lesion diameter, AVI and vessel count) were also detected. Above MR image values and age were compared between two groups, and the diagnostic performance based on parameters was quantified with ROC curve. Vessel count was obtained on the arterio-DCE phases and the number of tumor vessels within 3 cm around the tumor was counted.Results:
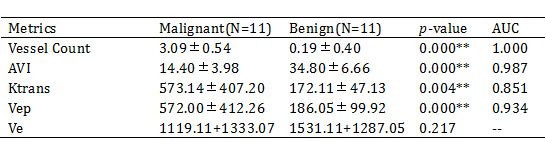
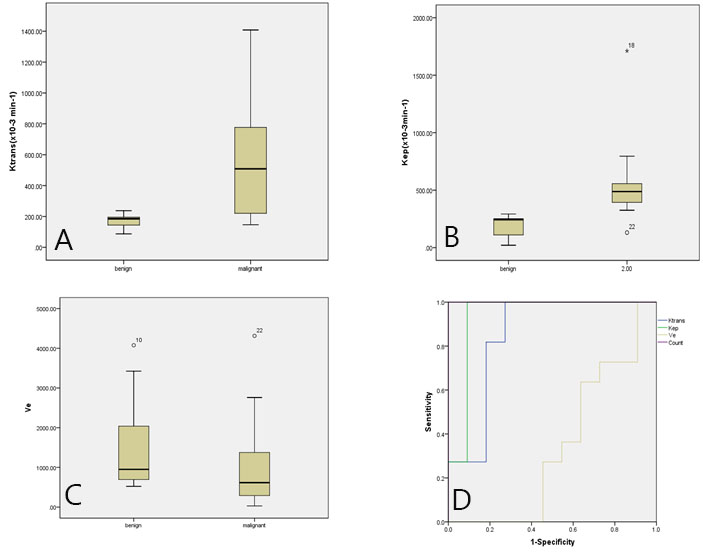
There was no significant difference in age and maximal lesion diameter between two groups (p = 0.075,0.134). The intraclass correlation coefficients (ICC, 0.96 and 0.90 for group 1 and 2, respectively) indicate a good inter-observer agreement of the measured image values. The Ktrans, Vep, AVI and vessels count showed significant difference between malignant and benign tumors (p= 0.004, 0.000, 0.000 and 0.000) and area under the curve (AUC) was acquired by them was 0.851, 0.934, 1.000 and 0.987, respectively. Optimal threshold acquired by AVI was 19.8s (sensitivity of 100%, a specificity of 90.9%, and an accuracy of 63.6%)Discussion and Conclusion:
Few studies focused on methods for automatically identifying the vessels that directly feed or drain the suspicious lesion. Furthermore, there is a paucity of studies investigating the synthesis of vessel architecture (i.e., morphology) with the results of a quantitative DCE‐MRI analysis (i.e., function). This study aimed to extract both morphological and functional information about tumor blood supply condition by combining ultrafast DCE-MRI scans with CS technology. The Ktrans, Vep, AVI and vessel count were assessed for the accuracy of malignant discrimination, individually and in linear combinations. Our present results also suggest the discriminating power of AVI between benign papillary tumors (intraductal papillioma) and malignant intraductal tumors (IDC), additionally show that of the AVI is comparable to that of vessels count and better than that of conventional dynamic vascular analysis. The results show that combination of quantitative breast vascular information (AVI and vessel count) may provide an accurate means for the differentiation of IDC and benign papillary tumors.Acknowledgements
No acknowledgement found.References
[1] Peters NHGM, Rinkes IHMB, Zuithoff NPA, et al. Meta-analysis of MR imaging in the diagnosis of breast lesions. Radiology. 2008; 246:116-124.
[2] Onishi N, Kataoka M, Kanao S, et al. Ultrafast dynamic contrast enhanced MRI of the breast using compressed sensing: Breast cancer diagnosis based on separate visualization of breast arteries and veins.J Magn Reson Imaging 2018;47:97-104.
[3]Vreemann S,Rodriguez-Ruiz A, Nickel D, et al.Compressed Sensing for Breast MRI: Resolving the Trade-Off Between Spatial and Temporal Resolution--3T. Invest Radiol.2017;52(10):574-582.
[4] Wu C, Pineda F, Hormuth DA, et al. Quantitative analysis of vascular properties derived from ultrafast DCE‐MRI to discriminate malignant and benign breast tumors. Magn Reson Med. 2019; 81:2147–2160.
Figures