1439
Tentative assignment of methylmalonic acid in the breast tissue using in vivo 2D COSY and relationships with risk factors of breast cancer1Radiology, Princess Alexandra Hospital, Brisbane, Australia, 2Queensland University of Technology, Brisbane, Australia, 3Translational Research Institute, Brisbane, Australia, 4Jones and Partners Radiology, St Andrew’s Hospital, Adelaide, Australia
Synopsis
Methylmalonic acid (MMA) has been linked to ageing and a systemic environment that favours the progression and tumours aggressiveness. We aim to assign MMA in breast tissue using in vivo 2D COSY in a series of 172 participants including women at average and elevated risk. A second purpose is to explore if MMA is associated with breast cancer risk factors. Two resonances were recorded at 3.15 and 3.19ppm in breast tissue, consistent with the presence of MMA1 and MMA2 molecules. The level of MMA correlates positively with breast density/menopausal status and IBIS risk score and, negatively with age and BMI.
Introduction
Methylmalonic acid (MMA) has been linked to ageing and a systemic environment that favours the progression and aggressiveness of tumours (1). MMA is a by-product of propionate metabolism that elicits transcriptional reprogramming to give cancer cells aggressive properties (1). Commodari et al demonstrated the pH sensitivity of MMA (2). At 400MHz, the proton MR spectrum has two multiplets centered at 1.23 and 3.17ppm when recorded in D2O at 25ºC and pH 7.2. The multiplets centered at 3.17ppm has four resonances at 3.14, 3.16, 3.17 and 3.18ppm in the ratio of 1:4:4:1 (3).We hypothesise that MMA can be identified in breast tissue using in vivo two-dimensional Correlated SpectroscopY (2D COSY).
Purpose
1.To assign MMA in breast tissue using in vivo 2D COSY.2.To explore if MMA is associated with breast cancer risk factors: age, body mass index (BMI), breast density/menopausal status and lifetime risk of breast cancer (IBIS score).
Material and Methods
ParticipantsInstitutional review board approvals and informed consents obtained.
Multisite cross-sectional study with prospective data collection between October 2017 and August 2019.
One hundred and seventy-two healthy participants with no personal history of breast cancer recruited. According to National Institute for Health and Care Excellence (NICE) guidelines (4), 66 were at general population risk of breast cancer (<17%) and 106 at elevated risk (≥ 17%). Of these, 89 had familial risk (no known mutation), 8 had BRCA1 mutation and 9 had BRCA2 mutation.
Mean age, 45.4 years (standard deviation, 12.1; range: 20-79).
MR Imaging
Data collected on 3T scanners (Prisma or Vida, Siemens AG, Germany) using 18-channel (Siemens AG, Germany) or 16-channel (RAPID Biomedical, Germany) breast coils.
Contrast administered to participants at elevated risk. Sequences: (a) T2-weighted TSE, (b)T1-weighted 3D FLASH. For dynamic study, images obtained prior and five times after intravenous injection of 0.1 mmol/kg gadobutrol (Gadovist, Bayer, Germany) and 20 mL saline, (c) diffusion-weighted sequence.
Breast density categorised as fatty, scattered density, heterogeneous density and extremely dense (5).
In vivo 2D COSY
T1-weighted sequence to position an 8cc voxel. Localized shimming using the automatic B0-field mapping technique (6) to achieve a width of the water peak at half maximum of ≤ 65Hz.
2D COSY parameters: TR 2000 ms, TE initial 30 ms, 96 t1 increments at 0.8 ms, 6 averages per increment, f2 bandwidth 2000 Hz, vector size of 1024 points. ‘WET’ water suppression applied prior to acquisition (7). Processing as reported (8). Peak positions standardised by chemical shift reference of (1.30,1.30)ppm.
Statistical analysis
Age, BMI, IBIS score, breast density, menopausal status recorded.
Mean comparison between groups using Mann-Whitney test. A two-sided p-value of <0.05 considered statistically significant.
Results
a. MMA assignmentA contour plot of the expanded region F2/F1: 3.00ppm to 3.90ppm of a typical 2D COSY spectrum from a participant with dense breasts is shown in Figure 1, where resonances at 3.15ppm and 3.19ppm are apparent and consistent with the presence of the MMA molecule. The second multiplet of MMA at 1.23ppm is not visible due to the large methylene resonance from fatty acyl chains. Some spectra required additional processing to reduce the lipid contribution. This allowed the diagonal resonance at 3.19ppm and the cross peak at (1.27- 3.20)ppm showing scalar coupling of the methyl protons and methyne protons of MMA to be recorded.
b. Relationships of MMA with breast cancer risk factors
Age and BMI were negatively correlated with the amount of MMA1 and MMA2: the higher the age and BMI, the lower the MMA levels. BMI explained 38% of the variability of MMA in BRCA1 mutation carriers.
Breast density with menopausal status and IBIS score had a positive correlation with MMA. In the group of women at average risk, postmenopausal women with high density breasts showed the highest level of MMA2 (p<0.001) and MMA1 (p<0.001) (Figure 2). In those at elevated risk, however, premenopausal women with high density breasts had the highest level of MMA2 (p<0.001) and MMA1 (p<0.001) (Figure 3).
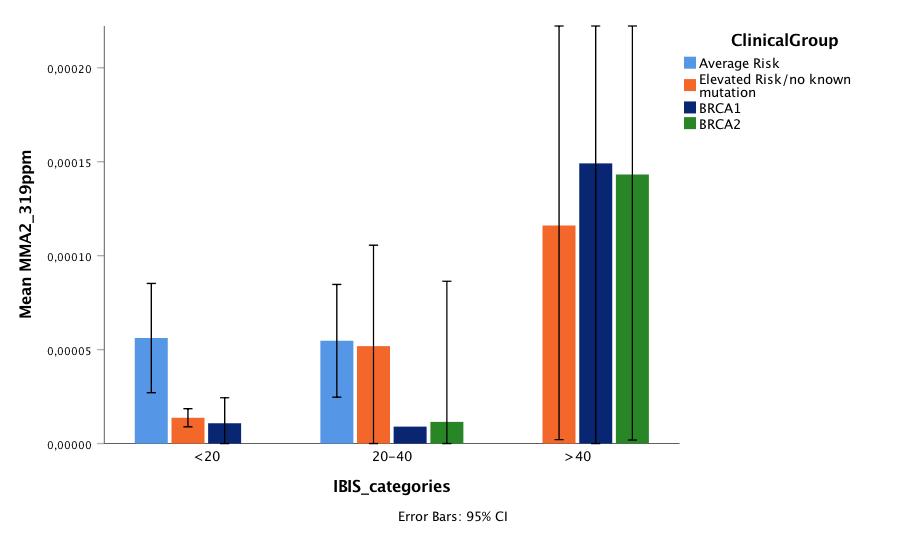
The amount of these two resonances increased linearly with the risk of breast cancer according to IBIS risk score. IBIS score explained 44% of the variability of MMA2 in BRCA2 mutation carriers. BRCA mutation carriers showed significantly higher level of MMA1 (p=0.011) and MMA2 (p=0.018) compared to women with no known mutation (Figures 4,5).
The multiple linear regression analysis demonstrated that for MMA2, BMI and IBIS score explained 15% of its variability in the tissue (p<0.001). For MMA1, age and BMI explained 12% of its variability (p<0.001).
Discussion and Conclusions
Using in vivo 2D COSY, two resonances are recorded at 3.15 and 3.19ppm in breast tissue, consistent with the presence of MMA1 and MMA2 molecules. In the cohort at average risk, postmenopausal women with high density have seven times higher levels of MMA than those with low density breast.In those at elevated risk, premenopausal participants with high density breast have eight times higher levels of MMA than those with low density breast. Importantly, in this cohort, the MMA is highest in women carrying the BRCA gene mutations.
Whether or not the assignment is correct, the level of the molecule being measured correlates positively with breast density/menopausal status and IBIS risk score and, negatively with age and BMI.
Acknowledgements
No acknowledgement found.References
1. Gomes AP, Ilter D, Low V, et al. Age-induced accumulation of methylmalonic acid promotes tumour progression. Nature 2020; 585: 283-287.
2. Commodari, F., et al., 1H NMR characterization of normal human cerebrospinal fluid and the detection of methylmalonic acid in a vitamin B12 deficient patient. NMR Biomed. 1991; 4: 192-200.
3. Wishart DS, Knox C, Guo AC, et al. HMDB: a knowledgebase for the human metabolome. Nucleic Acids Res. 2009; 37(Database issue): D603-10. doi: 10.1093/nar/gkn810. Epub 2008 Oct 25.
4. Mulsow J, Lee J, Dempsey C, Rothwell J, Geraghty JG. Establishing a family risk assessment clinic for breast cancer. Breast J 2009; 15 Suppl 1: S33-38.
5. D’Orsi CJ, Sickles EA, Mendelson E et al. ACR BI-RADS Atlas, breast imaging reporting and data system (American College of Radiology, Reston, Virginia, 2003).
6. Mountford C, Ramadan S, Stanwell P, Malycha P. Proton MRS of the breast in the clinical setting. NMR Biomed. 2009; 22: 54-64.
7. Ogg RJ, Kingsley PB, Taylor JS. WET, a T1- and B1-insensitive water-suppression method for in vivo localized 1H NMR spectroscopy. J Magn Reson 1994; 104: 1-10.
8. Ramadan S, Arm J, Silcock J et al. Lipid and metabolite deregulation in the breast tissue of women carrying BRCA1 and BRCA2 genetic mutations. Radiology 2015; 275: 675-682.
Figures