1438
DCE-MRI Topology for Early Prediction of Breast Cancer Response to Neoadjuvant Chemotherapy1EECS, Oregon State University, Corvallis, OR, United States, 2Advanced Imaging Research Center, Oregon Health & Science University, Portland, OR, United States
Synopsis
We applied Topological Data Analysis (TDA) to pre-neoadjuvant chemotherapy (pre-NAC) DCE-MRI datasets from the ISPY-1 trial for NAC treatment of breast cancer (BC). The pairwise topological distance between tumors’ signal enhancement ratio (SER) maps was computed. Hierarchical Agglomerative Clustering (HAC) was applied to cluster topologically similar patients. In combination with clinical and histopathological data using logistic regression models, the predictive performance of MRI topology for pathologic complete response (pCR) was compared to longest diameter (LD) and functional tumor volume (FTV). The preliminary results show that MRI topology may be a more accurate early predictor of BC response to NAC.
Introduction
Neoadjuvant chemotherapy (NAC) is increasingly used to treat locally advanced breast cancer (BC). Pathologic complete response (pCR) or minimal residual disease following NAC has been shown to be prognostic for survival1-3. The majority of the patients, however, do not achieve pCR with the pCR rate reported in the range of 6 - 45%4. The pCR status can only be determined from the surgical specimen after 4 – 5 month long NAC has been completed, hence, the ability to individually tailor therapy and reduce toxicities associated with ineffective drugs is limited. Therefore, there is a genuine need for minimally invasive and accurate methods to provide early prediction of response to NAC. In this preliminary work we applied a new method of topological data analysis (TDA)5-7 to pre-NAC DCE-MRI data and assessed the performance of TDA metrics for prediction of pCR in comparison with other MRI markers, such as functional tumor volume (FTV)8-9.Methods
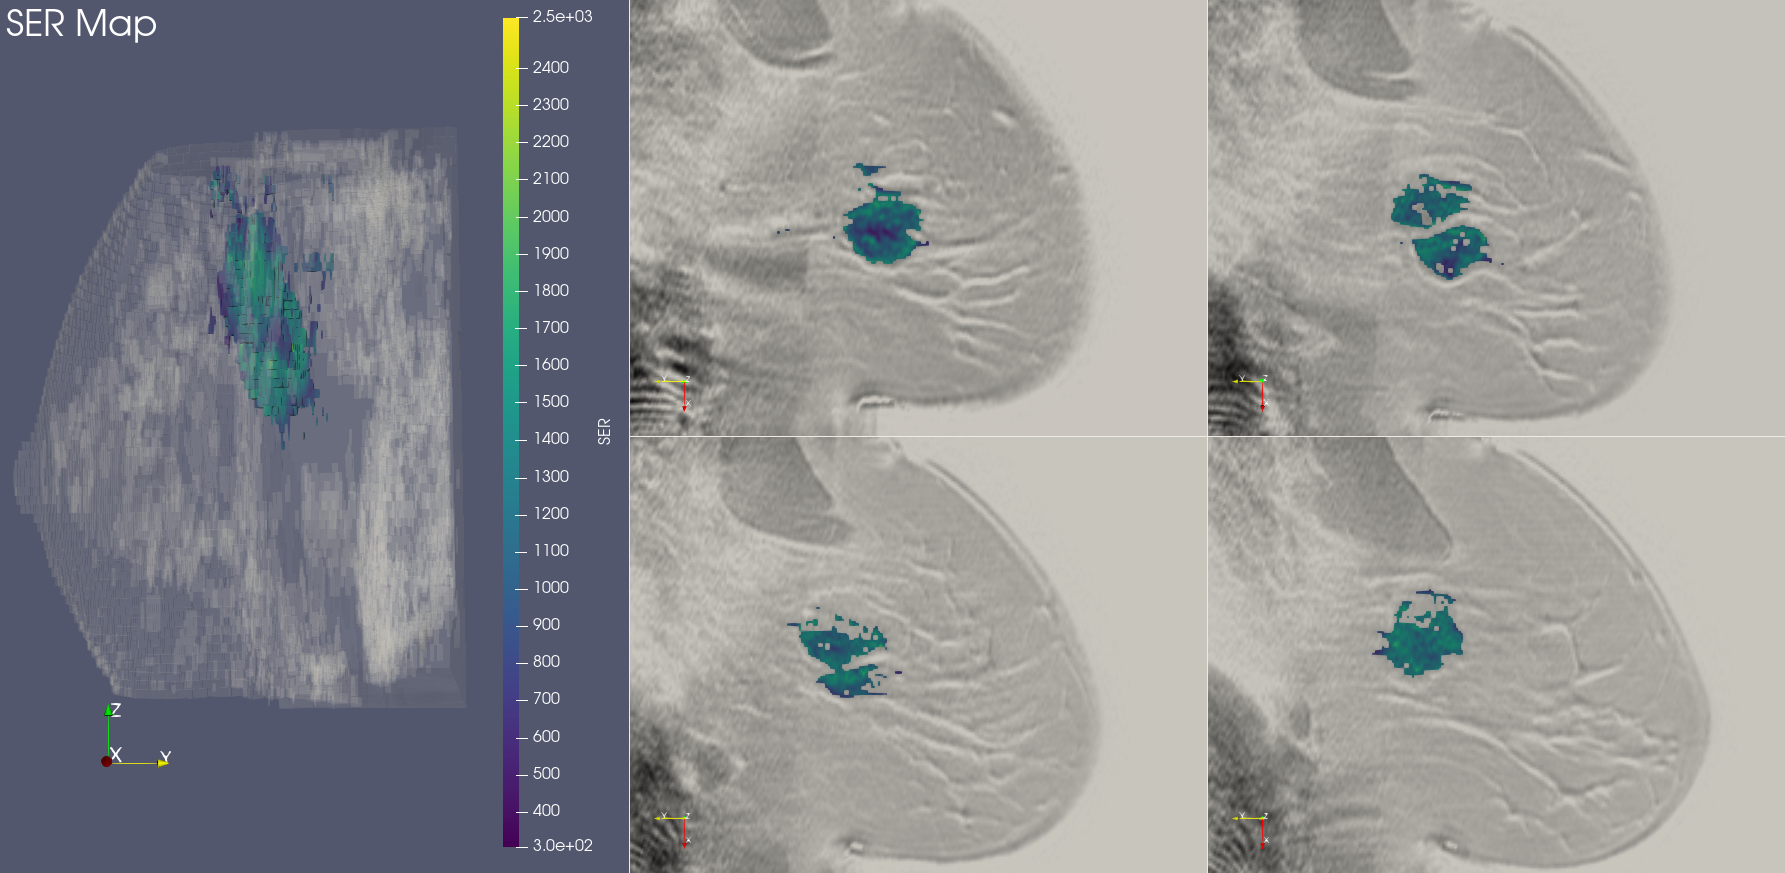
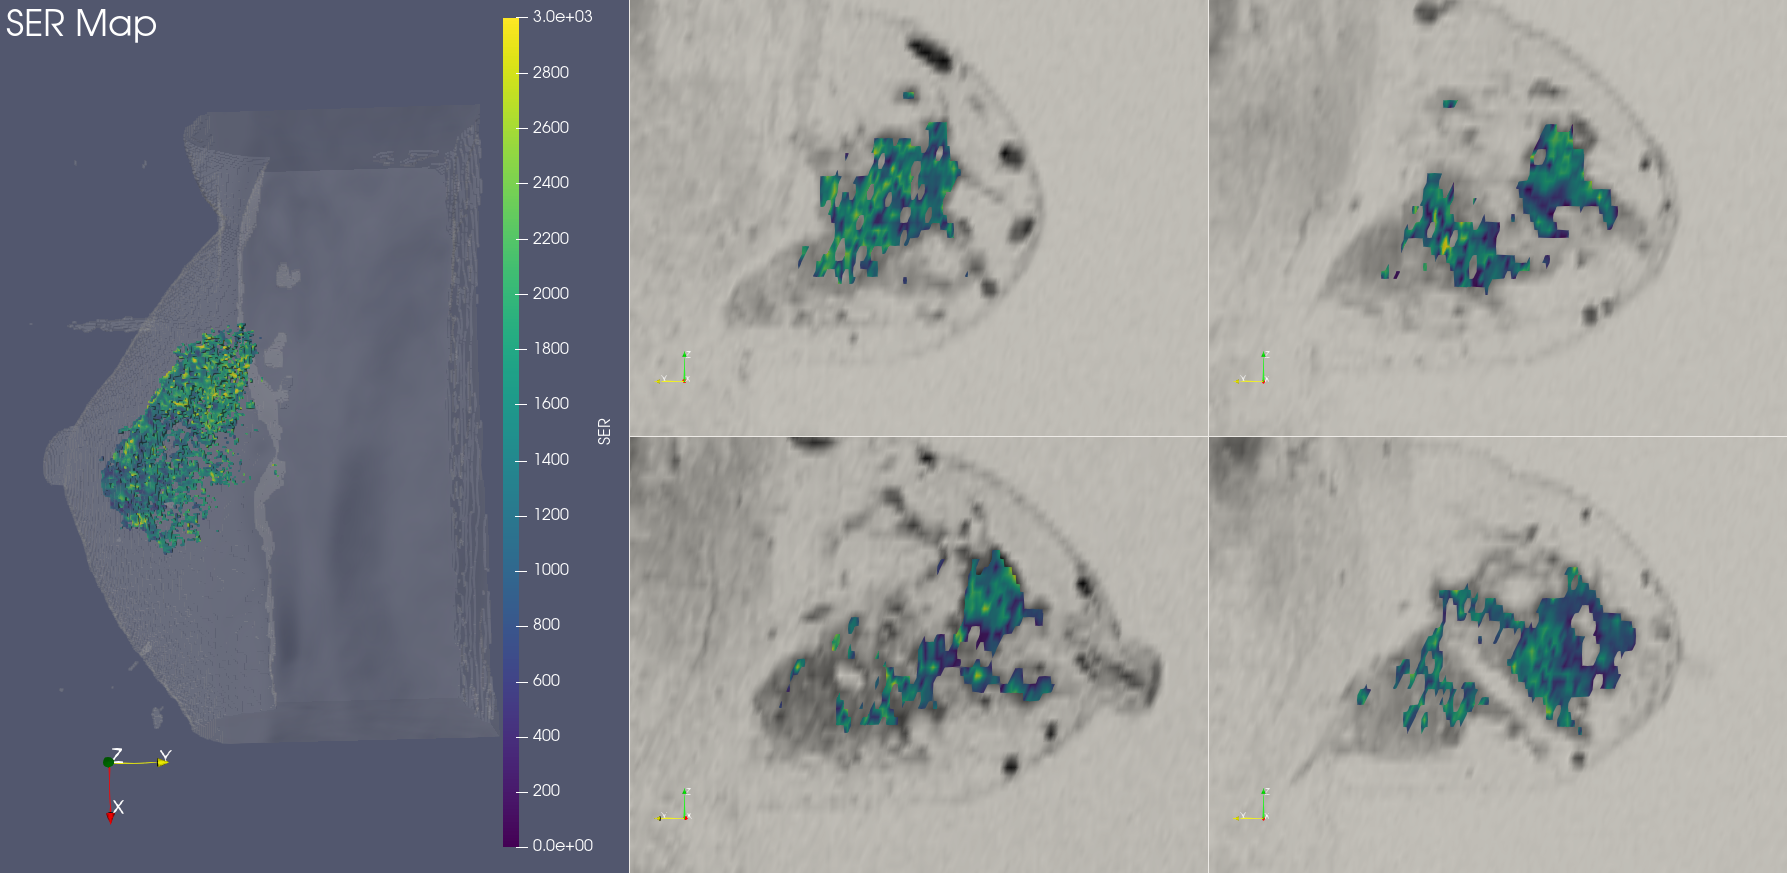
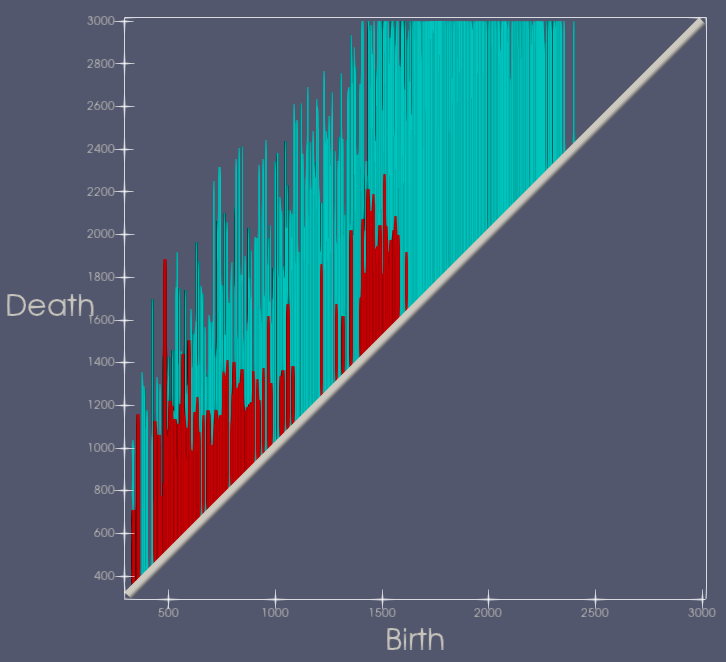
ISPY-110 BC NAC trial data sets from 103 women were downloaded from The Cancer Imaging Archive (https://wiki.cancerimagingarchive.net/display/Public/ISPY1). For this preliminary study of early prediction of pCR, only the pre-NAC (T0) DCE-MRI data were used for analysis. The BC tumor region was defined as the voxels with contrast percent enhancement (PE) >0.7 and the FTV was calculated based on the number of these voxels8-9. The voxel-based signal enhancement ratio (SER) maps8-9 were generated for tumor regions as defined above. The longest diameter (LD)8 of the tumor was measured according to the RECIST criteria11 used in standard of care. Figure 1 shows 3D and 2D views of color SER maps of a tumor that achieved pCR and Figure 2 shows the same for a tumor that was non-pCR following NAC.TDA, a recent innovation, has shown promise in cancer and medical imaging research12-15. We performed TDA analysis of the T0 tumor SER maps by applying a series of filters (from 0 to the maximum SER value in the tumor volume) to the PE-based segmented tumor volumes. Features, defined as connected voxels, holes (in all 2D tumor containing slices), and voids (in the volume), were counted at each filter value and plotted in a persistence diagram (Figure 3). The x-axis represents the “birth” value, the SER threshold for which the feature is first seen; the y-axis represents the “death” threshold value for which the feature merges with another feature or is filtered out. SER maps were utilized for TDA analysis because, unlike FTV and LD, they capture intra-tumoral heterogeneity in contrast kinetics16-18. Heterogenous SER features would appear as persistent features that survive many contiguous filter values. The topological bottleneck distance19 between patients was computed by measuring the distance between patients’ persistence diagrams, and the distances were used to build a distance matrix for all the patient data sets.
Hierarchical Agglomerative Clustering with complete linkages20 was applied to the topological distance matrix to group patients with similar topologies into distinct topological classes, or equivalently, topological clusters. Logistic regression was applied to the patient’s assigned topological class to predict pCR along with clinical and histopathological variables (including age and molecular receptor status). The receiver operating characteristic area under the curve (ROC AUC) was applied to evaluate the predictive capacity of the models. Using DeLong’s test, the AUC of the logistic model with TDA metrics was compared to the models where the TDA metrics were replaced by LD and FTV, respectively, as well as the model that included all three MRI metrics.
Results
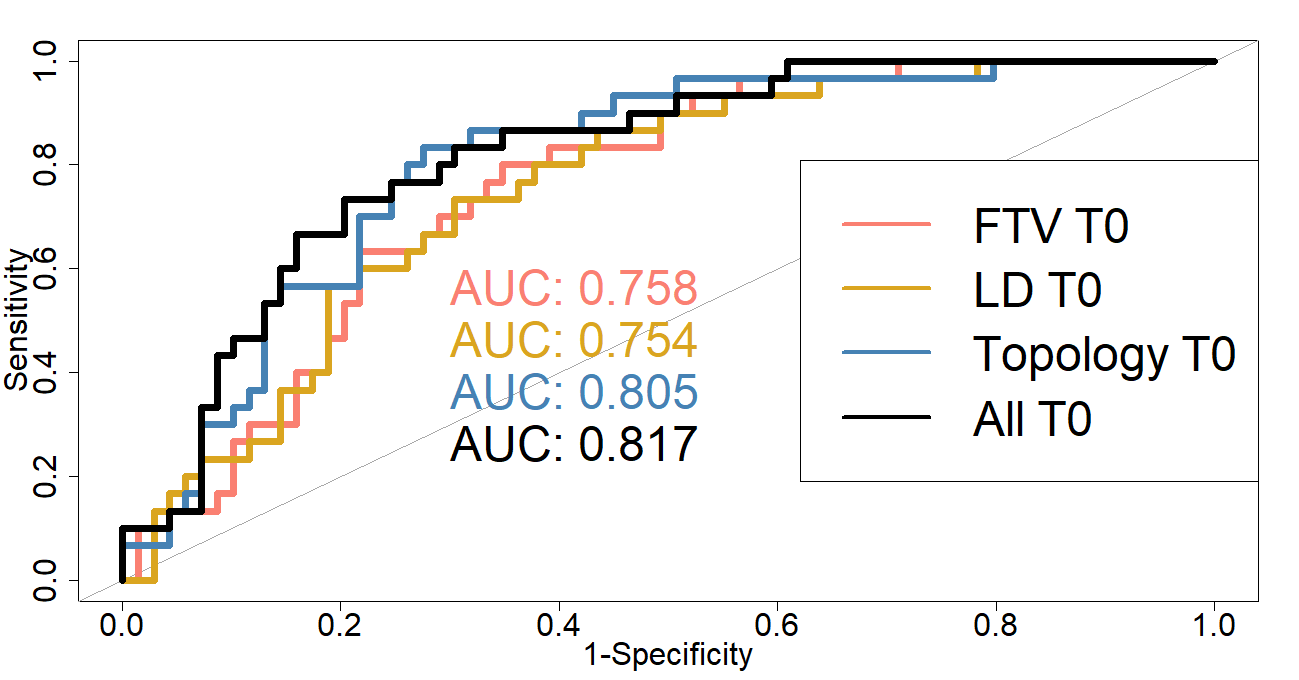
We computed 5202 topological distances to construct a distance matrix for all patients. We resolved 8 distinct topological classes and applied logistic regression to determine the relationship between assigned topology class and pCR or non-pCR status. The estimated AUCs for the logistic regression models are given in Figure 4. The predictive performance of the model with topology metrics were superior to those of the models with LD (P = 0.055 in comparing AUC) and FTV (P = 0.11), although not statistically significant. The model that included all MRI variables showed more accurate prediction of pCR than those with a single MRI variable: LD (P = 0.086), FTV (P = 0.04), and topology (P = 0.71), with a statistically significant difference in AUC in comparison with FTV.Discussion
Our preliminary results from T0 (pre-NAC) DCE-MRI data suggest that TDA analysis of contrast kinetics heterogeneity is a promising image analysis method for early prediction of BC response to NAC, and is potentially a more accurate approach than the established FTV and LD methods. This is a work-in-progress study. Future analysis will include DCE-MRI data acquired following the first NAC cycle and computed differences in topology between the two time points, which may further improve the predictive performance. Furthermore, to improve the rigor of our study, we will implement repeated k-fold cross validation in data analysis to eliminate bias in our model, and test our model using third-party independent data sets.Acknowledgements
Grant support: NIH R01 CA248192, Medical Research Foundation of Oregon.References
[1] von Minckwitz G, Untch M, Blohmer JU, Costa SD, Eidtmann H, Fasching PA, et al. Definition and impact of pathologic complete response on prognosis after neoadjuvant chemotherapy in various intrinsic breast cancer subtypes. J Clin Oncol 2012;30:1796-1804.
[2] Kong X, Moran MS, Zhang N, Haffty B, Yang Q. Meta-analysis confirms achieving pathological complete response after neoadjuvant chemotherapy predicts favorable prognosis for breast cancer patients. Eur J Cancer 2011;47:2084-2090.
[3] Bonnefoi H, Litiere S, Piccart M, MacGrogan G, Fumoleau P, Brain E, et al. Pathological complete response after neoadjuvant chemotherapy is an independent predictive factor irrespective of simplified breast cancer intrinsic subtypes: a landmark and two-step approach analyses from the EORTC 10994/BIG 1-00 phase III trial. Ann Oncol 2014;25:1128-1136.
[4] Zambetti M, Mansutti M, Gomez P, Lluch A, Dittrich C, Zamagni C, et al. Pathological complete response rates following different neoadjuvant chemotherapy regimens for operable breast cancer according to ER status, in two parallel, randomized phase II trials with an adaptive study design (ECTO II). Breast Cancer Res Treat 2012;132:843-851.
[5] Wasserman, Larry. "Topological data analysis." Annual Review of Statistics and Its Application 5 (2018): 501-532.
[6] Wright, Matthew. (2015, July 3). Introduction to Persistent Homology [Video]. YouTube. https://www.youtube.com/watch?v=h0bnG1Wavag.
[7] Zomorodian, Afra, and Gunnar Carlsson. "Computing persistent homology." Discrete & Computational Geometry 33.2 (2005): 249-274.
[8] Hylton, Nola M., et al. "Locally advanced breast cancer: MR imaging for prediction of response to neoadjuvant chemotherapy—results from ACRIN 6657/I-SPY TRIAL." Radiology 263.3 (2012): 663-672.
[9] Hylton, Nola M., et al. "Neoadjuvant chemotherapy for breast cancer: functional tumor volume by MR imaging predicts recurrence-free survival—results from the ACRIN 6657/CALGB 150007 I-SPY 1 TRIAL." Radiology 279.1 (2016): 44-55.
[10] David Newitt, Nola Hylton, on behalf of the I-SPY 1 Network and ACRIN 6657 Trial Team. (2016). Multi-center breast DCE-MRI data and segmentations from patients in the I-SPY 1/ACRIN 6657 trials. The Cancer Imaging Archive. https://doi.org/10.7937/K9/TCIA.2016.HdHpgJLK
[11] Schwartz LH, et al. RECIST 1.1-Update and clarification: from the RECIST committee. Eur. J. Cancer. 2016;62:132–7. doi: 10.1016/j.ejca.2016.03.081.
[12] Adcock, Aaron, Daniel Rubin, and Gunnar Carlsson. "Classification of hepatic lesions using the matching metric." Computer Vision and Image Understanding 121 (2014): 36-42.
[13] Crawford, Lorin, Monod, Anthea, Chen, Andrew X, Mukherjee, Sayan, and Rabadán, Raúl. "Predicting Clinical Outcomes in Glioblastoma: An Application of Topological and Functional Data Analysis." Journal of the American Statistical Association 115.531 (2019): 1-12.
[14] Ninomiya, Kenta, and Hidetaka Arimura. "Homological radiomics analysis for prognostic prediction in lung cancer patients." Physica Medica 69 (2020): 90-100.
[15] Oyama, Asuka, Hiraoka, Yasuaki, Obayashi, Ippei, Saikawa, Yusuke, Furui, Shigeru, Shiraishi, Kenshiro, Kumagai, Shinobu, Hayashi, Tatsuya, and Kotoku, Jun'ichi. "Hepatic Tumor Classification Using Texture and Topology Analysis of Non-contrast-enhanced Three-dimensional T1-weighted MR Images with a Radiomics Approach." Scientific Reports 9.1 (2019): 8764-10.
[16] Jahani, Nariman et al. “Prediction of Treatment Response to Neoadjuvant Chemotherapy for Breast Cancer via Early Changes in Tumor Heterogeneity Captured by DCE-MRI Registration.” Scientific reports vol. 9,1 12114. 20 Aug. 2019, doi:10.1038/s41598-019-48465-x
[17] Jones EF, Hathi DK, Freimanis R, Mukhtar RA, Chien AJ, Esserman LJ, Van't Veer LJ, Joe BN, Hylton NM. Current Landscape of Breast Cancer Imaging and Potential Quantitative Imaging Markers of Response in ER-Positive Breast Cancers Treated with Neoadjuvant Therapy. Cancers (Basel). 2020 Jun 9;12(6):1511. doi: 10.3390/cancers12061511. PMID: 32527022; PMCID: PMC7352259.
[18] Thibault G, Tudorica A, Afzal A, Chui SY, Naik A, Troxell ML, Kemmer KA, Oh KY, Roy N, Jafarian N, Holtorf ML, Huang W, Song X. DCE-MRI Texture Features for Early Prediction of Breast Cancer Therapy Response. Tomography. 2017 Mar;3(1):23-32. doi: 10.18383/j.tom.2016.00241. PMID: 28691102; PMCID: PMC5500247.
[19] Chazal, Frédéric, and Bertrand Michel. "An Introduction to Topological Data Analysis: fundamental and practical aspects for data scientists." arXiv preprint arXiv:1710.04019 (2017).
[20] Kaufman, Leonard., and Rousseeuw, Peter J. Finding Groups in Data : an Introduction to Cluster Analysis. Wiley, 1990.
Figures