1437
Feasibility of quantitative and volumetric enhancement measurement to assess tumor response in patients with breast cancer after early NAC1Medical Imaging Center, People's Hospital of Ningxia Hui Autonomous Region, Yinchuan, China, 2Philips Healthcare, Shanghai, China, 3Philips Healthcare, Beijing, China
Synopsis
The accuracy of early efficacy evaluation of neoadjuvant chemotherapy for breast cancer is important for clinicians to choose chemotherapy regimen.
75 lesions were assessed according to the ELV method in comparison with RECIST1.1 and TLV. In terms of predicting pathological response, the diagnostic accuracy of the three methods were analyzed and compared by receiver operating characteristic (ROC) curve analysis.
It is feasible for ELV in evaluating the responsiveness of breast cancer patients to early NAC on DCE-MRI images. Referring to the prediction the pathological response, ELV had the best diagnostic performance with highest sensitivity, accuracy, as well as AUC value.
Introduction
Breast cancer is the most common cancer in women worldwide and often has poor prognosis.[1] Clinical experience and some relevant studies have shown that the evaluation results of tumor treatment response after early N-Acetylcysteine (NAC) for breast cancer patients, may directly affect the selection of treatment methods and chemotherapy regimens by clinicians, so accurate response evaluation after early NAC is of great importance. [2]In addition, anatomy-based methods often do not show treatment-induced intertumoral viability changes in response to NAC. Anatomical imaging may be limited in distinguishing viable residual tumor tissue from reactive changes, such as scar tissue and edema.The purpose of this study was to assess the feasibility of applying an enhancement-based method, enhancing lesion volume (ELV), in assessing the tumor therapy response after early NAC in patients with breast cancer on DCE-MRI images, compared to currently existing anatomy-based methods, RECIST1.1 and total lesion volume (TLV).
Methods
Seventy-five female patients with breast cancer received DCE-MRI scans using a 3.0 T MRI scanner (Ingenia, Philips Healthcare, the Netherlands) and another 3.0T MRI scanner (Signa HDXT, General Electric Healthcare, USA) at baseline (before NAC) and early follow-up visit (4–6 weeks after receiving NAC). A total of 75 lesions were assessed according to the ELV method in comparison with RECIST1.1 and TLV. The tumor therapy response results were recorded and compared among the three methods. Cases with complete or partial response (CR, PR) were classified as responders. Cases with stable disease (SD) or progressive disease (PD) were considered as non-responders. Cases with pathological grading of Grade1-3 based on Miller-Payne (MP) system were considered as non-responders, and Grade 4-5 as responders. [3]In terms of predicting pathological response, the diagnostic performance of the three methods were compared. The diagnostic accuracy of the three methods were analyzed and compared by receiver operating characteristic (ROC) curve analysis. Besides, color maps were generated and compared with pathological results.Results
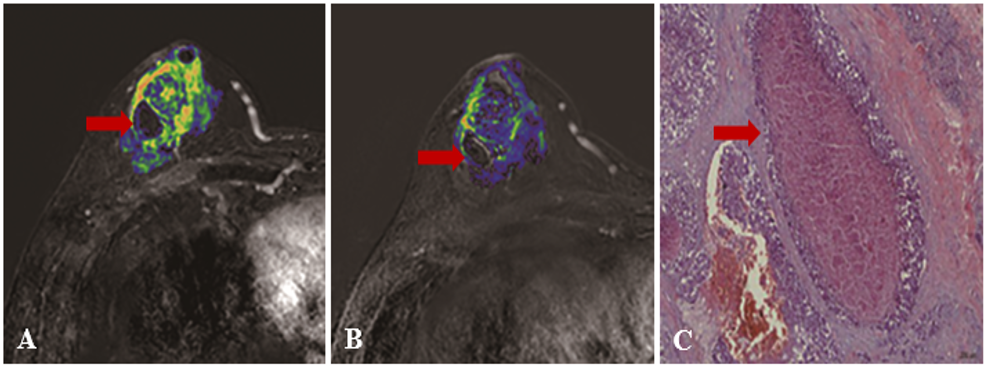
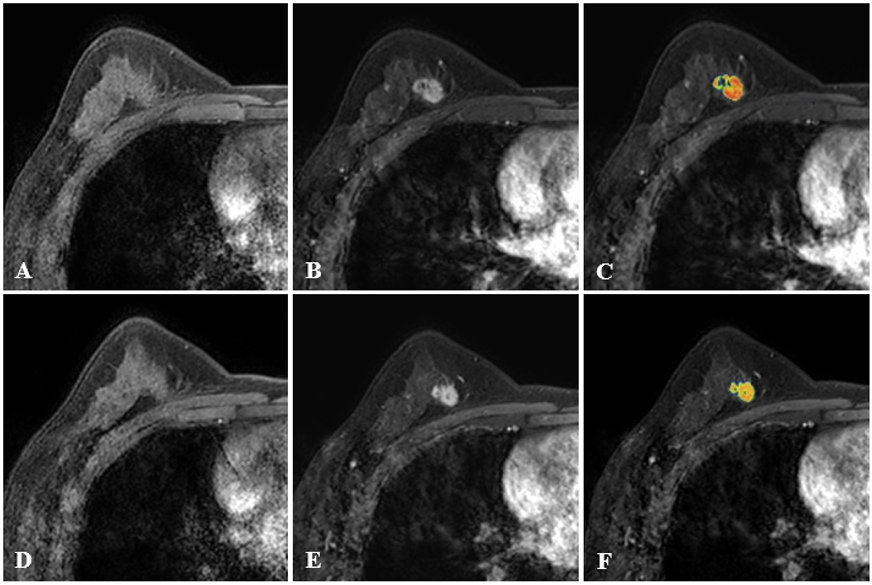
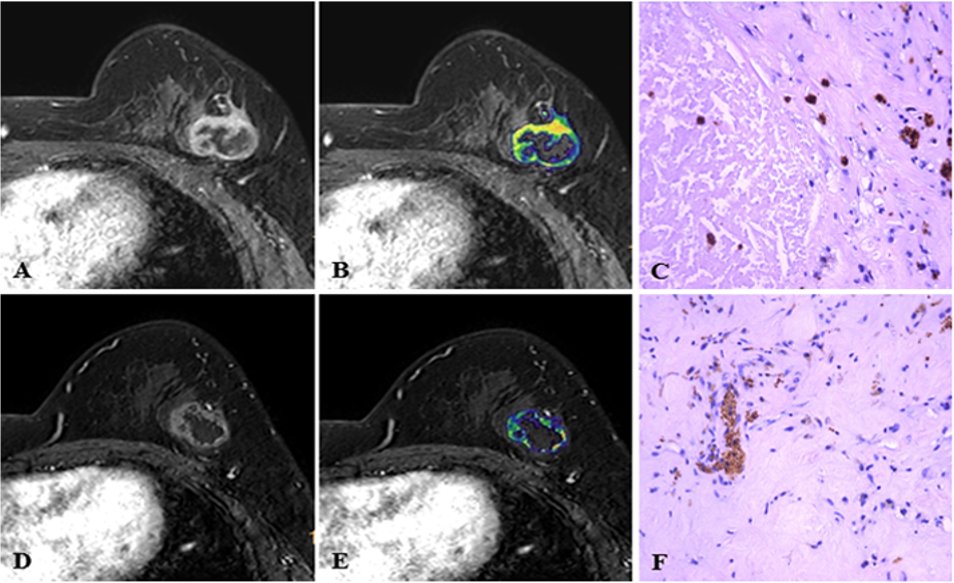
According to the ELV method, 29%, 67% and 4% of cases indicated PR, SD and PD, respectively. There was no statistical difference on the evaluation results among the three methods (P=0.64), as well as pairwise comparison (all P≥0.05). The consistency between ELV and TVL was highest with Kappa value of 0.83. Regarding to predict pathologic response, the sensitivity, specificity, positive predictive value (PPV), the negative predictive value (NPV) and accuracy of the ELV method were 72%, 92%, 81.8%, 86.8% and 85.3%, respectively. All values were shown in Table 1. Among the diagnostic performances of the three methods, ELV had the highest sensitivity, NPV and accuracy. The ROC curves analysis showed that the area under ROC curve (AUC) was highest for ELV, with sensitivity of 72% and specificity of 92%. The color maps generated from pre- and post-NAC treatment reflected the tumor activities and were consistent with pathological necrosis.Discussion
According to the ROC analysis, ELV had the highest sensitivity and equal specificity compared with TLV and RECIST1.1. [4]ELV takes into account not only the morphological changes in tumor size, but also the changes in cell activity inside the tumor. Therefore, it could be a promising tool to evaluate tumor therapy response.There were no statistical difference on the tumor therapy response evaluation for breast cancer patients after receiving early NAC via ELV, TLV and RECIST1.1 criterion. Thus, it is feasible for ELV in evaluating the responsiveness of breast cancer patients to early NAC on DCE-MRI images.
Besides, color maps were generated and compared with pathological results.
Conclusion
Our data suggested that it is feasible for ELV in evaluating the responsiveness of breast cancer patients to early NAC on DCE-MRI images, and it may be a better tumor response indicator for its ability to present tumor viability.Acknowledgements
None.References
1.Jemal A, Bray F, Center MM, Ferlay J, Ward E, Forman D.Global cancer statistics. CA Cancer J Clin 2011; 61(2):69–90.
2. Li T, Mello-Thoms C, Brennan PC. Descriptive epidemiology of breast cancer in China: incidence, mortality, survival and prevalence. Breast Cancer Res Treat. 2016; 159(3):395-406.
3.Kitajima K,Miyoshi Y,Yamano T,Odawara S, Higuchi T, Yamakado K.Assessment of tumor response to neoadjuvant chemotherapy in patients with breast cancer using MRI and FDG-PET/CT-RECIST 1.1 vs. PERCIST 1.0.Nagoya J Med Sci. 2018; 80(2):183-197.
4. Chapiro J, Wood LD, Lin M, et al. Radiologic-pathologic analysis of contrast-enhanced and diffusion-weighted MR imaging in patients with HCC after TACE: diagnostic accuracy of 3D quantitative image analysis. Radiology 2014; 273(3):746-58.
Figures
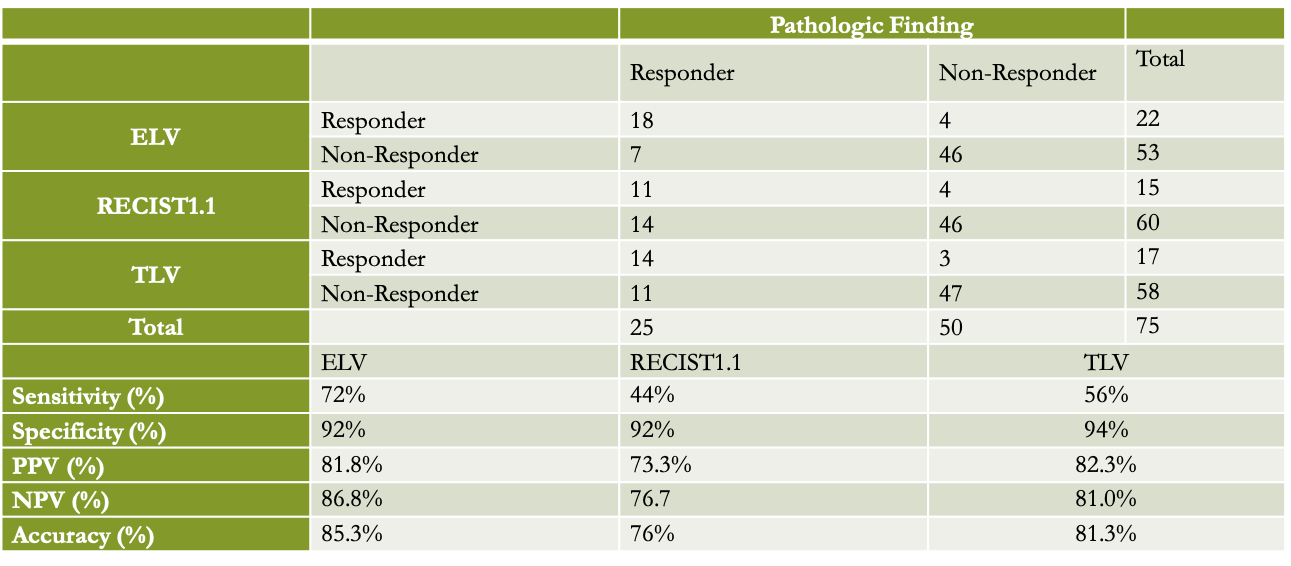
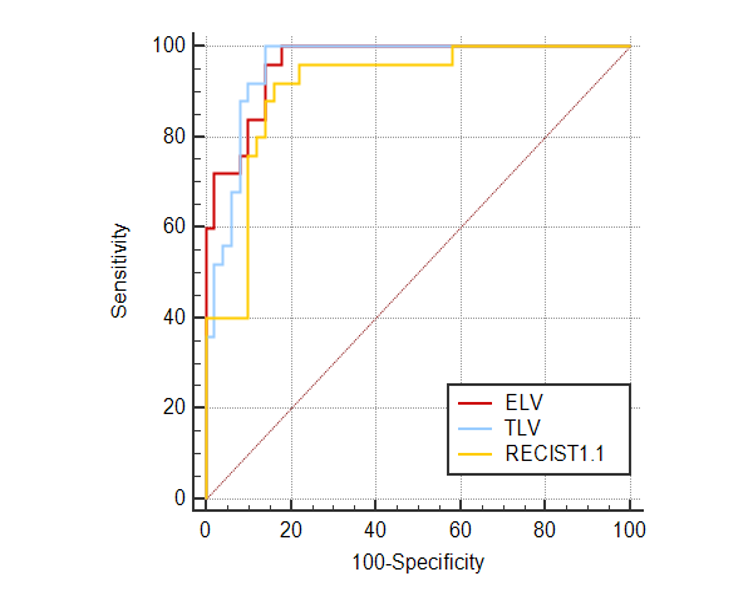
Figure 1. ROC curve analysis of the three methods
The AUCs of ELV, TLV and REICST were 0.962 (95%CI: 0.891-0.993), 0.957 (95%CI:0.883-0.990) and 0.910 (95%CI: 0.821-0.964), respectively. The post-hoc pairwise comparison results of ROC curves were: ELV versus RECIST1.1(z=1.672, P=0.09); ELV versus TLV (z=0.273, P=0.78); TLV versus RECIST1.1 (z=1.293, P=0.19).