1435
Associations of pretreatment MRI with pathologic assessment of immune infiltration and chemotherapy response in triple negative breast cancer
Anum S. Kazerouni1, Laura C. Kennedy2, Michael Hirano1, Daniel S. Hippe1, Bonny Chau1, Debosmita Biswas1, Wesley Surento1, Shaveta Vinayak1, Matthew Nyflot1, Habib Rahbar1, Suzanne Dintzis1, and Savannah C. Partridge1
1University of Washington, Seattle, WA, United States, 2Vanderbilt University, Nashville, TN, United States
1University of Washington, Seattle, WA, United States, 2Vanderbilt University, Nashville, TN, United States
Synopsis
We investigated the relationship between immune infiltration and imaging metrics derived from breast MRI in patients with triple negative breast cancer (TNBC) treated with neoadjuvant chemotherapy (NAC). Thirty-six patients with localized TNBC were imaged with diffusion-weighted and dynamic contrast-enhanced MRI prior to initiation of NAC. Baseline tumor infiltrating lymphocytes (TILs) and functional tumor volume were found to significantly differ between patients who achieved pathological complete response (pCR) compared to non-pCR patients. Baseline ADC showed a weak negative correlation with TIL counts.
Introduction
Triple negative breast cancer (TNBC) is an aggressive subtype of breast cancer associated with poorer patient prognosis and decreased overall survival compared to non-TNBC subtypes.1 TNBC patients with locally advanced disease are typically treated with neoadjuvant chemotherapy (NAC). However, there is variable response to NAC, with 27-51% of patients achieving a pathological complete response (pCR).2,3 Recent research has shown that patients with increased immune infiltration prior to the initiation of NAC have improved response and disease-free survival.4 However, current methods to measure immune infiltration, such as biopsies, are invasive and susceptible to sampling error. Multiparametric MRI of the breast enables noninvasive 3D measurement of tumor microenvironment characteristics across a tumor volume. We hypothesize that MRI features may correlate with tumor immune infiltration and serve as an early predictor of NAC response to aid in personalizing therapy.Methods
Subjects and pathologyWomen with locally advanced TNBC who underwent diagnostic biopsy, pre-treatment clinical breast MRI, and NAC at our institution (from 2005-2019) were retrospectively identified for this study. Response to NAC was determined by pathology at surgery and pCR was defined as no residual invasive cancer present within the breast. Diagnostic core needle biopsies acquired prior to NAC were used to quantify tumor infiltrating lymphocytes (TILs) at baseline. Levels of TILs infiltration were assessed by a breast pathologist from H&E stained slides and quantified as deciles from 10-100%.
MRI acquisition and analysis
Patients were scanned prior to initiation of NAC on either a 1.5T (LX, GE) or 3T (Achieva, Philips Healthcare) clinical scanner with a dedicated breast coil. Diffusion-weighted (DW-) MRI was acquired with a single shot echo-planar imaging sequence, using b-values=0 and 600 s/mm2 (at 1.5T, 2004-2009) or 800 s/mm2 (at 3T, 2010–present). DCE-MRI data was acquired with a fat suppressed, 3D fast gradient echo sequence with one pre-contrast and at least three post-contrast acquisitions centered at 2, 5, and 8 minutes after gadolinium-based contrast injection (0.1mmol/kg-body-weight delivered at 2cc/sec followed by a 15cc saline flush).
Apparent diffusion coefficient (ADC) maps were calculated using a mono-exponential fit to DW-MRI data. Referencing contrast-enhanced MRI for lesion localization, tumor regions-of-interests (ROIs) were manually segmented across all lesion-bearing slices using the b=600 or 800 s/mm2 image and applied to corresponding ADC maps. Further exclusion of non-tumor voxels (e.g., adipose or fibroglandular tissue) was achieved using an interactive thresholding tool based on low b=800 signal.5 For each tumor, the mean ADC was calculated for a representative 2D slice.
DCE-MRI series were first registered using CADstream software (Merge Healthcare, Chicago, IL) to correct for patient motion between pre-and post-contrast scans. Contrast kinetics were calculated using custom software developed in ImageJ6 providing voxel-wise measures of percent enhancement (PE) at 2 minutes post-contrast and signal enhancement ratio (SER). Tumors were segmented in 3D based on signal enhancement criteria (≥50% increase in signal intensity at 2 minutes post-contrast). Peak PE (%) and peak SER were calculated (representing the highest mean PE and SER, respectively, for 3×3 voxel subregions). Additionally, the functional tumor volume (FTV, cm3), i.e., the total number of tumor voxels with PE≥50%, and wash out fraction (WF), i.e., the percentage of total tumor voxels with SER≥1.1, were calculated for each tumor.
Statistical analyses
Wilcoxon rank sum test was used to compare TIL counts and imaging features between pCR and non-pCR patient groups. Spearman’s rank correlation was coefficient (𝜌) was calculated to assess associations between imaging metrics and TILs counts. Significant (p<0.05) predictors from univariate analyses were included in a multivariable logistic regression model to predict pathological response. Receiver operating characteristic curve analysis was performed to calculate areas under the curve (AUCs).
Results
Thirty-six women with TNBC were retrospectively identified and evaluated for this study (median age: 53, range 26-79 years), of which 16 (44%) achieved pCR. DW-MRI was not performed in clinical MRI exams for 5 women. Baseline TILs ranged from 10% to 80% (median TILs: 10%) and were significantly higher in patients who achieved pCR (median: 20%, IQR: 25%) compared to non-pCR patients (median: 10%, IQR: 0%, p=0.02, Table 1). Of the imaging metrics, only FTV demonstrated significant association with pathologic outcome, with lower baseline FTV in patients who achieved pCR (median: 9.7 cm3, IQR: 8.4 cm3) versus those with non-pCR (median: 21.9 cm3, IQR: 40.2 cm3, p=0.02). Mean ADC showed a weak negative correlation with TIL count (𝜌=-0.34, p=0.06). No other significant correlations were observed between imaging metrics and TIL counts. A multivariable model including FTV and TILs showed an improved AUC=0.84, compared to FTV (AUC=0.73) or TILs (AUC=0.69) alone (Figure 1).Discussion and Conclusion
Preliminary results suggest that tumor ADC derived from DW-MRI may indicate reduced diffusivity due to increased immune infiltration in patients with TNBC. Additionally, we found significant differences in FTV for pCR vs. non-pCR patients, which supports previous studies.7 Multivariable analysis of FTV and immune infiltration improved prediction of pCR. These early predictors of NAC response may provide an opportunity to guide NAC regimens for improved patient outcomes and reduction of unnecessary toxicities. Future work will extend analyses to a larger patient cohort and evaluate the utility of ADC, FTV and other imaging metrics as predictive markers in women with TNBC undergoing novel immunotherapy-supplemented NAC regimens.Acknowledgements
Supported by NIH grants P30CA015704, R01CA248192, and Roger E. Moe Fellowship (LCK), ASCO/CCF Hayden Family Foundation Young Investigator Award in Breast Cancer (LCK)References
- Liedtke, C. et al. Response to Neoadjuvant Therapy and Long-Term Survival in Patients With Triple-Negative Breast Cancer. JCO 26, 1275–1281 (2008).
- Golshan, M. et al. Breast Conservation After Neoadjuvant Chemotherapy for Triple-Negative Breast Cancer: Surgical Results From the BrighTNess Randomized Clinical Trial. JAMA Surg 155, e195410 (2020).
- von Minckwitz, G. et al. Definition and Impact of Pathologic Complete Response on Prognosis After Neoadjuvant Chemotherapy in Various Intrinsic Breast Cancer Subtypes. Journal of Clinical Oncology 30, 1796–1804 (2012).
- Gao, Z., Li, C., Liu, M. & Jiang, J. Predictive and prognostic role of tumour-infiltrating lymphocytes in breast cancer patients with different molecular subtypes: a meta-analysis. BMC Cancer 20, 1150 (2020).
- Rahbar, H. et al. Diffusion-Weighted Breast Magnetic Resonance Imaging: A Semiautomated Voxel Selection Technique Improves Interreader Reproducibility of Apparent Diffusion Coefficient Measurements. J Comput Assist Tomogr 40, 428–435 (2016).
- Partridge, S. C. et al. Association between serial dynamic contrast-enhanced MRI and dynamic 18F-FDG PET measures in patients undergoing neoadjuvant chemotherapy for locally advanced breast cancer. Journal of Magnetic Resonance Imaging 32, 1124–1131 (2010).
- Hylton, N. M. et al. Neoadjuvant Chemotherapy for Breast Cancer: Functional Tumor Volume by MR Imaging Predicts Recurrence-free Survival—Results from the ACRIN 6657/CALGB 150007 I-SPY 1 TRIAL. Radiology 279, 44–55 (2015).
Figures
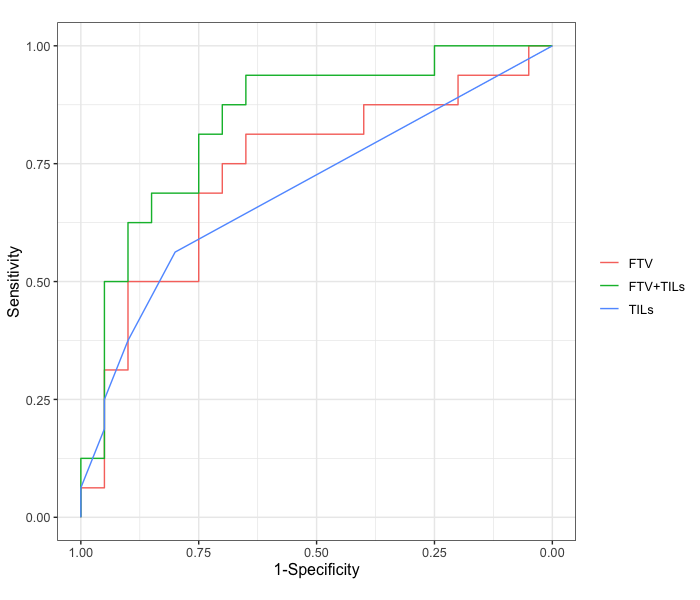
Figure 1. Receiver operating characteristic (ROC) curve analysis of imaging metrics and TILs for the prediction of pathological response. Shown are ROC curves for functional tumor volume (FTV, red, AUC=0.73), TILs (blue, AUC=0.69), and a multivariable model of FTV and TILs (green, AUC=0.84).
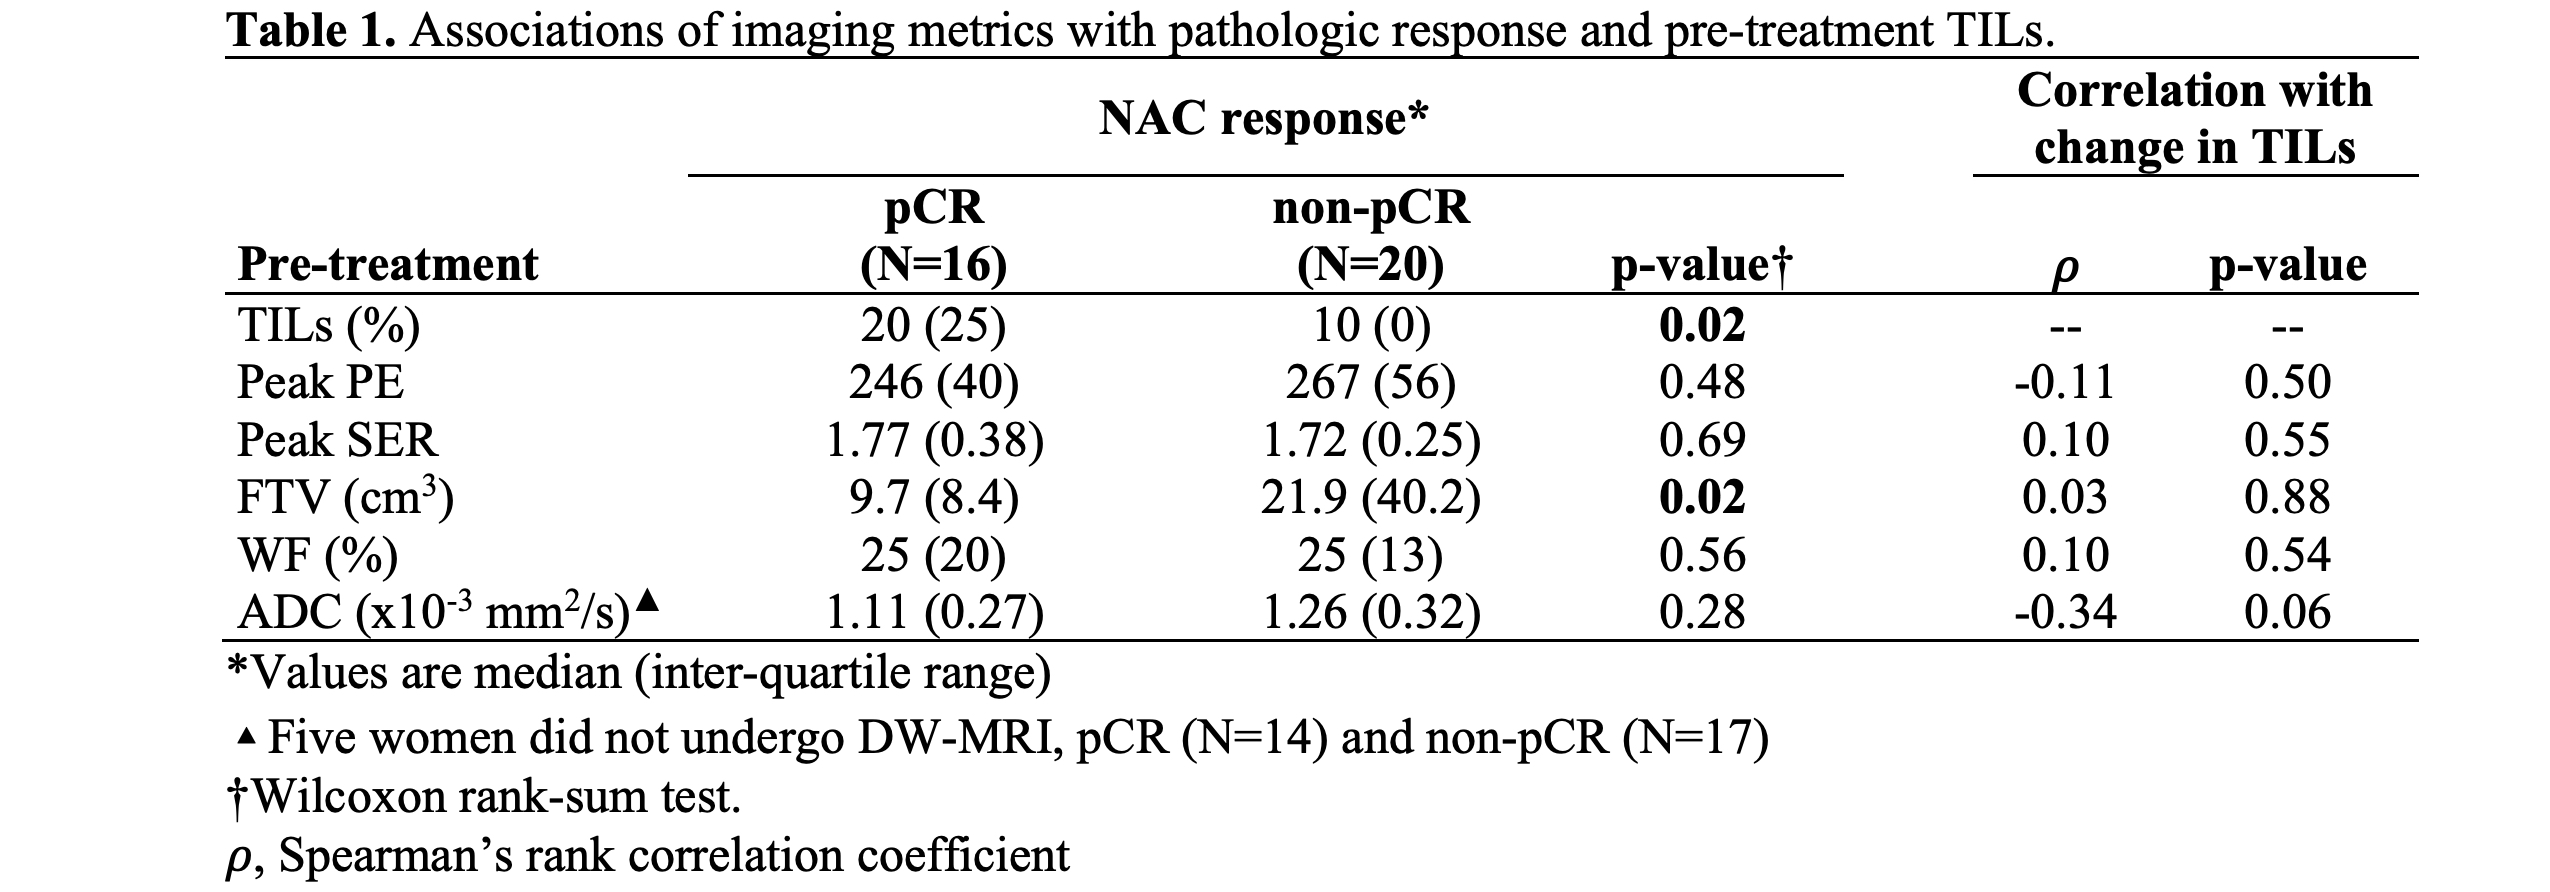
Table 1. Associations of imaging metrics with pathologic response and pre-treatment TILs.