1434
Three-component diffusion model with deformable registration for automated evaluation of response to neoadjuvant therapy in breast cancer1Department of Circulation and Medical Imaging, Norwegian University of Science and Technology, Trondheim, Norway, 2Department of Radiology, University of California San Diego, La Jolla, CA, United States, 3Department of Pathology, University of California San Diego, La Jolla, CA, United States, 4Department of Bioengineering, University of California San Diego, La Jolla, CA, United States, 5Department of Radiation Medicine and Applied Sciences, University of California San Diego, La Jolla, CA, United States, 6Department of Physics, Norwegian University of Science and Technology, Trondheim, Norway, 7Department of Radiology and Nuclear Medicine, Norwegian University of Science and Technology, Trondheim, Norway, 8Department of Neuroscience, University of California San Diego, La Jolla, CA, United States
Synopsis
The purpose of this work was to develop a method to automatically monitor response to neoadjuvant treatment in breast cancer using longitudinally registered multi-b diffusion MRI acquisitions. The two slowest diffusion signal contributions from a three-component model were used to generate cancer probability maps (C1C2 classifier) that estimated tumor volume at each timepoint. Our results demonstrated that changes in C1C2 classifier agreed with standard dynamic-contrast-enhanced MRI criteria (RECIST) in 23 out of 24 cases. In 35% of treatment responders, the C1C2 classifier captured response at an earlier timepoint than RECIST.
Introduction
Change in tumor size on dynamic contrast-enhanced MRI (DCE), assessed by RECIST1, is the current gold standard for neoadjuvant treatment response assessment in breast cancer. However, changes in size may take several weeks as measured by DCE, potentially delaying clinical decision-making. Diffusion-weighted MRI (DWI) is an alternative modality that is sensitive to early treatment induced changes such decrease in viable tumor cells as a result of loss of cell membrane integrity2. Nevertheless, conventional DWI metrics rely on lesions being pre-defined, a challenge for practical utility. This abstract details initial evaluation of automatic assessment of response to neoadjuvant therapy by longitudinally registered cancer probability maps derived from a three-component diffusion model. The three-component model is an advanced DWI model that has demonstrated excellent ability to discriminate between cancer and healthy breast tissue3. We hypothesize that cancer probability maps are more sensitive to response at an early timepoint, compared to standard DCE-MRI criteria (RECIST).Materials and methods
Twenty-four patients (median age 49 years, range 20-68) with biopsy-proven invasive breast cancer ≥2.5cm (defined on imaging/clinical examination) underwent multi-parametric 3T MRI (MR750, DV25-26, GE Healthcare, Milwaukee, U.S.) at four timepoints to evaluate response to treatment: pre-treatment (n=24), early-treatment (3 weeks, n=20), mid-treatment (12 weeks, n=21) and post-treatment (n=24). The therapy used was primarily paclitaxel (+/-experimental agent) followed by anthracycline. The MRI protocol included Gadolinium DCE, non-fat-saturated T1 and and multi-b-value DWI acquisition (b-values 0, 500, 1500, 4000 s/mm2 in 6, 6, and 15 directions); TE/TR=82/9000 ms, FOV=160x320 mm2, axial plane.DWI data were averaged across diffusion directions for each b-value; corrected for eddy current artifacts, motion4 and geometric distortion5; and resampled to DCE-space. At the pre-treatment timepoint, cancer ROIs were drawn for the site of cancer (Figures 3-5) and validated by a breast radiologist. Control ROIs were generated to include surrounding healthy tissue by 25 mm uniform expansion of the cancer ROI, then excluding any tissue within 5 mm of the cancer ROI. A non-rigid deformable registration technique (FLIRE)6 was used to co-register DWI and DCE data to non-fat-saturated T1 and to longitudinally register all data images and ROIs to the pre-treatment timepoint.
Three-component modeling of DWI signal
The DWI signal across all available b-values was fit to the three-component model, given as:
SDWI(b) = C1 × eb×ADC1 + C2 × eb×ADC2 + C3 × eb×ADC3,
where SDWI is the diffusion signal in arbitrary units, b is the b-value in s/mm2, and Ci denotes the voxel-wise unit-less signal contribution of each component. The apparent diffusion coefficient (ADC) values, given in mm2/s, were fixed as previously reported in 7. The data were normalized to the 95th percentile of intensity of the computed geometric mean of C1 and C2 for each patient.
Development of tissue classifier
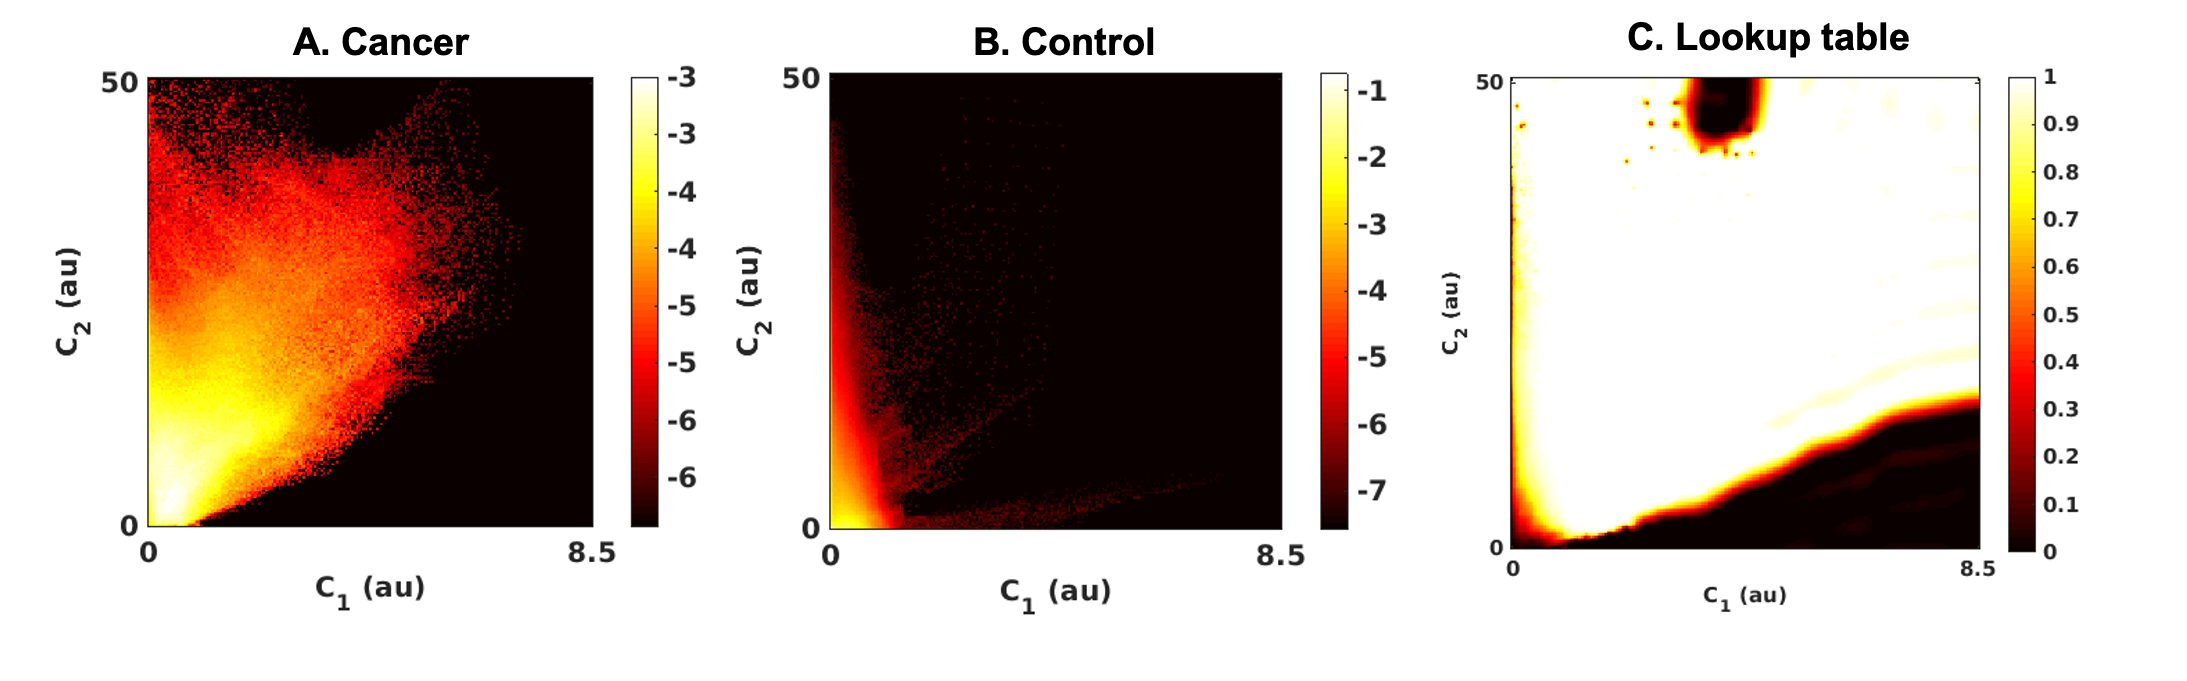
In order to create a global tissue classifier applicable across patients and timepoints, the first two components of the three-componentmodel (C1 and C2) were selected, as these have demonstrated excellent within-patient discrimination of cancer from healthy breast tissue3. Joint C1,C2 probability density functions (PDFs) for cancer and control ROIs were calculated from all patients at the pre-treatment timepoint, generating a lookup table of posterior probability of cancer, given C1 and C2 measurements for any voxel (Figure 1). This was used to create voxel-wise probability maps (C1C2 classifier) for each individual patient at each timepoint.
Tumor volume estimation
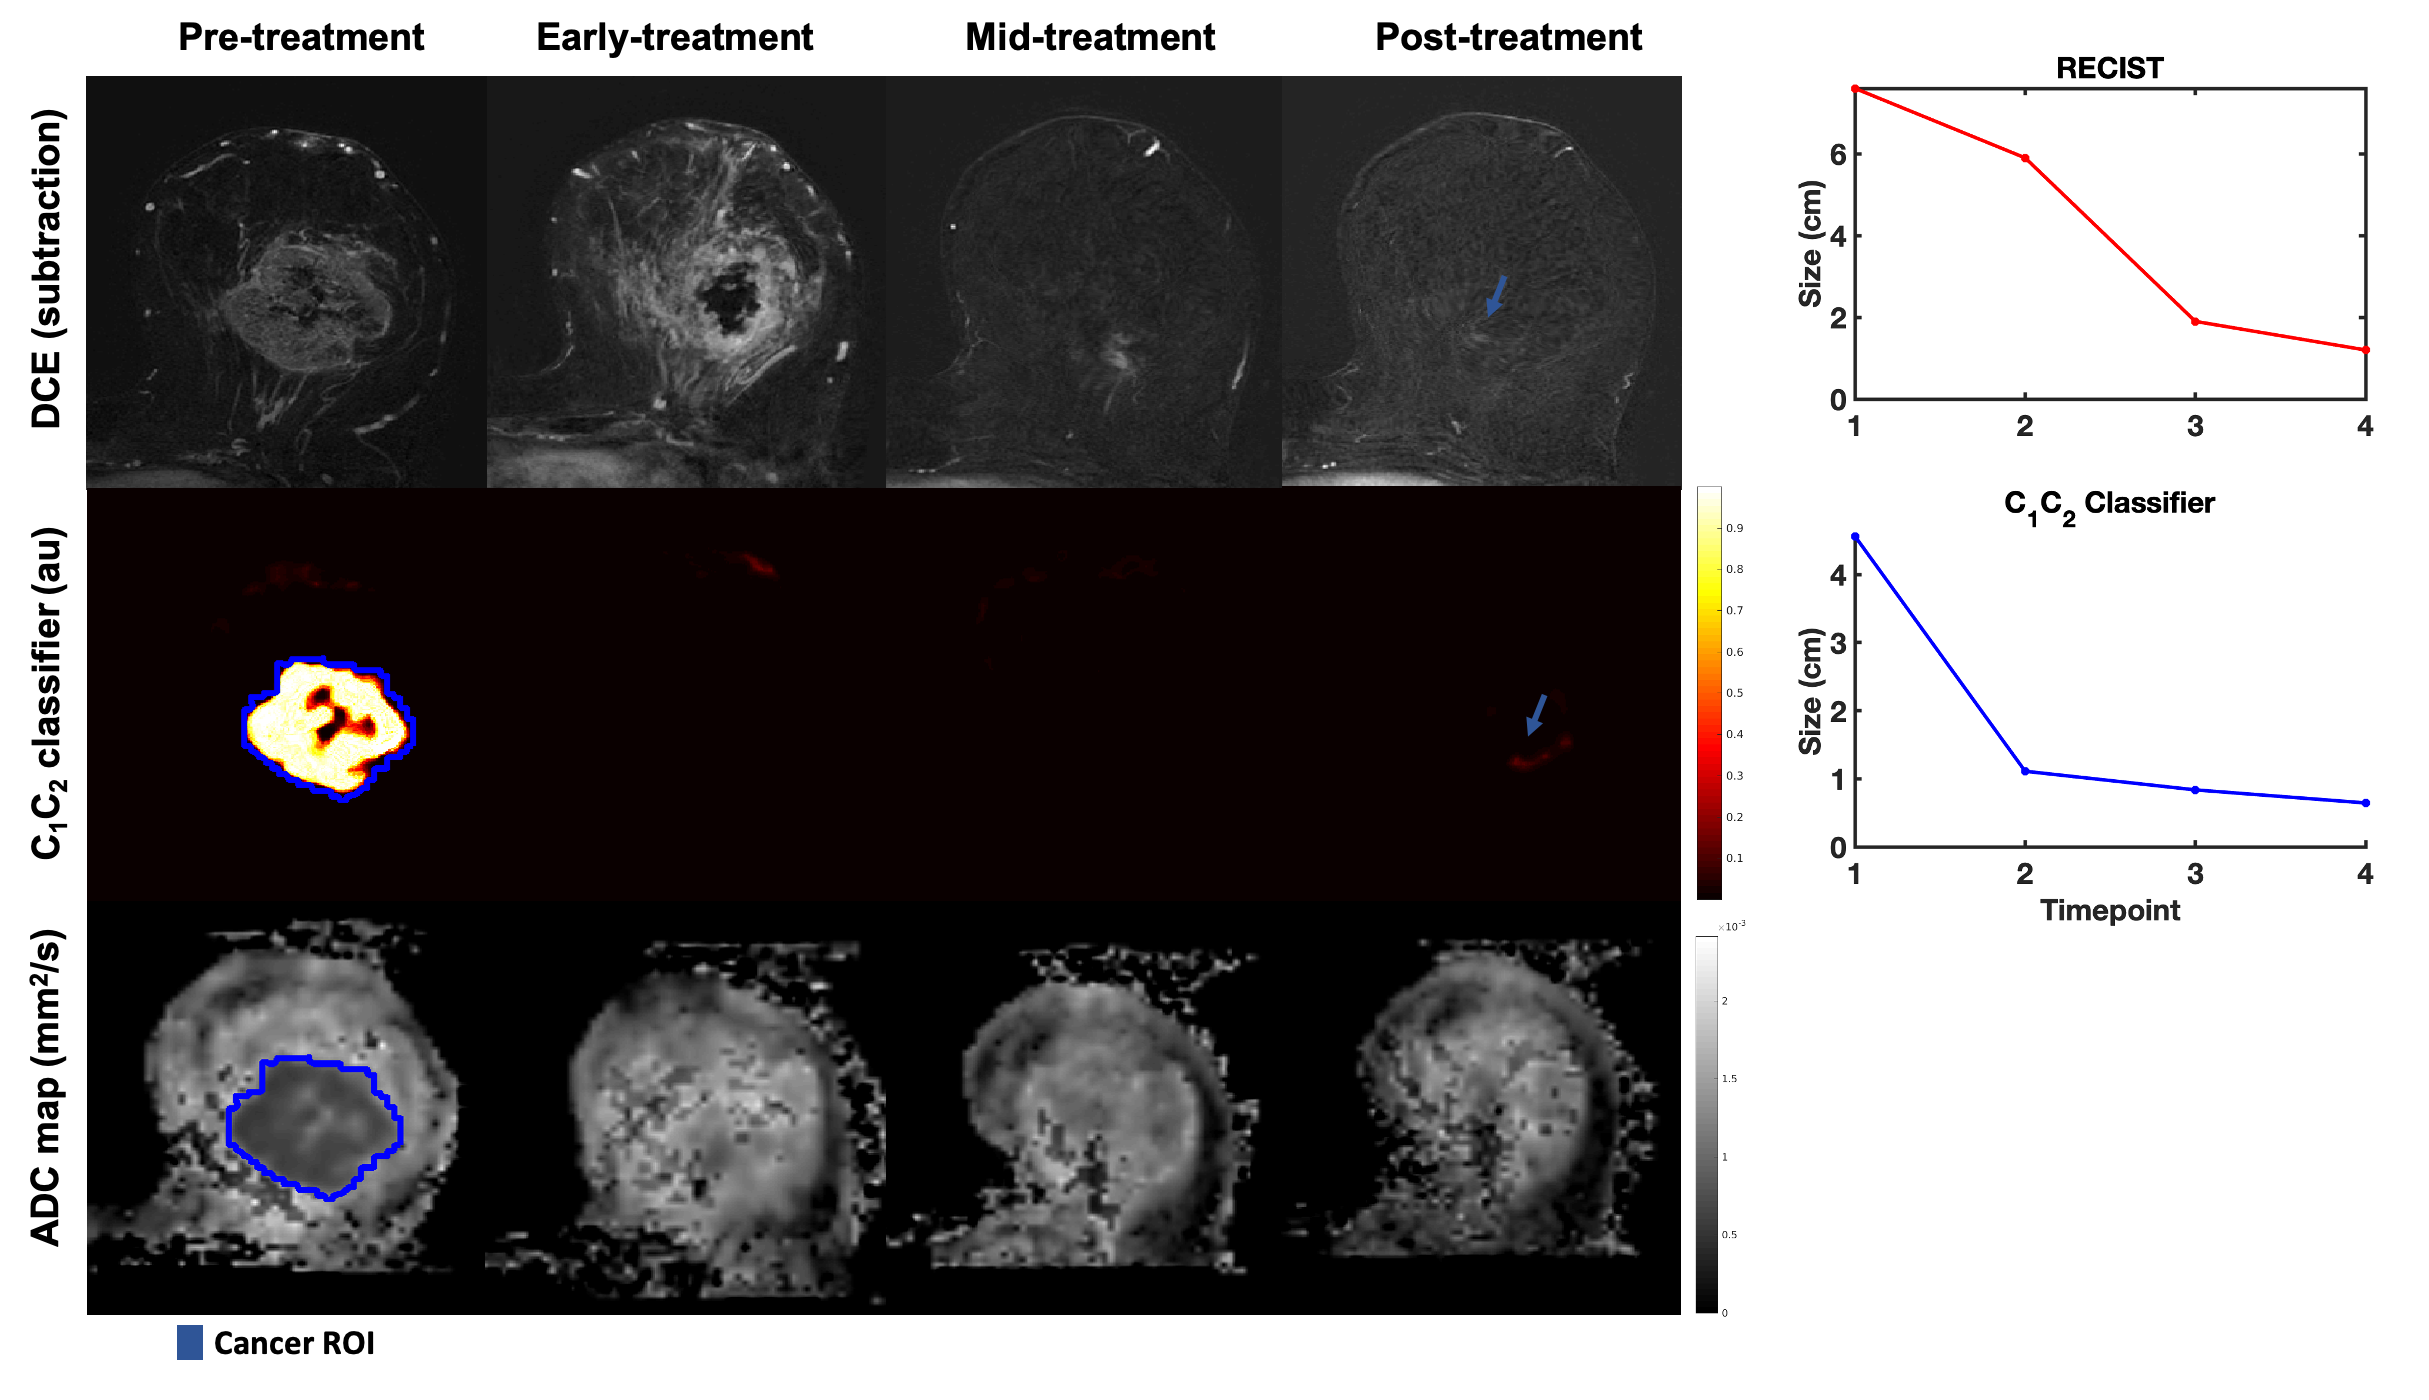
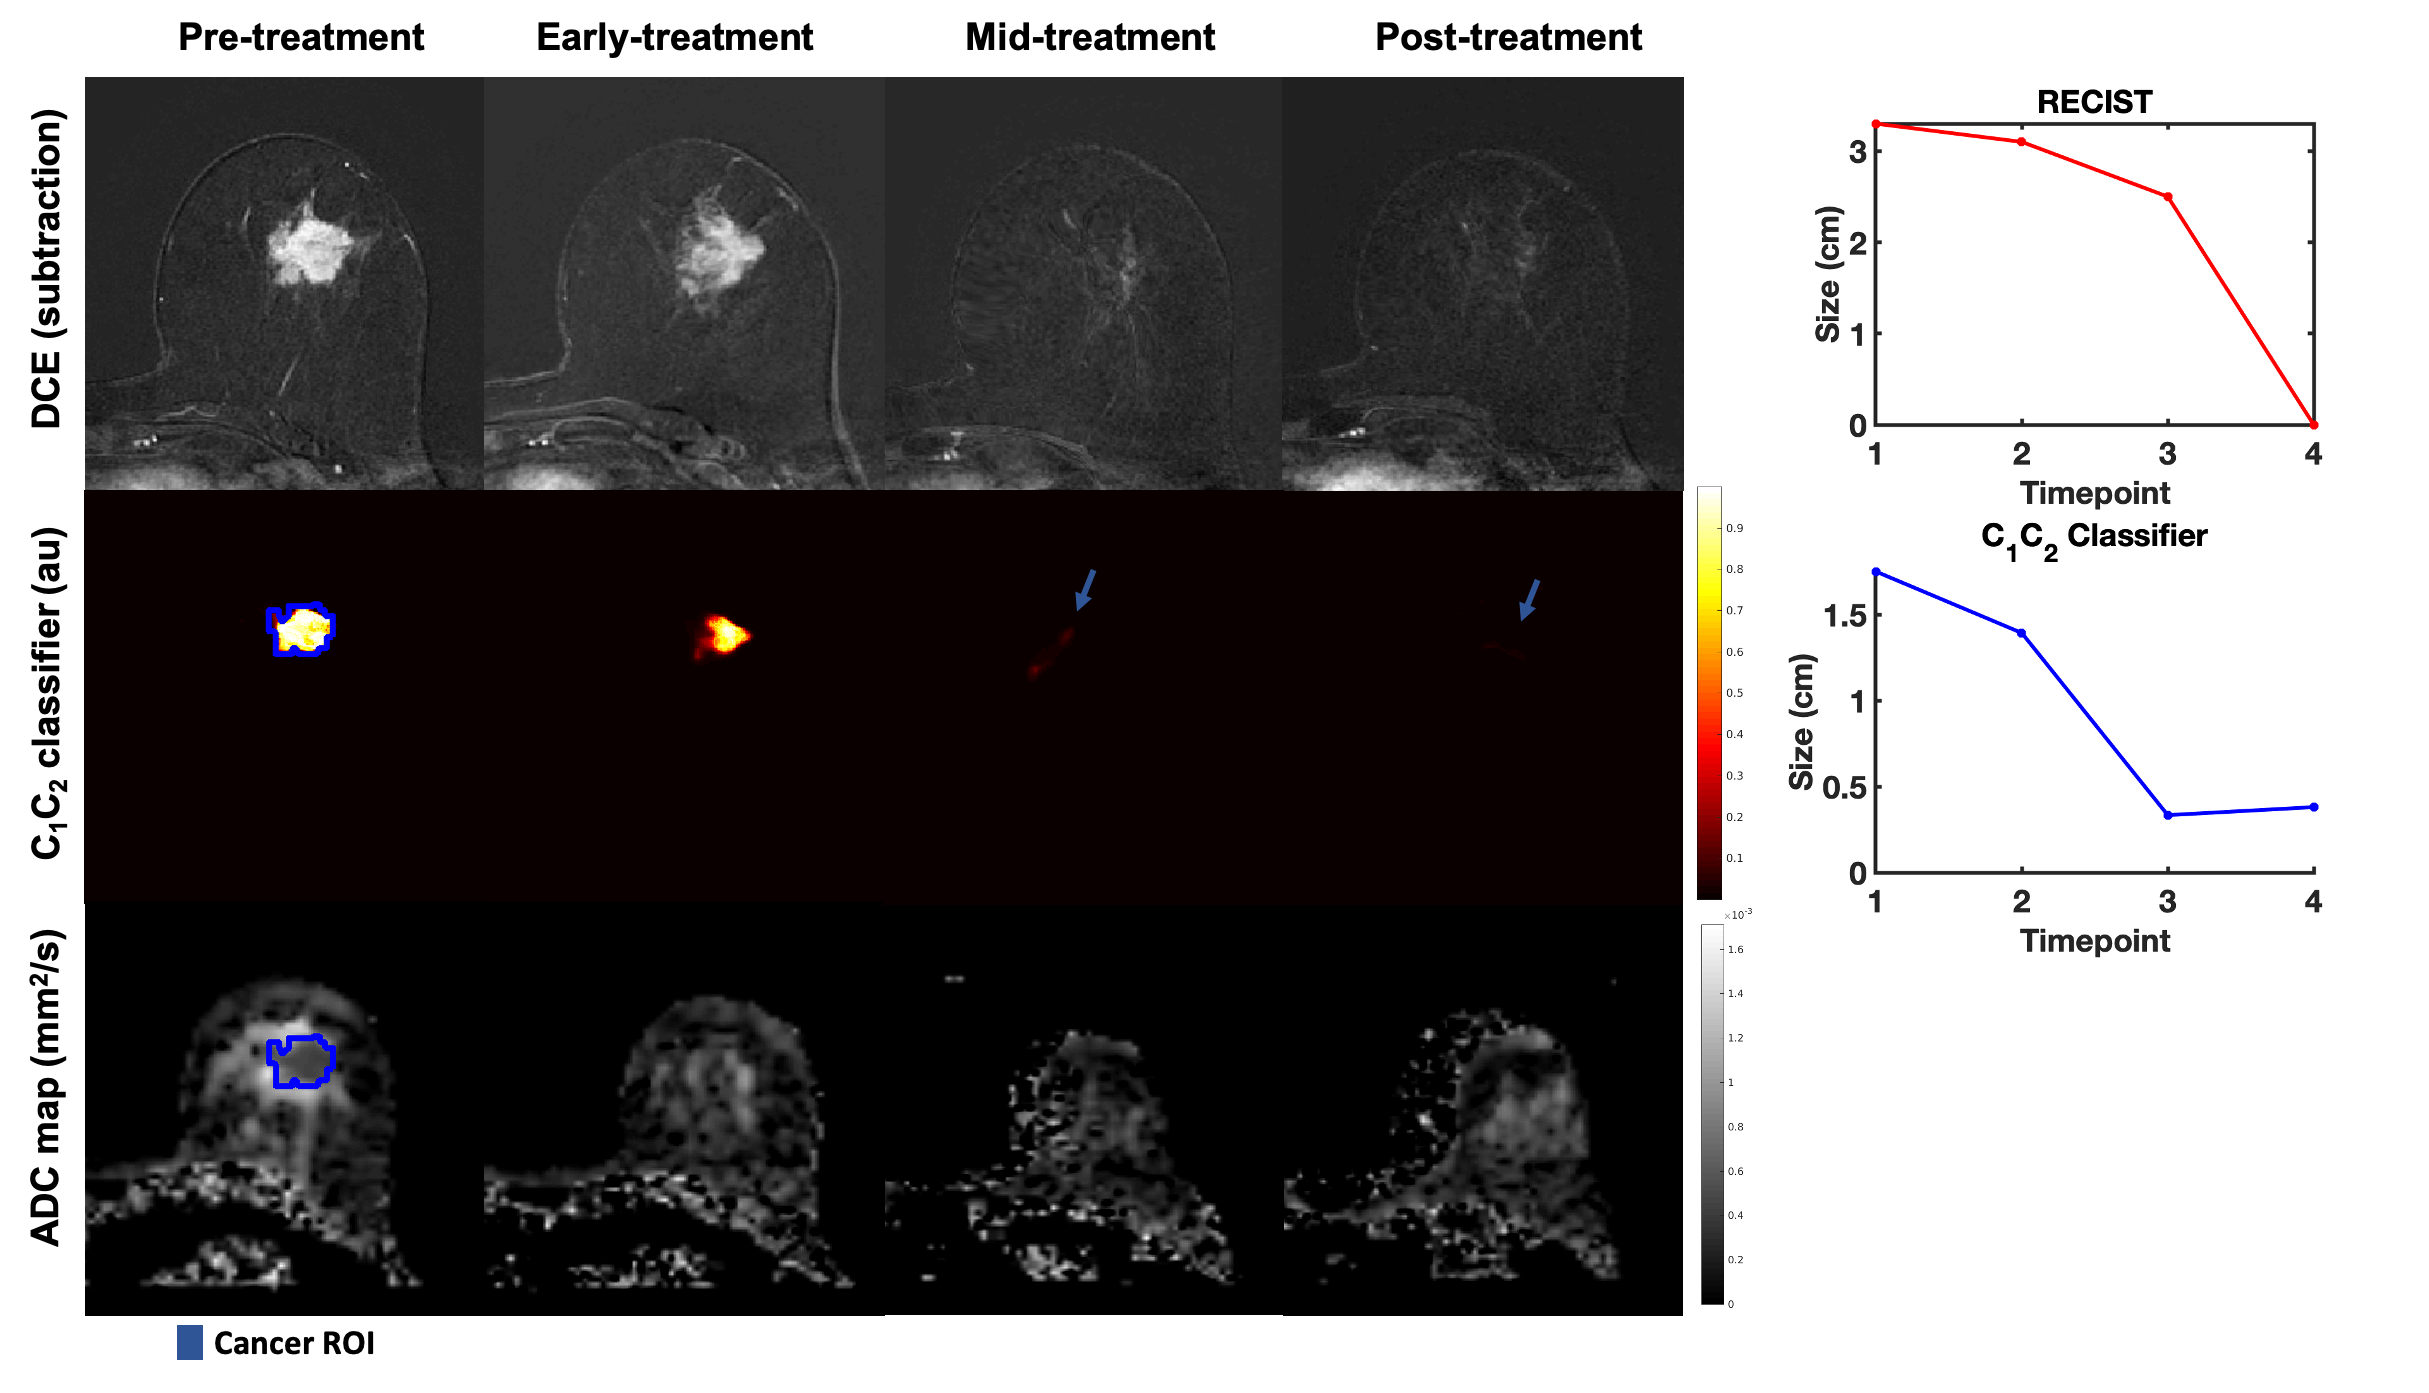
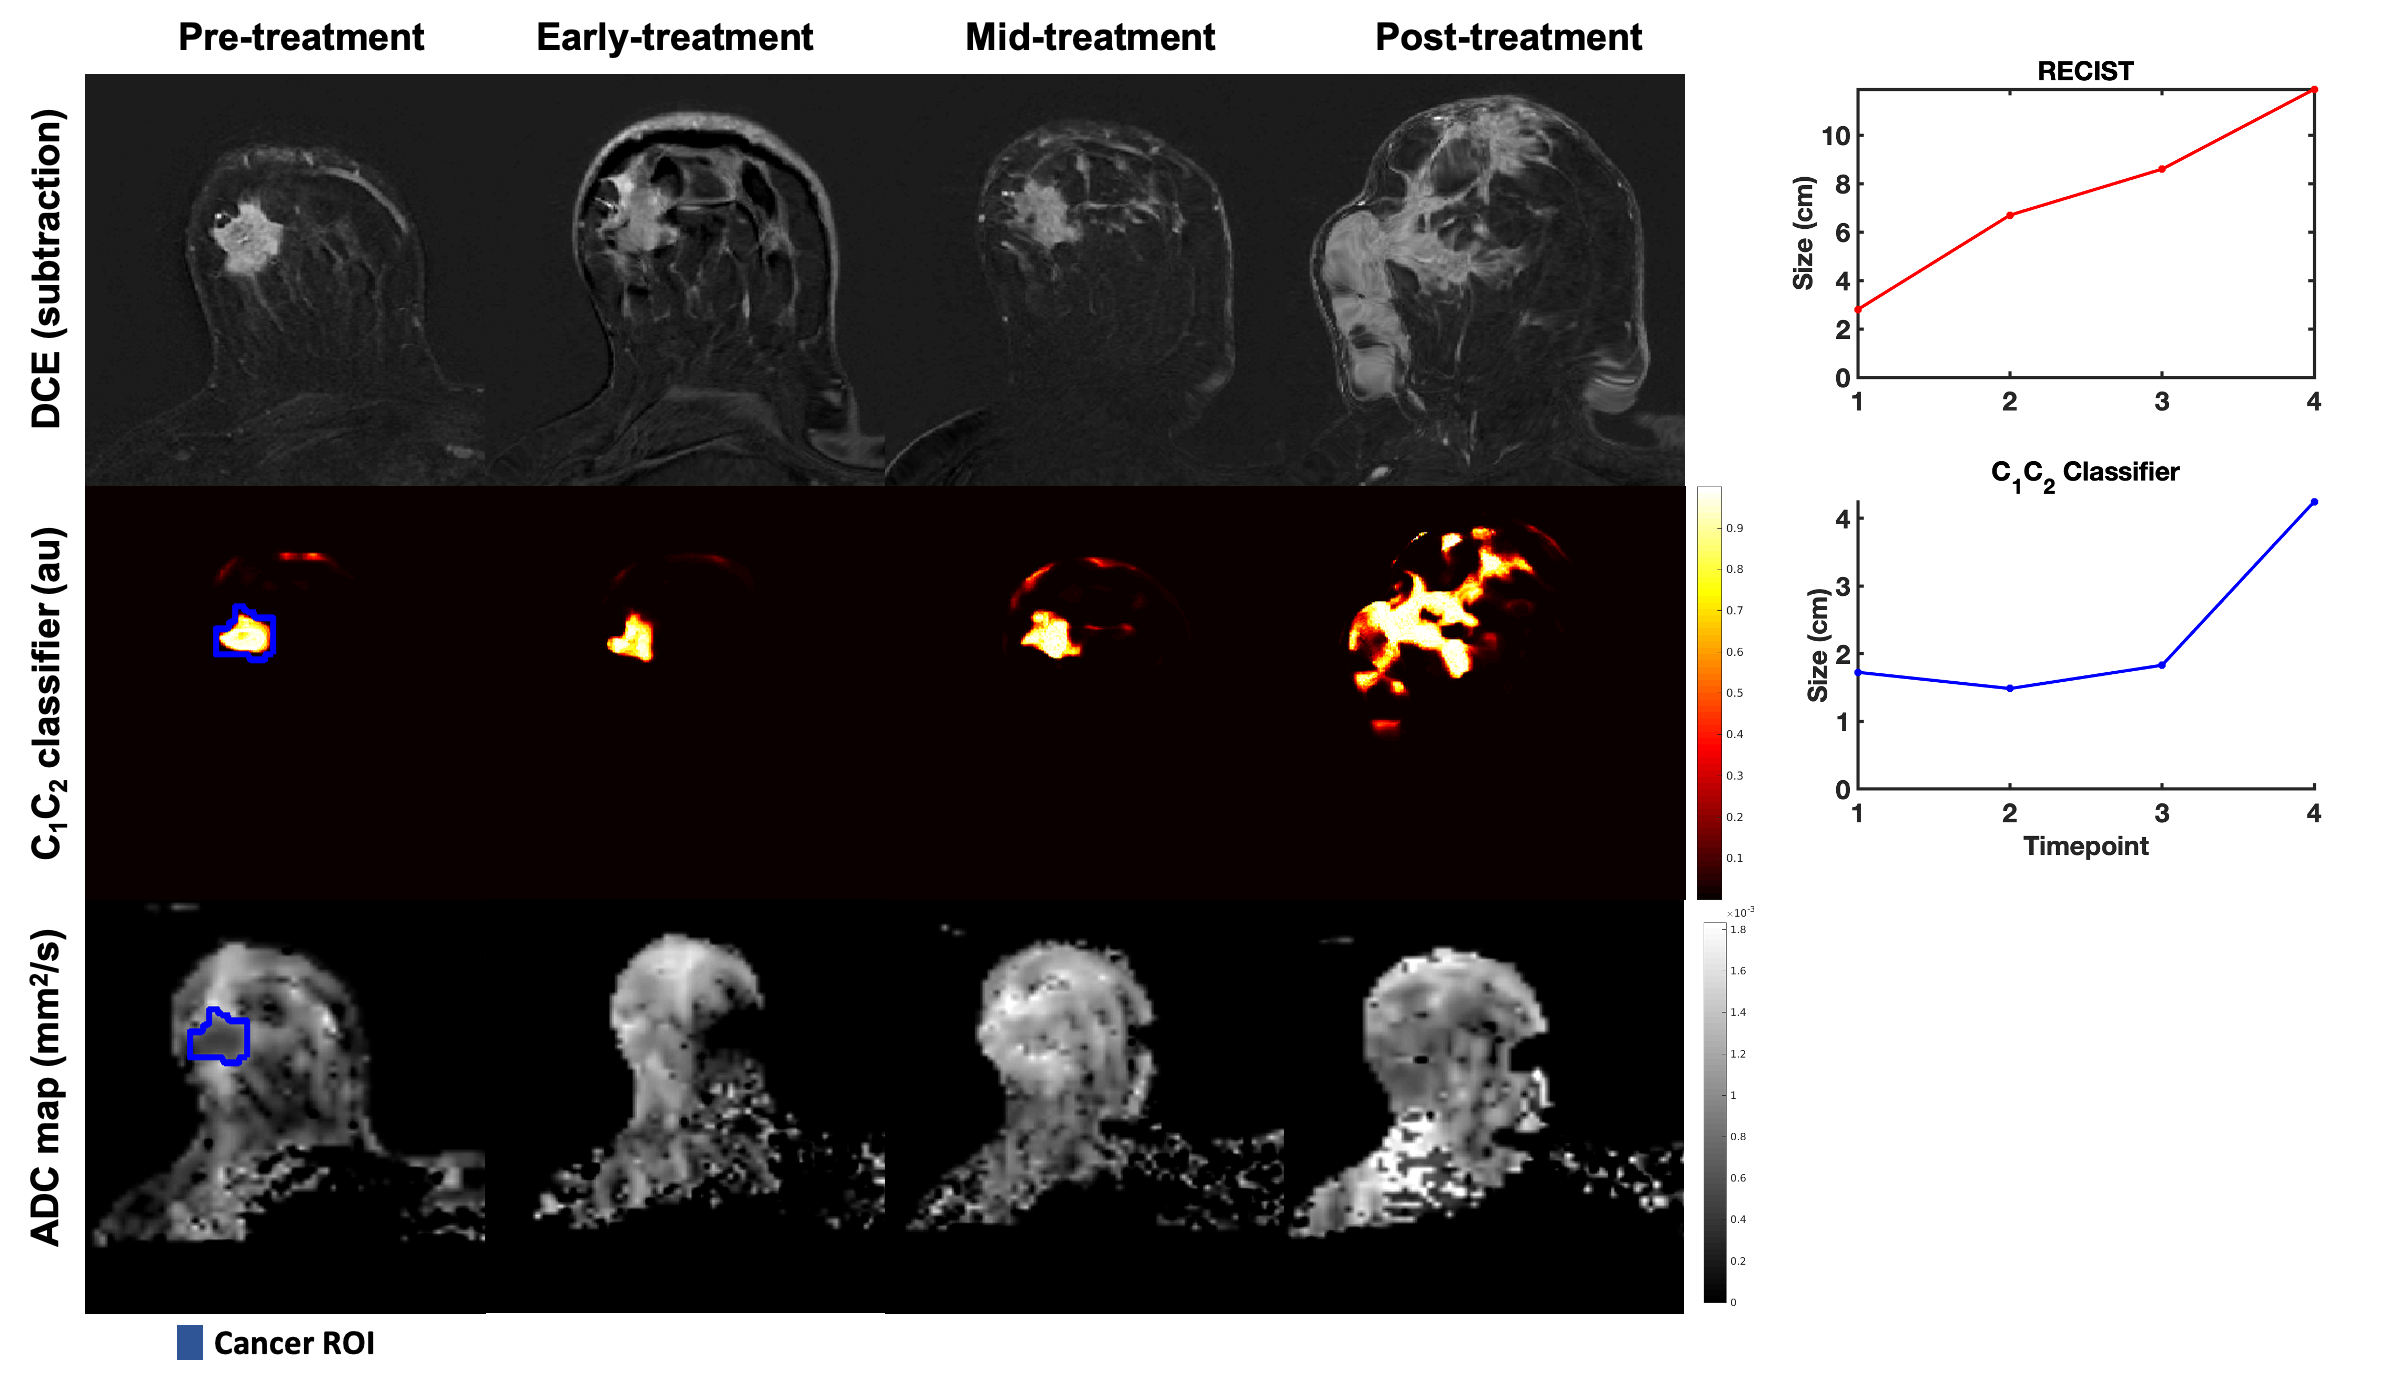
The cancer ROI at the pre-treatment timepoint was uniformly expanded by 5-85 mm (depending on tumor progression/response) to generate a tumor-containing region. The tumor volume was estimated by taking the integral of the C1C2 classifier within the tumor-containing region for all timepoints. The cubic root of the tumor volume on the C1C2 classifier was compared to the longest diameter of the tumor on post-contrast DCE (RECIST). Conventional ADC maps8 were computed for visual comparison.
Response definition
In accordance with RECIST criteria, a ≥30% decrease in size from the pre-treatment timepoint was considered response to treatment for both RECIST and the C1C2 classifier.
Results
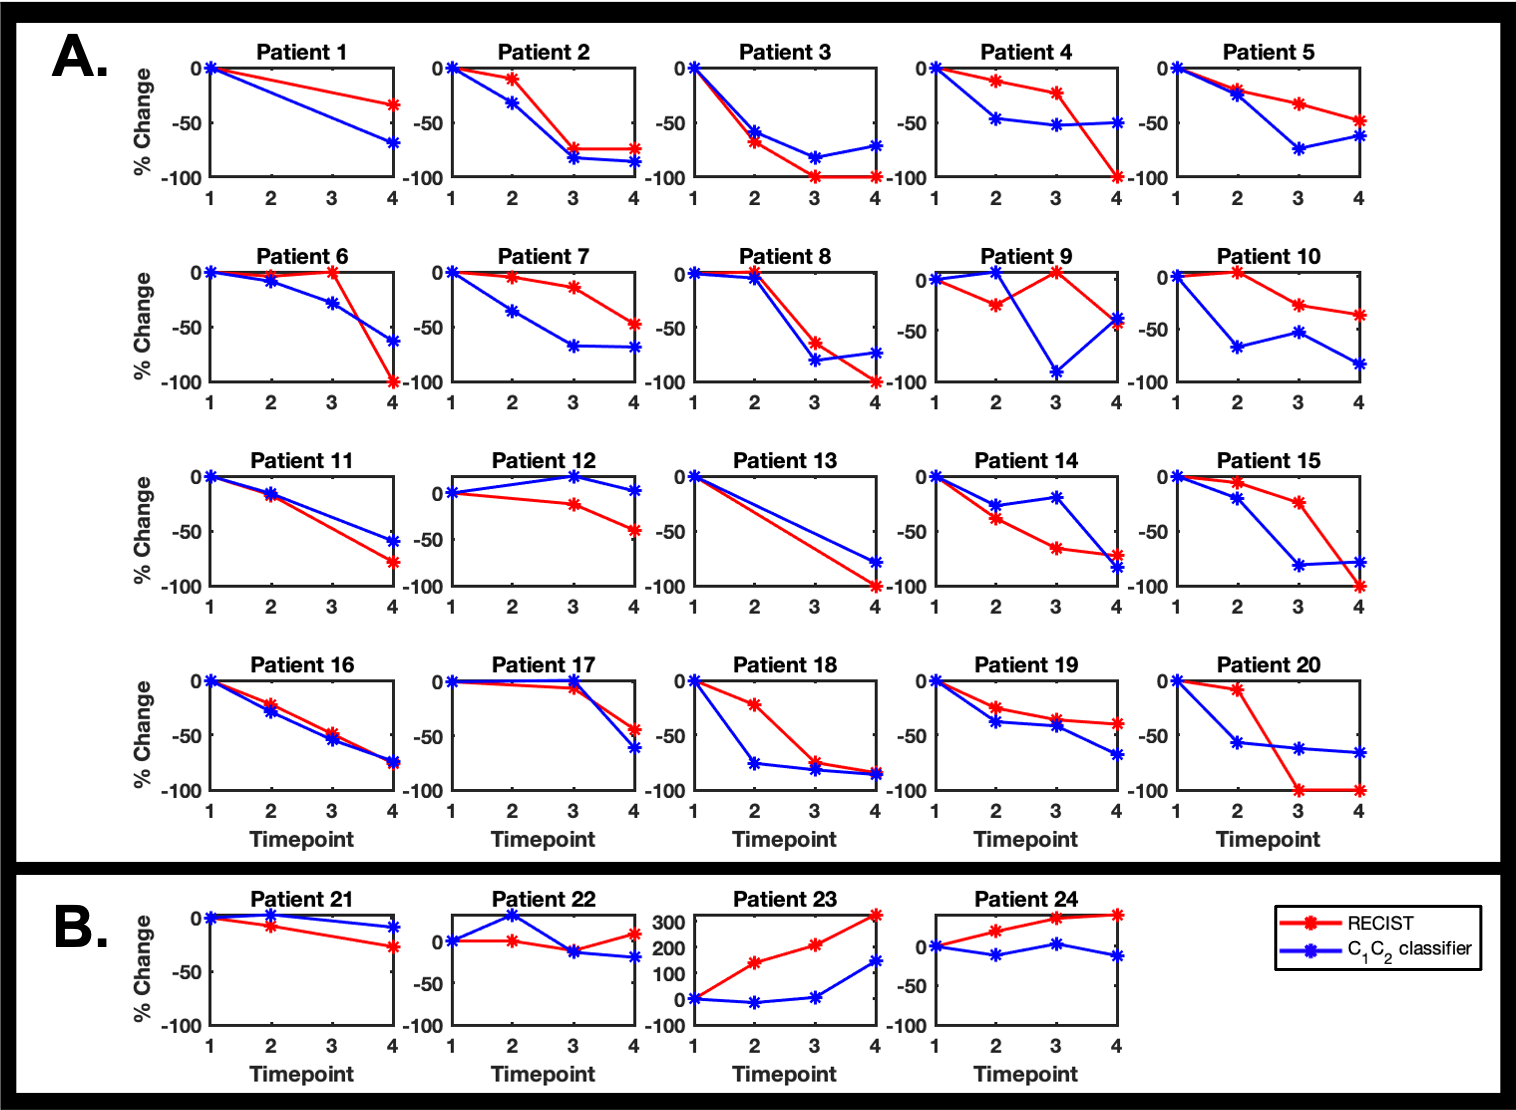
There were 20 treatment responders and 4 non-responders. Change in C1C2 agreed with RECIST classification of treatment response in 23 out of 24 cases. In seven responders (35%), C1C2 captured treatment response at an earlier timepoint than RECIST (Figure 2). Representative cases are shown in Figures 3-5.Discussion and Conclusion
The novel C1C2 classifier successfully monitored response to treatment in 23 of 24 breast cancer patients undergoing neoadjuvant therapy as determined by RECIST, the standard MRI criteria. In 35% of responding cases, the C1C2 classifier was sensitive to response at an earlier timepoint than RECIST-based DCE. Assessment of treatment response at an early timepoint is important for clinical decision-making and may enable tailored treatment regimens. We hypothesize that these promising results are due to the characteristics of the C1C2 classifier, which is sensitive to slow diffusion within hypercellular tumors while simultaneously suppressing signal from of fatty and healthy fibroglandular breast tissue3. The C1C2 classifier automatically estimated tumor volume within 5-85 mm from the cancer ROI, which is an advantage compared to conventional DWI that use tightly defined lesions. These initial results warrant large-scale studies for validation of the C1C2 classifier in breast cancer treatment evaluation.Acknowledgements
We would like to acknowledge the financial support from the California Breast Cancer Research Program Early Career Award (to R. Rakow-Penner), California Breast Cancer Screening Program grant No. 25IB-0056 (to R. Rakow-Penner), GE Healthcare (to R. Rakow-Penner and A.M. Dale), NIH/NIBIB grant No. K08EB026503 (to T.M. Seibert), and the Fulbright Scholarship Program (to M.M.S. Andreassen).References
1. Eisenhauer EA, Therasse P, Bogaerts J, et al: New response evaluation criteria in solid tumours: revised RECIST guideline (version 1.1). Eur J Cancer 45:228-47, 2009
2. Pickles MD, Gibbs P, Lowry M, et al: Diffusion changes precede size reduction in neoadjuvant treatment of breast cancer. Magn Reson Imaging 24:843-7, 2006
3. Andreassen MMS, Rodríguez-Soto AE, Conlin CC, et al: Discrimination of breast cancer from healthy breast tissue using a three-component diffusion-weighted MRI model. Clin Cancer Res, 2020
4. White NS, McDonald CR, Farid N, et al: Diffusion-weighted imaging in cancer: Physical foundations and applications of restriction spectrum imaging. Cancer Research 74:4638-4652, 2014
5. Holland D, Kuperman JM, Dale AM: Efficient correction of inhomogeneous static magnetic field-induced distortion in Echo Planar Imaging. Neuroimage 50:175-83, 2010
6. Tong M, Andreassen MMS, Rodríguez-Soto AE, et al: Longitudinal Registration Methods for Breast MRI: A Feasibility Study, International Society of Magnetic Resonance Medicine Vancouver, Canada, 2021
7. Rodriguez-Soto AE, Andreassen MMS, Conlin CC, et al: Characterization of the Diffusion Signal of Breast Tissues using Multi-exponential Models. medRxiv:2020.04.27.20082271, 2020
8. Jensen JH, Helpern JA, Ramani A, et al: Diffusional kurtosis imaging: the quantification of non-gaussian water diffusion by means of magnetic resonance imaging. Magn Reson Med 53:1432-40, 2005
Figures