1432
Background Parenchymal Enhancement Radiomic Features for Neoadjuvant Treatment Response Prediction in Breast Cancer Patients1Radiology & Biomedical Imaging, University of California, San Francisco, San Francisco, CA, United States, 2Epidemiology & Biostatistics, University of California, San Francisco, San Francisco, CA, United States, 3Quantum Leap Healthcare Collaborative, San Francisco, CA, United States
Synopsis
Background parenchymal enhancement (BPE) observed in normal fibroglandular tissue in breast dynamic contrast-enhanced MRI shows an association with breast cancer risk and has been investigated to predict treatment response. Contralateral BPE radiomic features and mean BPE values were calculated from DCE-MRI and their predictive performance of pathologic complete response after neoadjuvant chemotherapy was tested. The best mean AUCs were found using BPE radiomics based random forest model with minimal-redundancy-maximal-relevance feature selection in the HR- group and HER2- group. Our results show that contralateral BPE radiomic features have potential as imaging biomarkers for treatment response.
Introduction
Background parenchymal enhancement (BPE) from dynamic contrast-enhanced breast MRI (DCE-MRI) has been shown to have an association with breast cancer risk1. Our recent study found that mean contralateral BPE (cBPE) has potential to be an early biomarker for response to neoadjuvant chemotherapy (NAC) in the hormone receptor-negative (HR-) and human epidermal growth factor receptor-2-positive (HER2+) subtype2. Changes in the contralateral BPE during NAC may reveal insights on the effect of treatment both on breast cancer and normal breast tissue environment. One limitation of the previous finding was the use of a single BPE descriptor: mean cBPE for the whole breast volume. Radiomic feature analysis and high-dimensional data may offer additional insights into treatment response. The objective of our study is 1) to test BPE radiomic features derived from the contralateral whole breast fibroglandular tissue (FGT) map for prediction of pathological complete response (pCR) after NAC and 2) to compare their predictive performance to that of whole breast mean cBPE.Methods
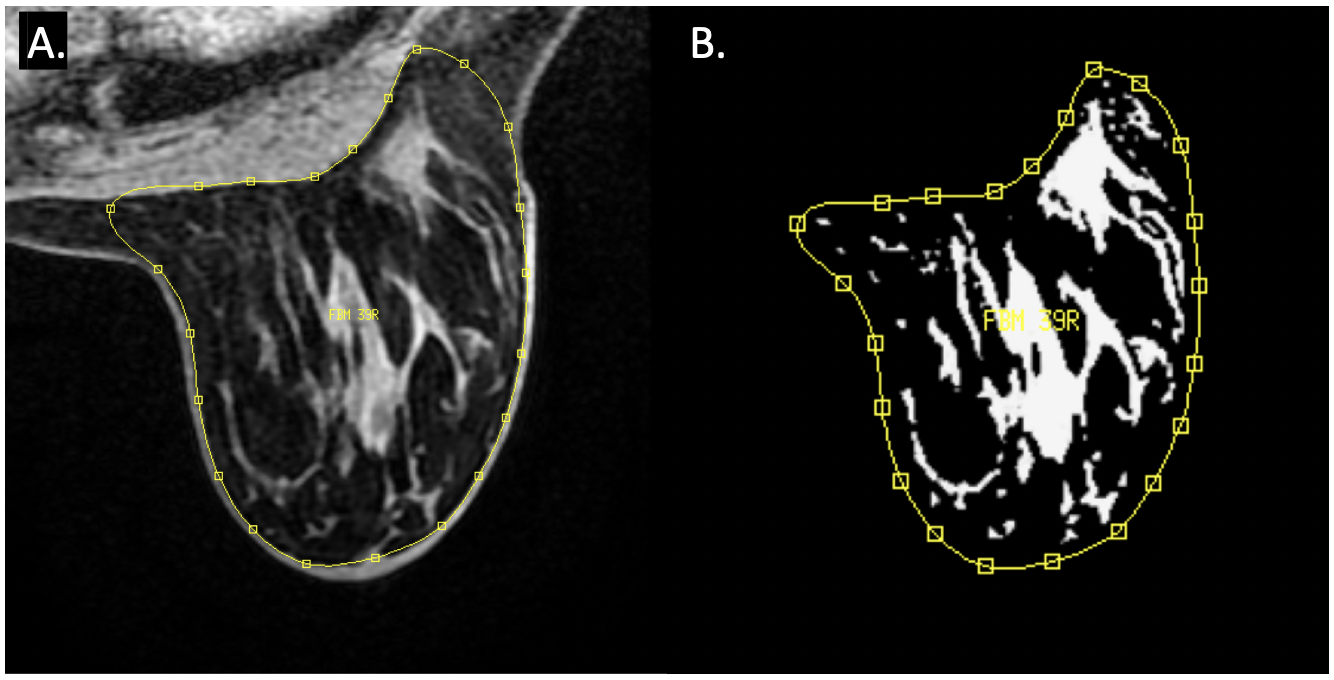
This retrospective study analyzed patients with locally advanced breast cancer enrolled in the multi-center I-SPY2 TRIAL (Investigation of Serial Studies to Predict Your Therapeutic Response with Imaging and Molecular Analysis 2)3. Patients were imaged with DCE-MRI at baseline (T0), early treatment (T1), and inter-regimen (T2) timepoints. As visualized in Fig. 1, the whole contralateral breast was manually delineated and then the fibroglandular tissue (FGT) was segmented using an automated in-house algorithm based on fuzzy c-means (FCM) clustering4.We calculated mean cBPE as Σ [(S1-S0)/S0]/N, where S0 and S1 are the pre- and early post-contrast signal intensities and N is the number of FGT voxels. Percent change of mean cBPE was calculated between T0 and T1 (ΔBPE0_1) and T0 to T2 (ΔBPE0_2). The ΔBPE0_1 and ΔBPE0_2 values were fitted to a logistic regression model to compare the predictive performance of pCR against percent change in BPE radiomic features.
Percent enhancement [PE=(S1-S0)/S0)] maps were derived from the pre-contrast and early post-contrast (2.5 minutes after contrast injection) DCE images. The PE maps were resampled to 1.5 mm isotropic resolution with linear interpolation, and at each treatment timepoint (T0, T1, and T2), 107 radiomic features (First Order Statistics, Shape, and Gray Level Co-occurrence (GLCM), Run Length (GLRLM), Size Zone (GLSZM), Dependence (GLDM), and Neighborhood Gray Tone Difference (NGTDM) matrices) were calculated for each patient using PyRadiomics5. These radiomic features were centered and scaled based on baseline features (T0) and used to calculate percent change from T0 to T1 and from T0 to T2. The total number of features generated was 216 with HR and HER2 status included. The random forest (RF) models using the full set of 216 radiomic features or a reduced 20 feature set defined by minimal-redundancy-maximal-relevance criterion (mRMR)6 were built for the prediction of pCR.
The mean cBPE-based logistic regression model was compared with the BPE radiomics-based RF models without or with mRMR. Nested cross-validation was performed with 5-fold stratified outer cross-validation, 5-fold stratified inner cross-validation using a grid search for hyperparameter optimization, and 5 repeated random trials with an 80/20 split for training/validation. The area under the receiver operating characteristic curve (AUC) was averaged between the 5 repeated trials and was used to assess the predictive performance of the selected radiomic features in the subgroups based on the HR and HER2 status.
Results
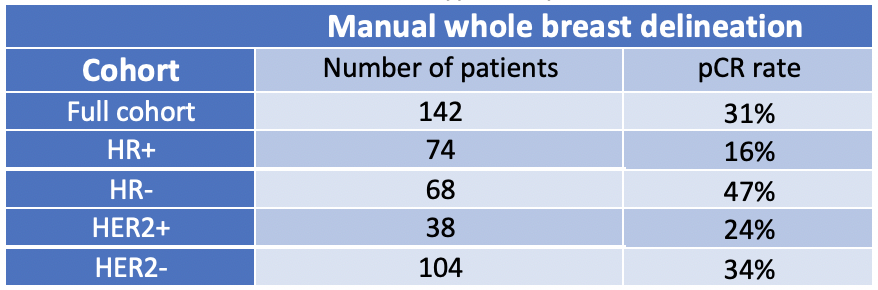
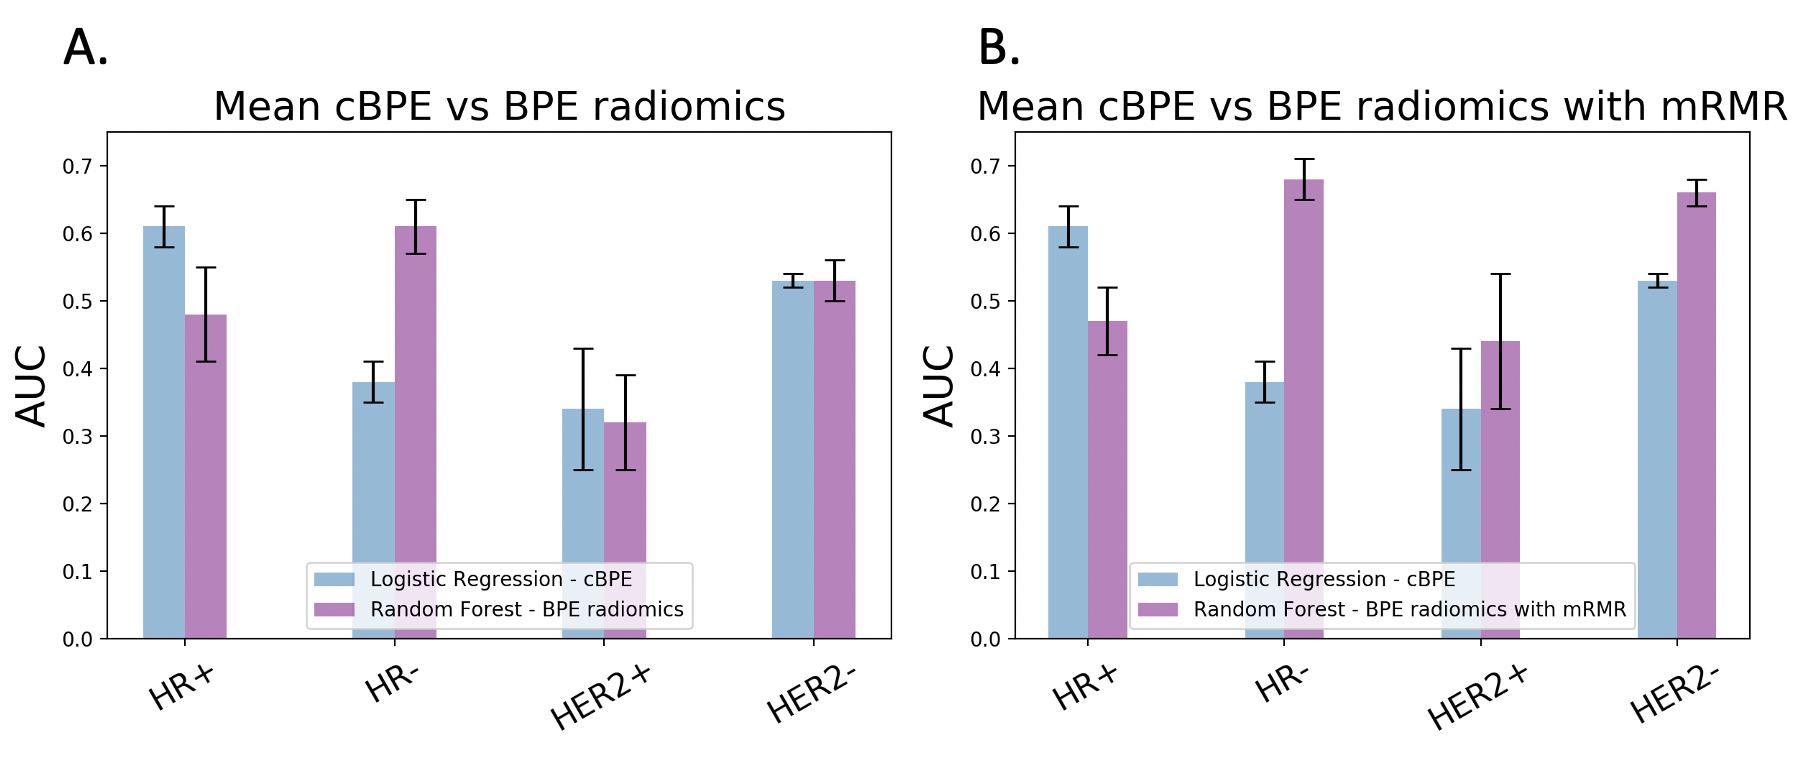
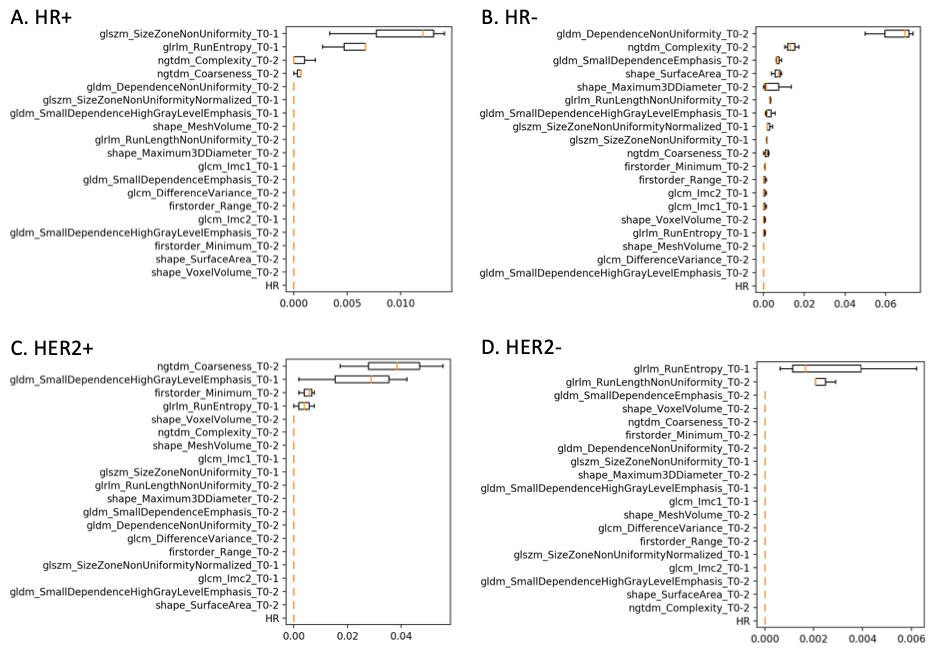
In total, 142 breast cancer patients were included. The tumor subtype and pCR rate are shown in Table 1. In the HR+ group, the BPE radiomics-based models showed lower AUC than the mean cBPE-based model (0.48± 0.07 vs. 0.61 ± 0.03). The use of mRMR showed a similar AUC of 0.47 ± 0.05. In the HR- group, the BPE radiomics-based models showed higher AUC than the mean cBPE-based model (0.61 ± 0.05 vs. 0.38 ± 0.03). The use of mRMR further increased AUC from 0.61 ± 0.05 to 0.68 ± 0.03. In the HER2+ group, both the BPE radiomics-based models and the mean cBPE-based model showed similarly low AUCs (0.32 ± 0.07 vs. 0.34 ± 0.09). The use of mRMR showed an increase of AUC from 0.32 ± 0.07 to 0.44 ± 0.10. In the HER2- group, both the BPE radiomics-based models and the mean cBPE-based model showed similarly low AUCs (0.53 ± 0.03 vs. 0.53 ± 0.01). The use of mRMR showed an increase of AUC from 0.53 ± 0.03 to 0.66 ± 0.06. AUC values are plotted in Fig. 2. The importance of features that were selected for the RF-mRMR model during training can be found in the permutation importance plots in Fig. 3.Discussion
By focusing on relevant features with minimal redundancy using mRMR, the BPE radiomics-based RF models showed improved predictive performance of pCR in the HR-, HER2+, and HER2- group and exceeded the mean cBPE-based model.Conclusion
Our results indicate that contralateral BPE radiomic features have potential as early imaging biomarkers for treatment response. Future work includes exploring the additive value of radiomic features to the prediction of treatment response with functional tumor volume and other clinical demographics.Acknowledgements
This work was supported in part by NIH grants: R01 CA132870, U01 CA225427, and P01 CA210961.References
1. Liao, G. J. et al. Background parenchymal enhancement on breast MRI: A comprehensive review. J Magn Reson Imaging 51, 43-61, doi:10.1002/jmri.26762 (2020).
2. Nguyen, A. A. et al. Comparison of Segmentation Methods in Assessing Background Parenchymal Enhancement as a Biomarker for Response to Neoadjuvant Therapy. Tomography 6, 101-110, doi:10.18383/j.tom.2020.00009 (2020).
3. Barker, A. D. et al. I-SPY 2: an adaptive breast cancer trial design in the setting of neoadjuvant chemotherapy. Clin Pharmacol Ther 86, 97-100, doi:10.1038/clpt.2009.68 (2009).
4. Klifa, C. et al. Quantification of breast tissue index from MR data using fuzzy clustering. Conf Proc IEEE Eng Med Biol Soc 3, 1667-1670, doi:10.1109/IEMBS.2004.1403503 (2004).
5. van Griethuysen, J. J. M. et al. Computational Radiomics System to Decode the Radiographic Phenotype. Cancer Res 77, e104-e107, doi:10.1158/0008-5472.CAN-17-0339 (2017).
6. Peng, H., Long, F. & Ding, C. Feature selection based on mutual information: criteria of max-dependency, max-relevance, and min-redundancy. IEEE Trans Pattern Anal Mach Intell 27, 1226-1238, doi:10.1109/TPAMI.2005.159 (2005).
Figures