1409
UWB antenna system fidelity investigation for wireless MRI1Pediatric Radiology, Stanford University, Palo Alto, CA, United States, 2GE Healthcare, Aurora, OH, United States, 3Electrical Engineering, Stanford University, Palo Alto, CA, United States
Synopsis
We assess the effect of UWB antenna arrangement within a simulated bore environment that includes a pediatric human phantom using system fidelity factor calculations for wireless data link integrity
Introduction
The electromagnetic environment within the MRI bore impacts wireless data link integrity, affecting wireless system design 1. An RF front-end antenna has finite bandwidth, and limits data transfer capacity because of its band pass filter behavior for a given wave propagation channel. An Ultra Wide Band (UWB) antenna 2 that may allow minimum system perturbations and support desired wireless data bandwidth within the bore 3 has been investigated using a full wave FDTD solver. System fidelity factor (SFF) 4 is a cross correlation metric of time domain pulse distortion and its computation may help antenna placement by providing the system transfer functions over a desired frequency band. A preliminary investigation suggests preferable antenna arrangements within the bore for a wireless link fidelity goal.Methods
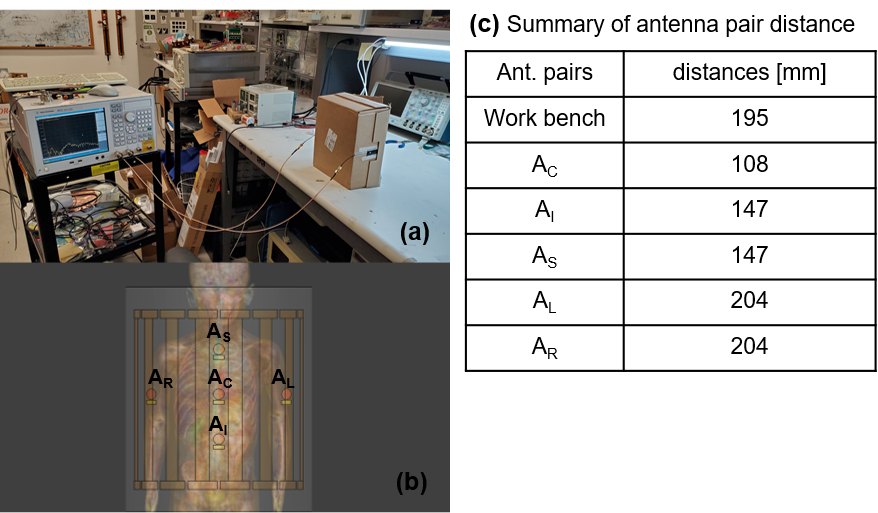
SFF was calculated as a quantitative metric to assess wireless data transfer fidelity for measurements and simulations. The system under investigation included a benchtop measurement, and multi-port simulations that cover five different UWB antenna (24mm width, 35mm height, Taoglas) pairs in free space and within the bore. System transfer functions, essential to calculating SFF, H(ω) were obtained by measuring S21 using a VNA on the bench, and by multi-port simulations using sim4life (version 5.2, full 3D FDTD solver, ZMT). The antenna arrangements were the same in free space and within the bore to observe the effect of the shielded birdcage. Figure 1 shows a photograph of workbench measurement setup (a) and a 3D simulation model (b) to obtain transfer functions over UWB. In simulation, the Tx antennas were arranged at five locations, Center / Left / Right / Superior / Inferior, relative to the xiphoid landmark of a pediatric phantom (Roberta, 5-year girl, ZMT). These five virtual antennas were positioned about 1 cm above the phantom, conforming to its surface. Note that the Tx antenna at the center (AC) was placed just above the xiphoid landmark. An Rx antenna sits at the middle of two adjacent rung conductors, which provides five Tx-Rx simulation pairs. Table (c) in figure 1 shows the summary of antenna distance for each pair. A Gaussian test pulse 5 was defined over UWB. This test pulse characterized a band limited pulse from 2 – 10 GHz that may be used for wireless communication.Results
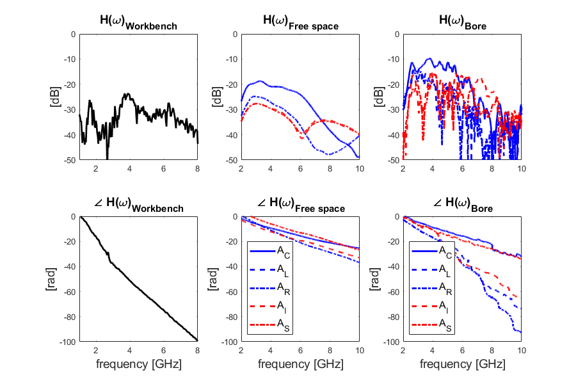
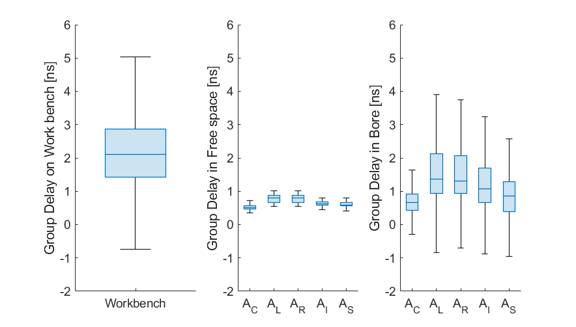
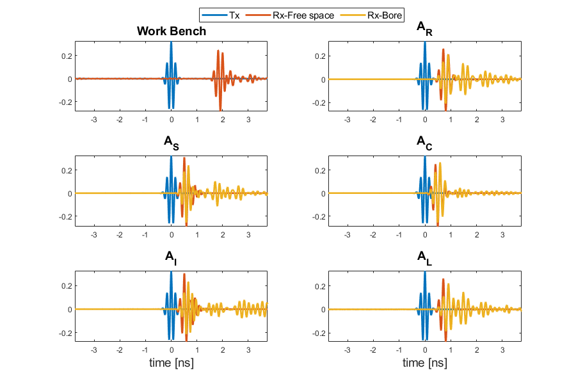
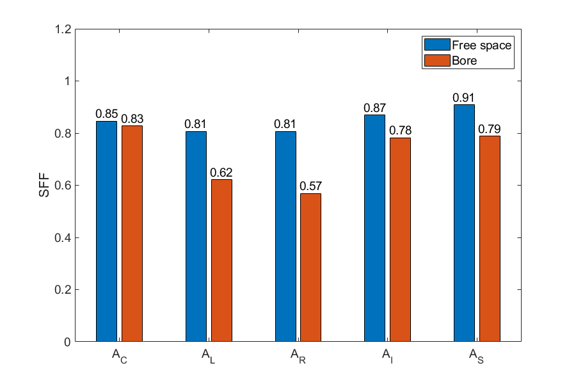
The measured and simulated system transfer functions are shown in terms of log magnitude and phase in figure 2. All simulation results that satisfy convergence level under -15dB were collected for analysis. The unwrapped phases of H(ω) for all cases show monotonic decrease over frequency. The phase gradients were proportional to Tx-Rx distance and represent more dispersion within the bore. Another observation is that the simulated magnitudes within the bore show relatively higher amplitude than in free space. This may be attributed to the antenna gain enhancement due to the shield and conductive phantom acting as reflectors. The calculated group delay distribution followed the transfer function results in figure 3, noting that group delay is just a phase slope with frequency. Reconfigured pulses for each antenna pair are presented in figure 4. The blue line shows an excitation Gaussian pulse at each Tx as reference. The red and orange lines represent reconfigured pulses at the Rx in free space and within the bore, respectively. The pulse shape and delay depend on distance between Tx and Rx, and wave propagation channel. The reconfigured pulses at the AC within the bore resulted in the minimum pulse delay, ringing, and less pulse distortion. Comparison of the calculated SFF numbers for antenna pairs in free space and within the bore are shown in figure 5. Those within the bore (red bar) resulted in fidelity degradation for all cases, compared to free space (blue bar). The SFF at the AC shows the minimum difference between free space and in the bore, whereas the left and the right pairs (AL, AR) represent relatively large differences.Discussion and Conclusion
One of the keys for successful wireless MRI is that the data link be predictable and reliable within a bore environment 6. Group delay dispersion that is correlated to the phase gradient of transfer functions becomes wider when antenna distance increases within a shielded resonator, degrading system fidelity factors. According to simulation results, the antenna arrangement that provides the shortest line of sight resulted in the minimum system fidelity degradation when in the bore. Accordingly, the close line of sight between antenna pairs assumes that antennas are integrable within a volume coil without significant system alternations. Considering the wide band response and the physical size of a UWB antenna, these are candidates to mediate data link when massive digital data transfer is required. Besides the data link, UWB antennas may be exploited in the application of non-contact cardiac gating 7. More systematic measurements and simulations are planned to investigate feasible antenna integration for reliable wireless data link as well as motion sensor applications.Acknowledgements
We thank GE Healthcare for research support, NIH RO1 EB019241, and NIH U01EB029427.References
1. Greig Scott et al. BPSK/ASK Wireless Link Assessment for MRI, ISMRM 2020, #0759
2. Renato Cicchetti et al. Wideband and UWB Antennas for Wireless Applications: A Comprehensive Review, International Journal of Antennas and Propagation, Volume 2017, pp 1-45
3. Thomas Foo et al. Lightweight, compact, and high-performance 3T MR system for imaging the brain and extremities, MRM 2018;80:2232-2245
4. Gabriela Quintero et al. System Fidelity Factor: A New Method for Comparing UWB Antennas, IEEE trans. on Antenna and Propagation, Vol. 59, No. 7, July 2011, pp 2502-2512
5. https://en.wikipedia.org/wiki/Gaussian_function
6. Lena Nohava et al. Perspectives in Wireless Radio Frequency Coil Development for Magnetic Resonance Imaging, Front. Phys. Vol. 8, Article 11, Feb. 2020
7. Olaf Kosch et al. Non-contact cardiac gating with ultra-wideband radar sensors for high field MRI, ISMRM 2011, #1804
Figures