1383
Model-based motion correction outperforms a model-free method in quantitative renal MRI1University of Leeds, Leeds, United Kingdom, 2University of Sheffield, Sheffield, United Kingdom, 3Leeds Teaching Hospitals NHS Trust, St James's Hospital, United Kingdom
Synopsis
Current approaches for motion correction of quantitative MRI include model-driven registration (MDR) and model-free registration (MFR). This study compared MDR against a state-of-the-art groupwise MFR (GMFR) on T1-mapping, DTI and DCE from 10 patients with diabetic kidney disease. The results demonstrate the benefits of MDR in the context of quantitative imaging: MDR scores better on most quality and error metrics (up to 20% improvement) and offers a substantial gain in computation times (up to 17hrs per slice). Furthermore, there is potential for translation to other applications.
Introduction
Most emerging approaches for motion correction of quantitative MRI involve the use of a synthetic motion-free series as a target for image co-registration. Synthetic targets can be generated either using model-free registration (MFR) methods such as principal component analysis [1-3] or model-driven registration (MDR) methods that fit the physical signal model itself [4-7].We hypothesise that MDR is more suitable than MFR in the context of quantitative MRI, where motion correction is not an aim on itself but a step in a processing pipeline that produces a parametric map. Considering the whole pipeline, the use of a model is unavoidable and thus MFR imposes additional constraints that may bias the solution unnecessarily.
The aim of this study was to challenge this hypothesis by comparing MDR against a state-of-the-art groupwise MFR (GMFR) [3] in multiparametric MRI of the kidney – a challenging application area due to large motion amplitudes, reversals in image contrast and computational load. GMFR was chosen as a comparator because it has proven to perform well in a wide variety of application areas including multiparametric renal MRI [8].
Methods
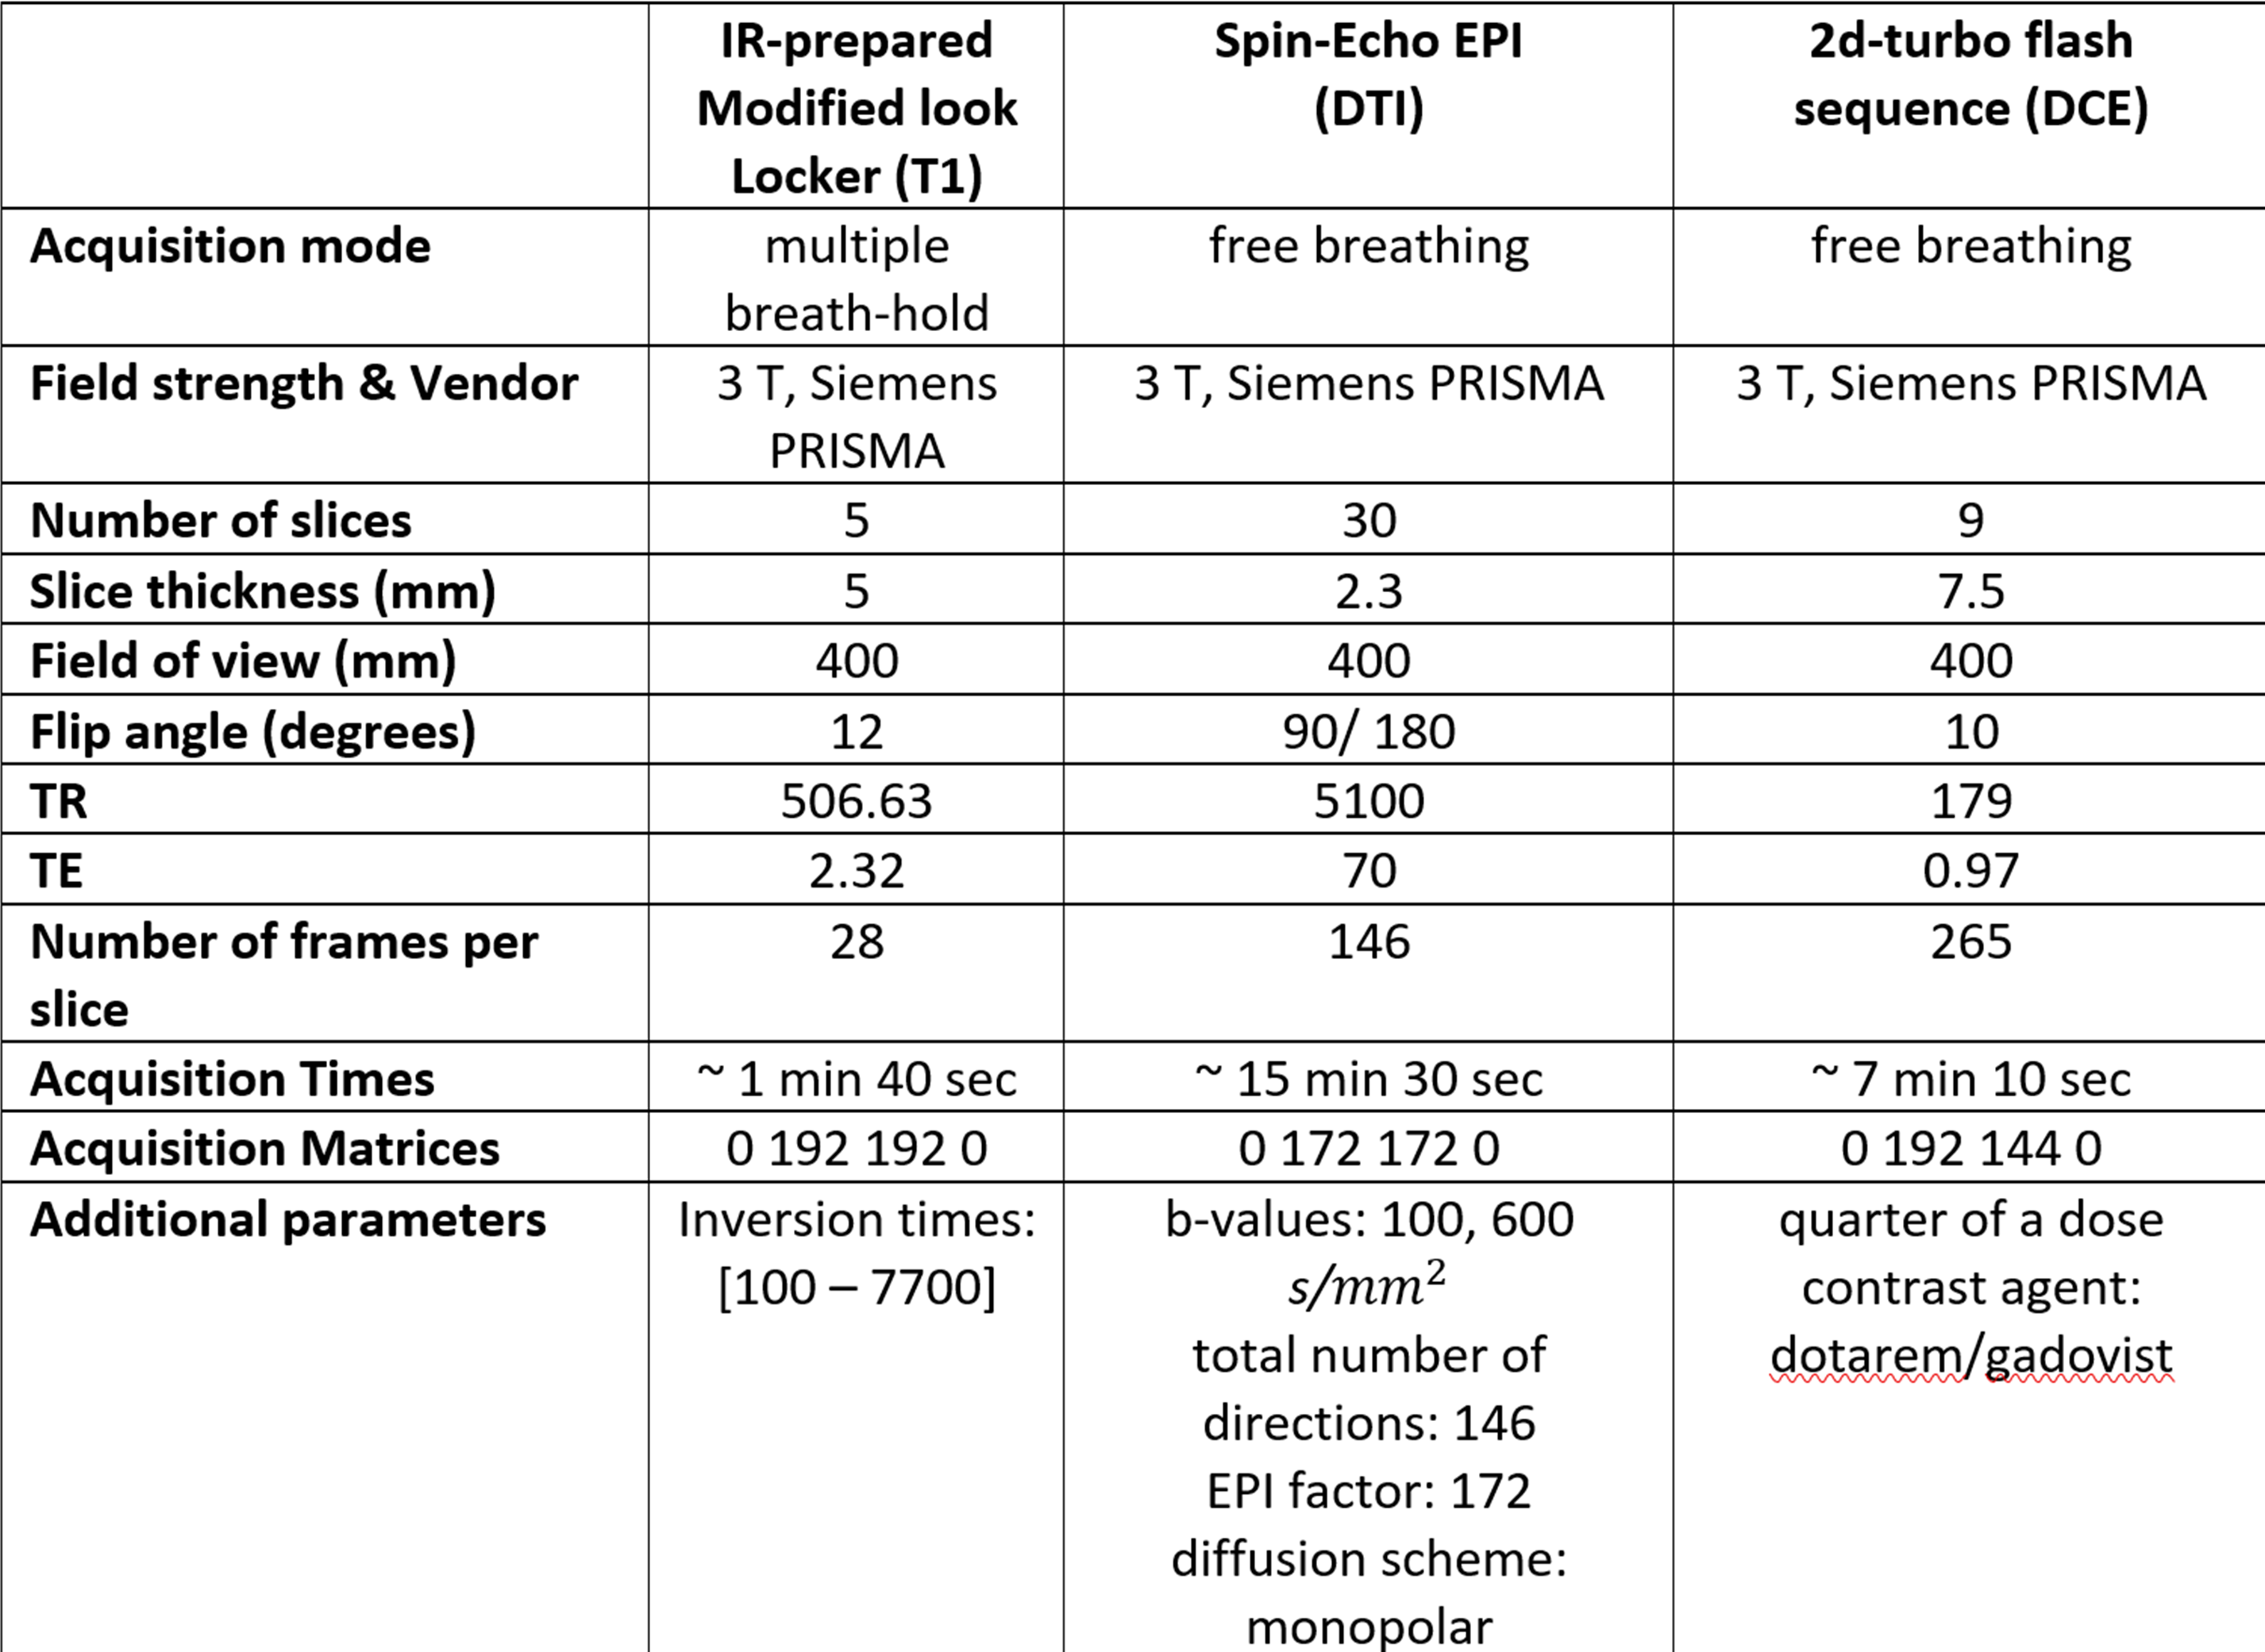
Data acquisition: Breath hold T1-mapping as well as free-breathing DTI and DCE data were collected for 10 consecutive cases from the ongoing iBEAt study [9]. Subjects were scanned in the morning after an overnight fast, and standardized meal and fluid intake on a Siemens Prisma 3T MRI scanner (sequence parameters in table 1).Data processing: The middle slice from each acquired sequence was motion corrected, using a laptop PC (intel core i7-6600U CPU @ 2.60GHz, 8 GBs of RAM). The algorithms were implemented in Python 3.6.0. MDR iterates two steps: (1) for each pixel, the MRI signal model is fitted to the co-registered time series; (2) for each time point, the co-registered image is updated by co-registering the acquired image with the model fit. Co-registration was performed in Elastix [10] using 2D free-form deformation with 2nd order B-splines, 4 resolution levels, linear interpolation of the displacement vectors, minimum grid spacing 16 mm, a mean square error metric and adaptive stochastic gradient descent. GMFR was implemented using Elastix [3,10] with the same parameters as MDR except for the similarity metric and the use of a stack transform.
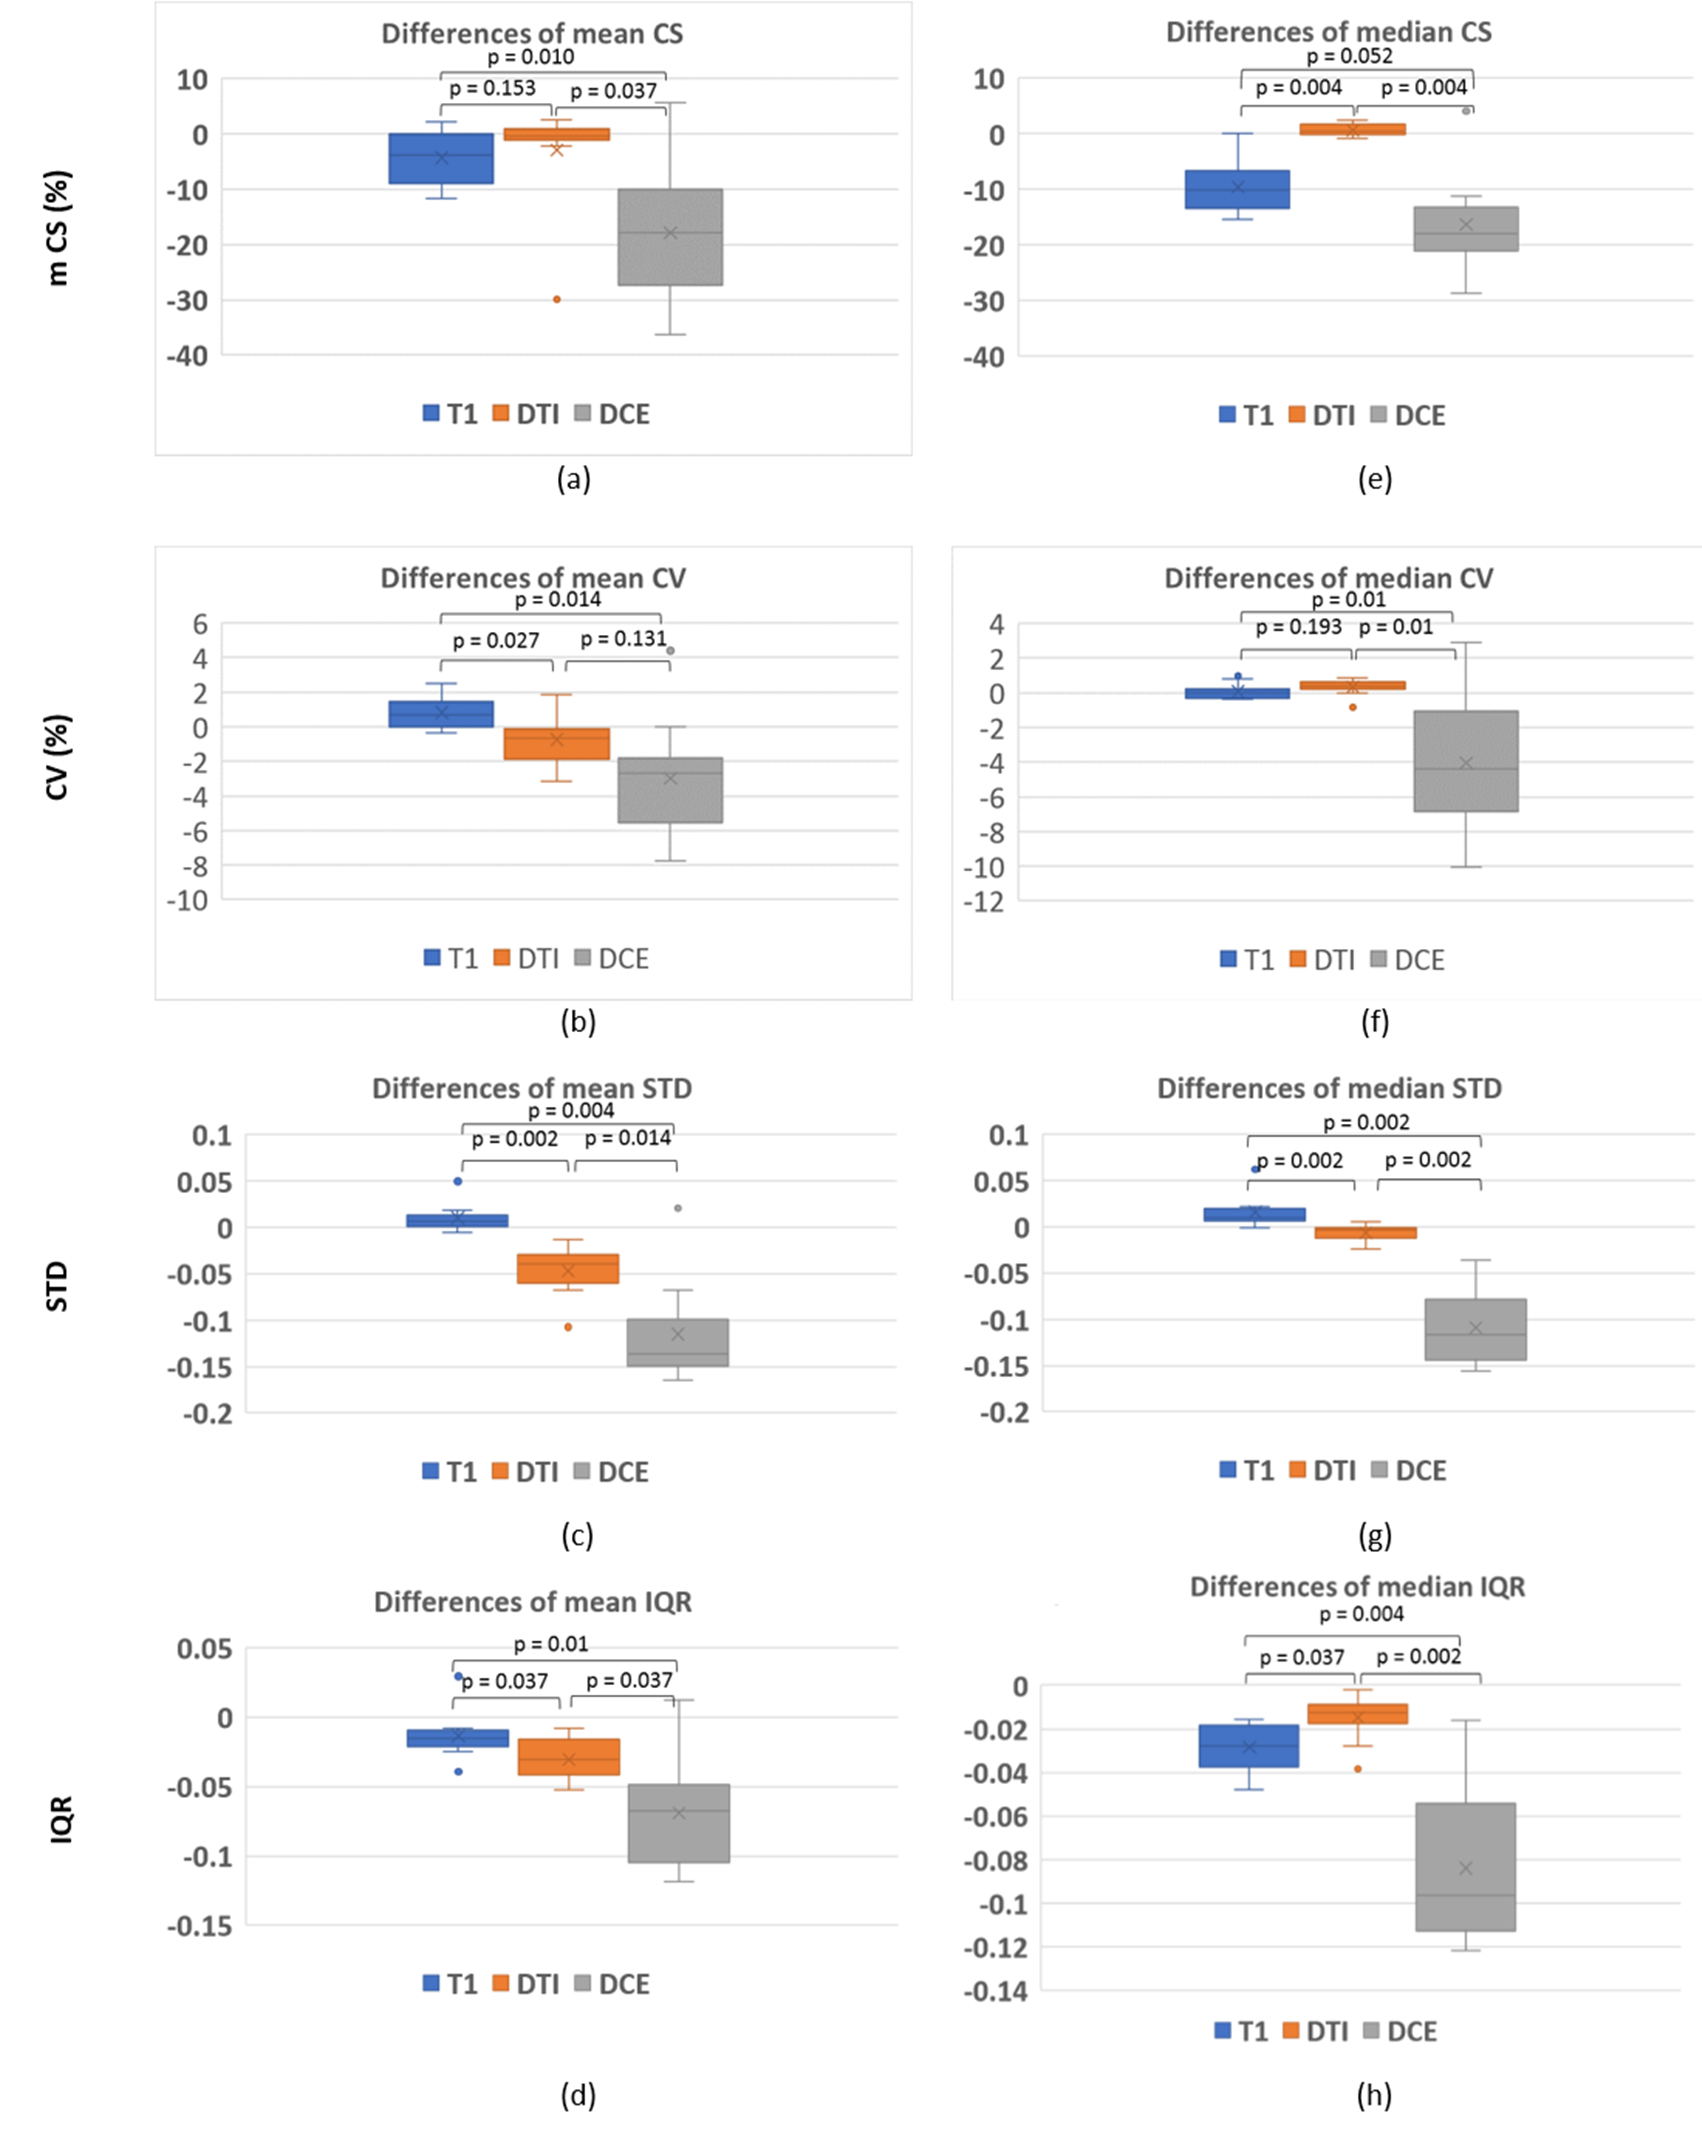
Evaluation metrics: Quality of motion correction was measured with 4 metrics calculated on the co-registered signals: chi-square difference with the model fit (CS), coefficient of variation (CV) defined as the standard deviation relative to the mean, standard deviation (STD) of the 2nd derivative and the interquartile range (IQR). Each metric was calculated pixelwise, after which average and median were determined over a rectangular ROI encompassing both kidneys.
Statistical analysis: A Wilcoxon signed rank test was used to determine whether: (1) a given metric was significantly different between MDR and GMFR; (2) the difference between MDR and GMFR was dependent on contrast mechanism (T1, DTI, DCE). Statistical significance was defined at p<0.05 and a Bonferroni correction was applied.
Results
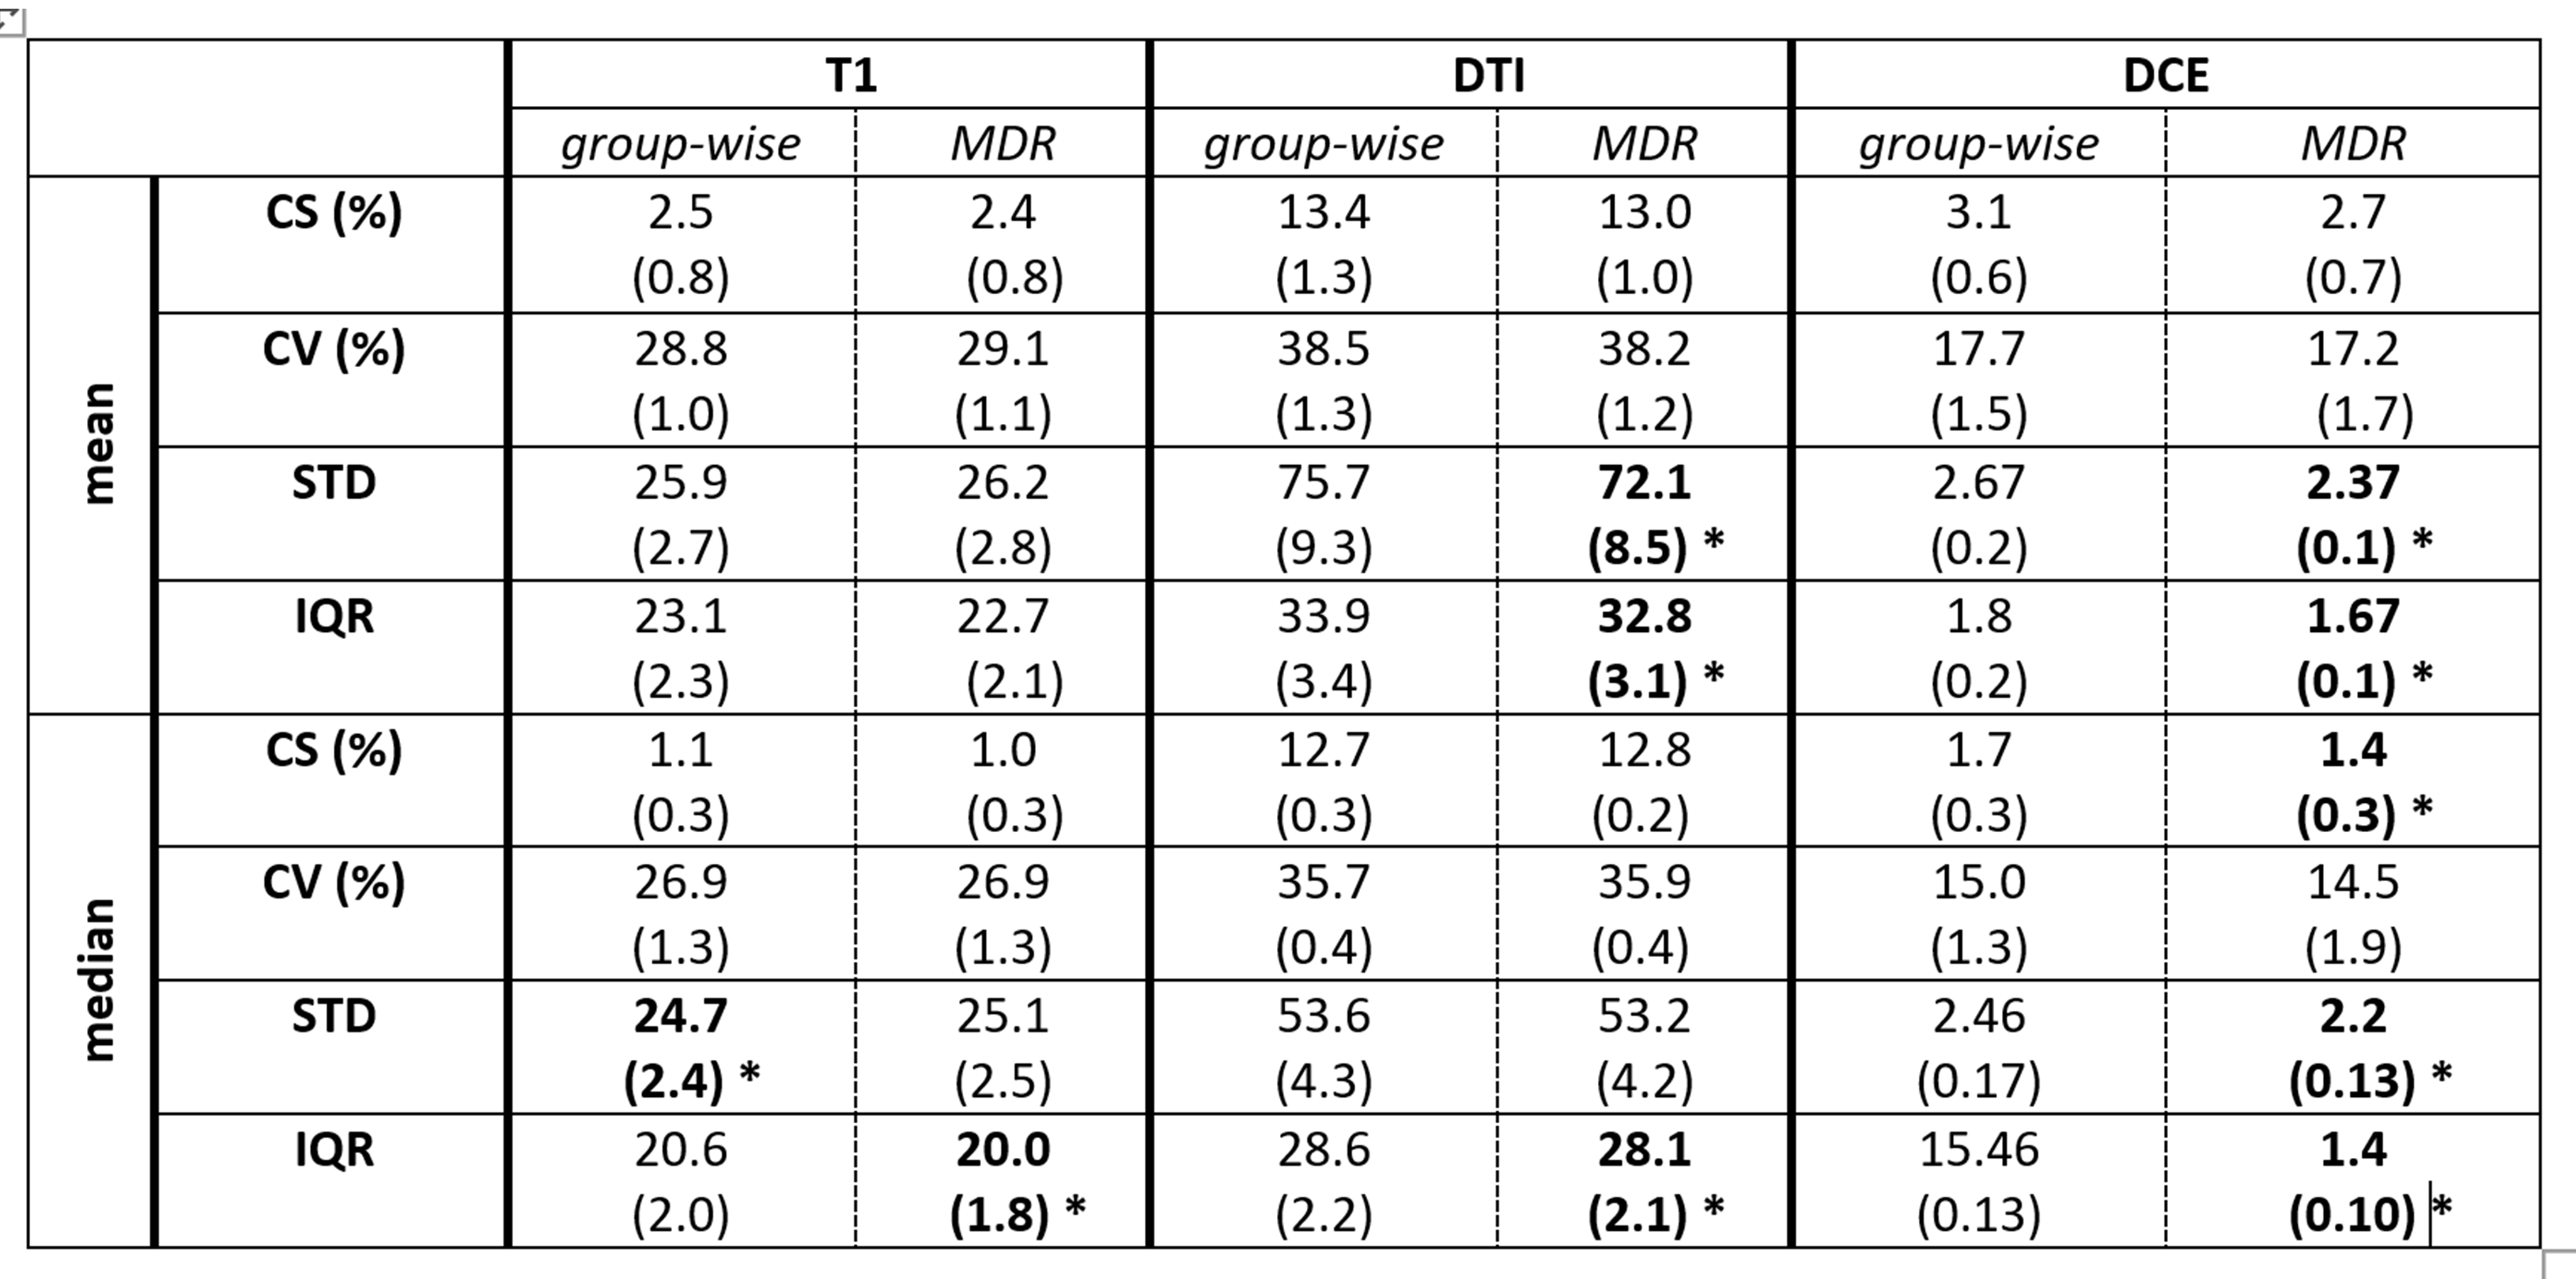
Table 2 compares the average values of all metrics between both methods, showing a significant difference in 10 out of 24 cases. MDR scored best in 9 of these 10 cases including all DTI and DCE metrics.Figure 1 shows the difference between MDR and GFMR for all metrics and all 3 contrast mechanisms. The figure shows that in most cases MDR scores better (difference < 0) and that the improvement is most substantial in DCE.
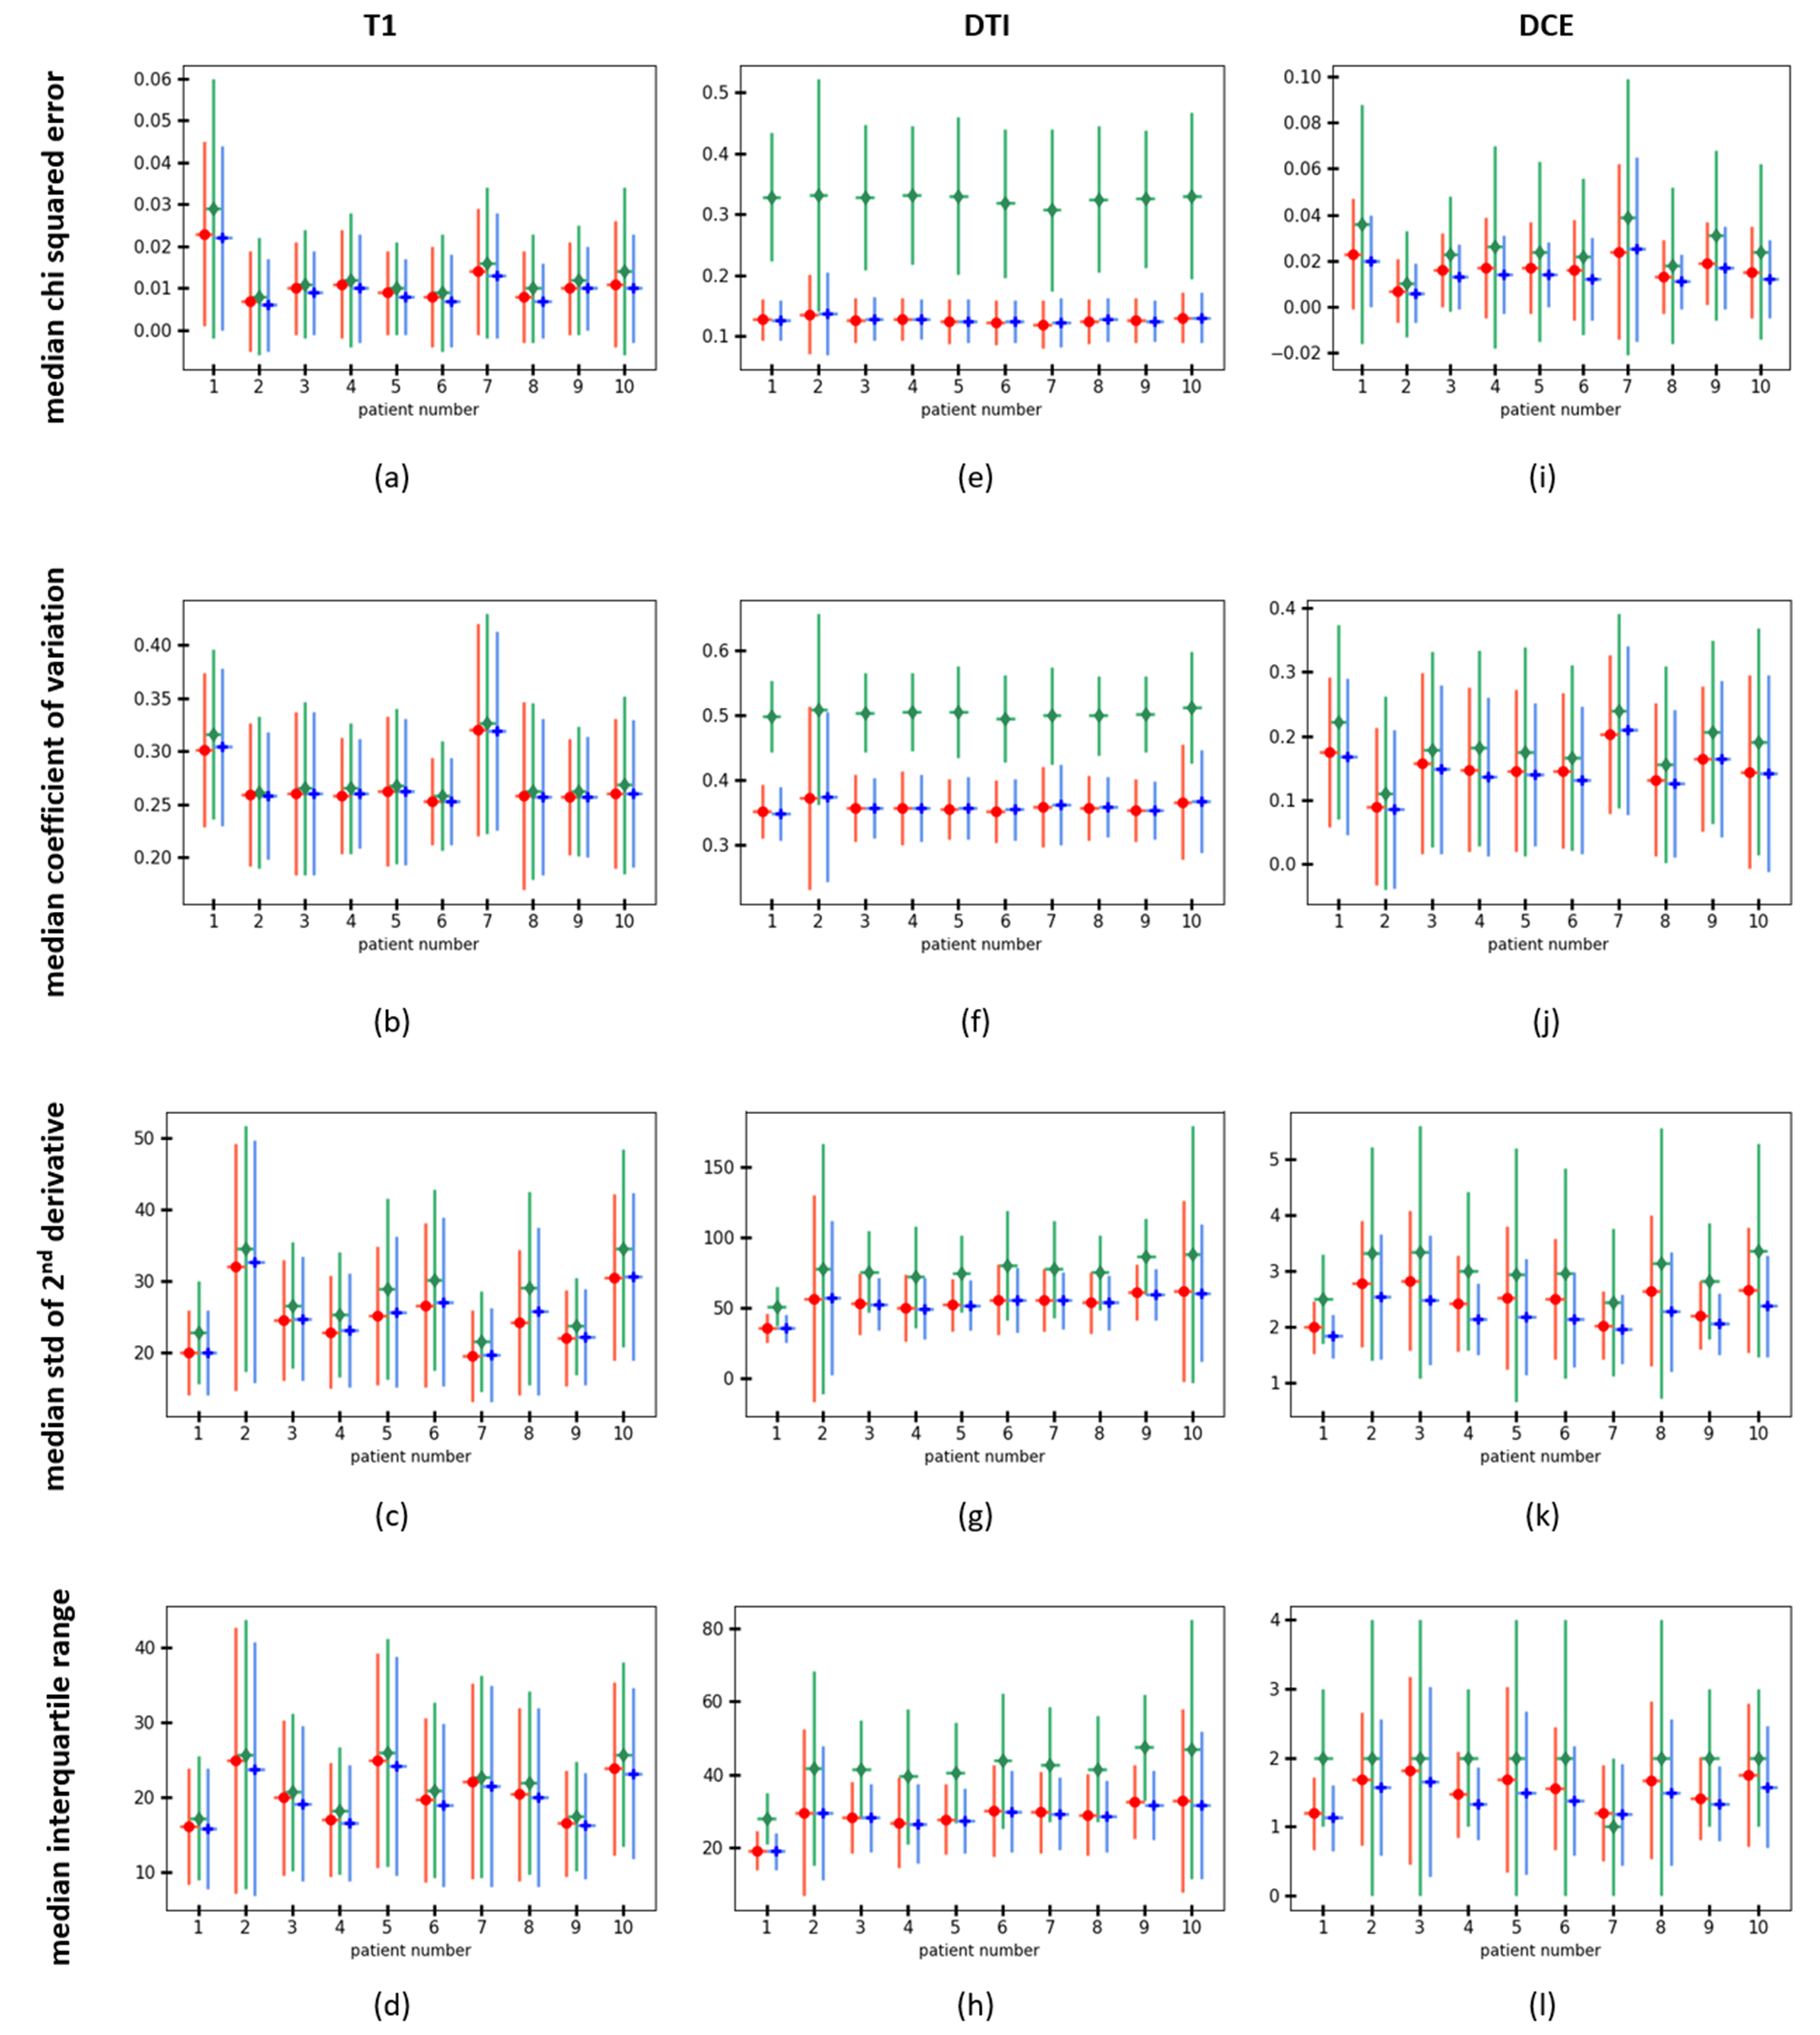
Figure 2 shows the distribution of the median metrics on single pixel level for all 10 subjects, demonstrating that all effects are consistent between subjects and that MDR and GFMR both offer a substantial improvement compared to the unregistered state.
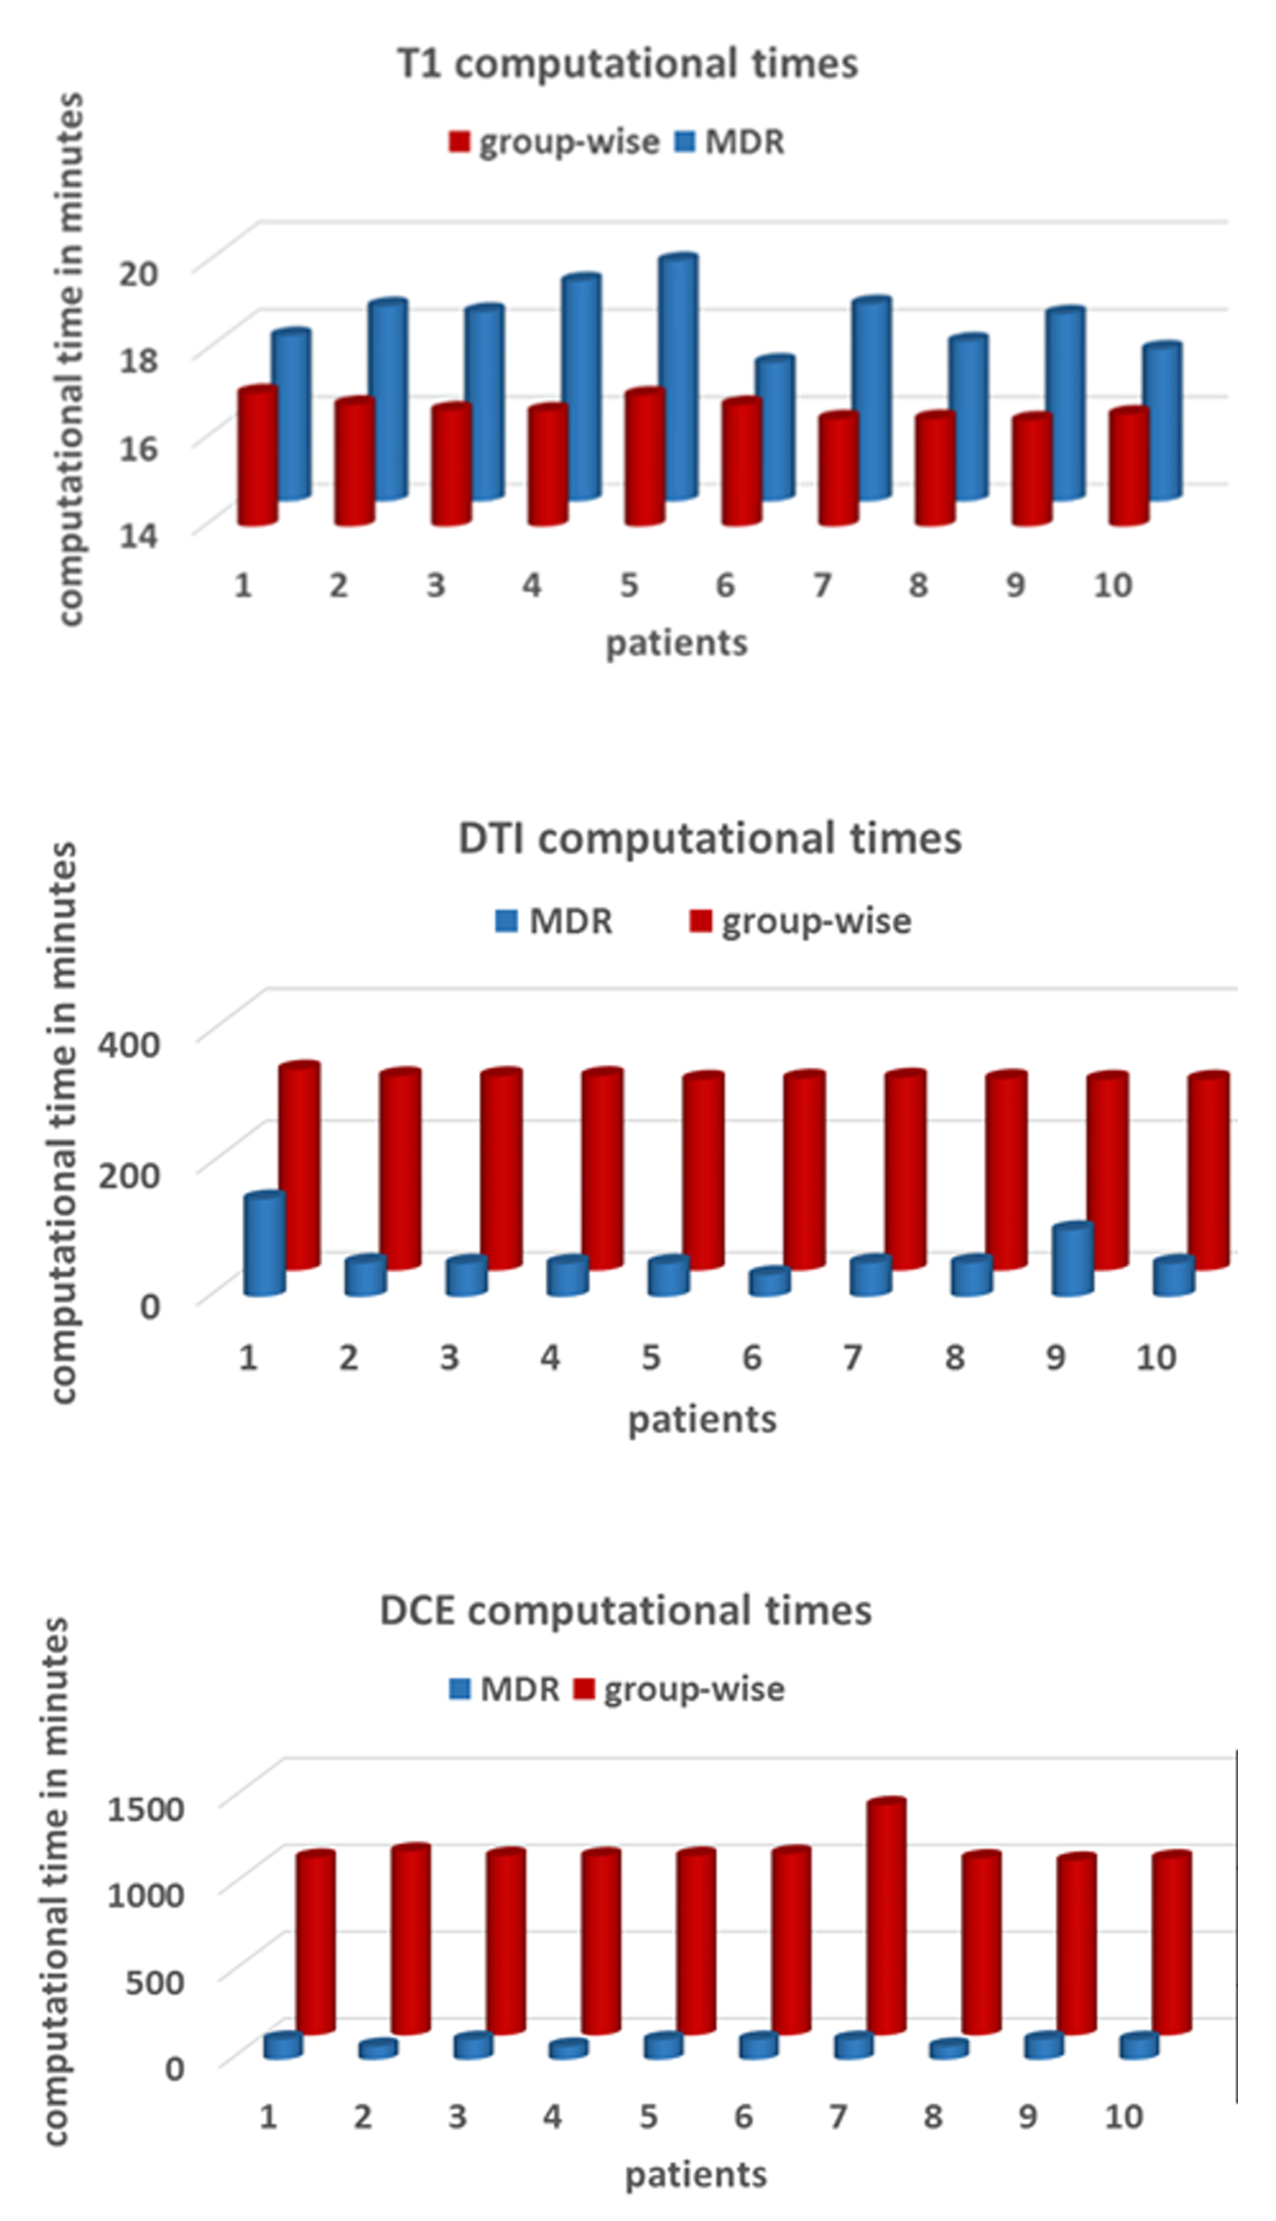
Figure 3 shows that, on the whole, MDR is substantially faster than GMFR and that the difference is larger in computationally heavy problems. For T1-mapping, GMFR is on average 1.5 min faster than MDR (16.7 vs 18.2 min per subject); but for DTI, MDR is 230 min faster than GMFR (63 vs 293 min per subject) and for DCE, MDR is 955 min faster than GMFR (103 vs 1059 min per subject).
Discussion
The results confirm the hypothesis that MDR is a more suitable approach than GMFR in the context of quantitative imaging: MDR scores better on the majority of metrics and offers a substantial gain in computation times. The difference between both methods is relatively minor in T1-mapping, which was performed in breath hold in this study and involved a relatively small number of time points. In this application GMFR offered a marginal (1.6%) improvement over MDR in 1 out of 8 metrics and a gain of 1.5 min computation time. However, this minor benefit is offset by the more substantial differences in DTI and especially DCE, which were performed in free breathing and were much larger datasets. Here the metrics showed differences up to 20% in favour of MDR and a reduction in computation time of up to 17.6 hrs per slice.Conclusion
Model-driven registration outperforms a state-of-the-art model-free method for motion correction of quantitative MRI in the kidney. We anticipate that the benefits of MDR may translate to other applications, but this remains to be demonstrated.Acknowledgements
The iBEAt study is part of the BEAt-DKD project. The BEAt-DKD project has received funding from the Innovative Medicines Initiative 2 Joint Undertaking under grant agreement No 115974. This Joint Undertaking receives support from the European Union’s Horizon 2020 research and innovation programme and EFPIA with JDRF. For a full list of BEAt-DKD partners, see www.beat-dkd.eu.References
1. MELBOURNE A. et al 2007. Registration of dynamic contrast-enhanced MRI using a progressive principal component registration (PPCR). Physics in Medicine & Biology, 52, 5147.
2. HAMY V. et al 2014. Respiratory motion correction in dynamic MRI using robust data decomposition registration–Application to DCE-MRI. Medical image analysis, 18, 301-313.
3. HUIZINGA W. et al. 2016. PCA-based groupwise image registration for quantitative MRI. Med Image Anal, 29, 65-78
4. ADLURU G. et al. 2006. Model‐based registration for dynamic cardiac perfusion MRI. Journal of Magnetic Resonance Imaging, 24, 1062-1070
5. BUONACCORSI, G. A. et al 2007. Tracer kinetic model–driven registration for dynamic contrast‐enhanced MRI time‐series data. Magnetic Resonance in Medicine, 58, 1010-1019.
6. XUE, H. et al. 2012. Motion correction for myocardial T1 mapping using image registration with synthetic image estimation. Magn Reson Med, 67, 1644-55.
7. FLOURI, D. et al 2020. Improved fetal blood oxygenation and placental estimated measurements of diffusion-weighted MRI using data-driven Bayesian modeling. Magn Reson Med, 83, 2160-2172
8. DE BOER, A. et al 2020. Multiparametric Renal MRI: An Intrasubject Test-Retest Repeatability Study. J Magn Reson Imaging, Apr 16. doi: 10.1002/jmri.27167 [Online ahead of print].
9. GOODING K. M. et al 2020. Prognostic Imaging Biomarkers for Diabetic Kidney Disease (iBEAt): Study protocol. BMJ Nephrol. 21: 242
10. KLEIN S, et al elastix: a toolbox for intensity-based medical image registration. IEEE Trans Med Imaging. 2010;29(1):196-205. doi:10.1109/TMI.2009.2035616.
Figures