1376
Comprehensive Analysis of FatNav Motion Parameters Estimation Accuracy in 3D Brain Images Acquired at 3T
Elisa Marchetto1,2, Kevin Murphy1,3, and Daniel Gallichan1,2
1Cardiff University Brain Research Imaging Centre (CUBRIC), Cardiff University, Cardiff, United Kingdom, 2School of Engineering, Cardiff University, Cardiff, United Kingdom, 3School of Physics, Cardiff University, Cardiff, United Kingdom
1Cardiff University Brain Research Imaging Centre (CUBRIC), Cardiff University, Cardiff, United Kingdom, 2School of Engineering, Cardiff University, Cardiff, United Kingdom, 3School of Physics, Cardiff University, Cardiff, United Kingdom
Synopsis
FatNav motion-parameter estimation relies on GRAPPA reconstruction of the highly accelerated navigator fat-volumes, which might be compromised by strong changes in the head position. Data from three MPRAGE brain images have been used to find the motion corresponding to four image quality boundaries and assess motion tolerance when FatNavs are used. Results suggests that FatNavs can compensate for a large range of motion artifacts compared to when no motion correction is applied. Better correction is expected if GRAPPA weights are updated throughout the entire duration of the scan.
Introduction
A retrospective motion correction technique for brain MRI images has been proposed by Gallichan et al.1 to detect and correct non-deliberate motion during high resolution imaging, that uses the natural sparsity of fat-images to apply the GRAPPA2 parallel imaging technique to acquire highly accelerated navigator fat-volumes (FatNavs). However, GRAPPA reconstruction is not expected to perform well on FatNav volumes in the presence of strong motion due to the mismatched calibration data acquired once at the start of the scan. The compromised GRAPPA reconstruction is then expected to lead to motion-parameter misestimation. This study aims to assess FatNav accuracy in the presence of large changes in head position, analysing the relationship between the extent of the motion and the expected degradation in image quality.Methods
Three datasets of 3D MPRAGE3 brain images have been acquired without deliberate motion on three different subjects using a Prisma scanner (Siemens Healthcare, Erlangen, Germany). During each acquisition, 3D FatNav volumes at 4mm isotropic resolution have been acquired as navigators. Autocalibration lines (ACS) for the FatNavs, acquired as a reference at the beginning of the scan, have been used for reconstruction of each FatNav. 225 rigid motion parameters evenly spaced between 0-20deg and 0-40mm have been applied to the first FatNav volume in the image domain using SPM (Statistical Parametric Mapping) realign tool. Negative displacement has been applied along the z-axis only, considering symmetry for the rotations and displacement along the other directions. FatNav volumes were then undersampled using an acceleration factor R=16 (4x4) and re-reconstructed using GRAPPA, to simulate the final corrupted FatNav volume. By re-registering the corrupted and the reference FatNav volume using SPM, the mis-estimation of motion parameters was found and averaged between datasets for the full range of parameters considered. Applying linear interpolation, it is possible to use this data to estimate the ‘residual motion’ that would result from any given ‘true motion’ curves, where the residual motion curves represent the apparent head motion after FatNav correction. Smoother and rougher motion curves with root-mean-square (RMS) values between 0-20deg and 0-40mm were randomly generated 100 times for each dataset. After the interpolation step, the corresponding residual motion curves were applied to the original brain images without deliberate motion using RetroMoCoBox (https://github.com/dgallichan/retroMoCoBox), to simulate the expected degradation in image quality that would be expected if FatNavs were used. Two observers evaluated each image with a 1-4 rating scale, from 4=no visible motion artefacts to 1=severe motion artefacts. Image quality was calculated using the gradient entropy, which has been found by McGee et al.4 as the best metric to measure the quality of shoulder MRI images. A linear regression model was fit between the RMS motion and the resulting image gradient entropy. Multinomial Logistic Regression between image evaluations and gradient entropy was performed, revealing how the probability of falling in an evaluation category changes based on entropy values. Predicted FatNav correction-quality was assessed by calculating the amount of motion that corresponds to each category boundary, combining logit and linear regression information. The level of motion corresponding to each category boundary has been evaluated twice: once assuming that the simulated motion was the true motion (i.e no FatNav correction applied) and once assuming that the simulated motion was the residual motion following FatNav correction. This allows a comparison of the expected increase in motion that can be tolerated when FatNav correction is used.Results
Figure 1 compares FatNav volumes before and after the GRAPPA ‘re-reconstruction’ step for different amounts of motion, showing that parallel imaging artifacts increase for larger changes in the head position. The multinomial logistic regression shows how the probability distribution changes based on the gradient entropy values. It was found that the relationship between rotational and translational motion and the gradient entropy is well described by a linear regression model, where rotational and translational motion are averaged separately along each direction. Figures 2 shows an MPRAGE image, where an example is shown falling into each image evaluation category. Related real and ‘residual motion’ are reported in Figure 3 and 4. Motion level at each category boundary is reported in Figure 5: FatNavs show a high tolerance to motion, whereas the image quality decreases faster for images without motion correction.Discussion
Although FatNavs have been demonstrated to correct for a large scale of motion, in the presence of strong head position changes the GRAPPA reconstruction of the FatNavs themselves will be compromised, leading to misestimation of the motion parameters. Nonetheless, our data suggest that motion that would be sufficient to lead to a category-2 rating (strong artifacts) can typically be corrected with FatNavs to a level corresponding to category-4 (no noticeable artifact). If a particular subject group are likely to move more than this, it may be necessary to adapt the FatNav acquisition to make it more robust to large motion, which is expected to be possible if the GRAPPA weights are dynamically updated during the scan.Conclusion
FatNavs have been shown to be able to correct for a wide range of motion levels, both for smooth and rough kinds of motion. Even greater robustness is expected by updating ACS lines throughout the scan.Acknowledgements
No acknowledgement found.References
- D. Gallichan, J. P. Marques, and R. Gruetter. Retrospective correction of involuntary microscopic head movement using highly accelerated fat image navigators (3D FatNavs) at 7T: 3D FatNavs for High-Resolution Retrospective Motion Correction. Magn. Reson. Med. 2016; vol. 75: 1030-1039.
- M. A. Griswold, P. M. Jakob, R. M. Heidemann, et al. Generalized autocalibrating partially parallel acquisitions (GRAPPA). Magn. Reson. Med. 2002; vol. 47: 1202-1210.
- JP Mugler, JR. Brookeman. Rapid three-dimensional T1-weighted MR imaging with the MPRAGE sequence. J Magn Reson Imaging. 1991; 1:561-7.
- K. P. McGee, A. Manduca, J. P. Felmlee, et al. Image Metric-Based Correction (Autocorrection) of Motion Effects: Analysis of Image Metrics. 2000; 11:174–181.
Figures
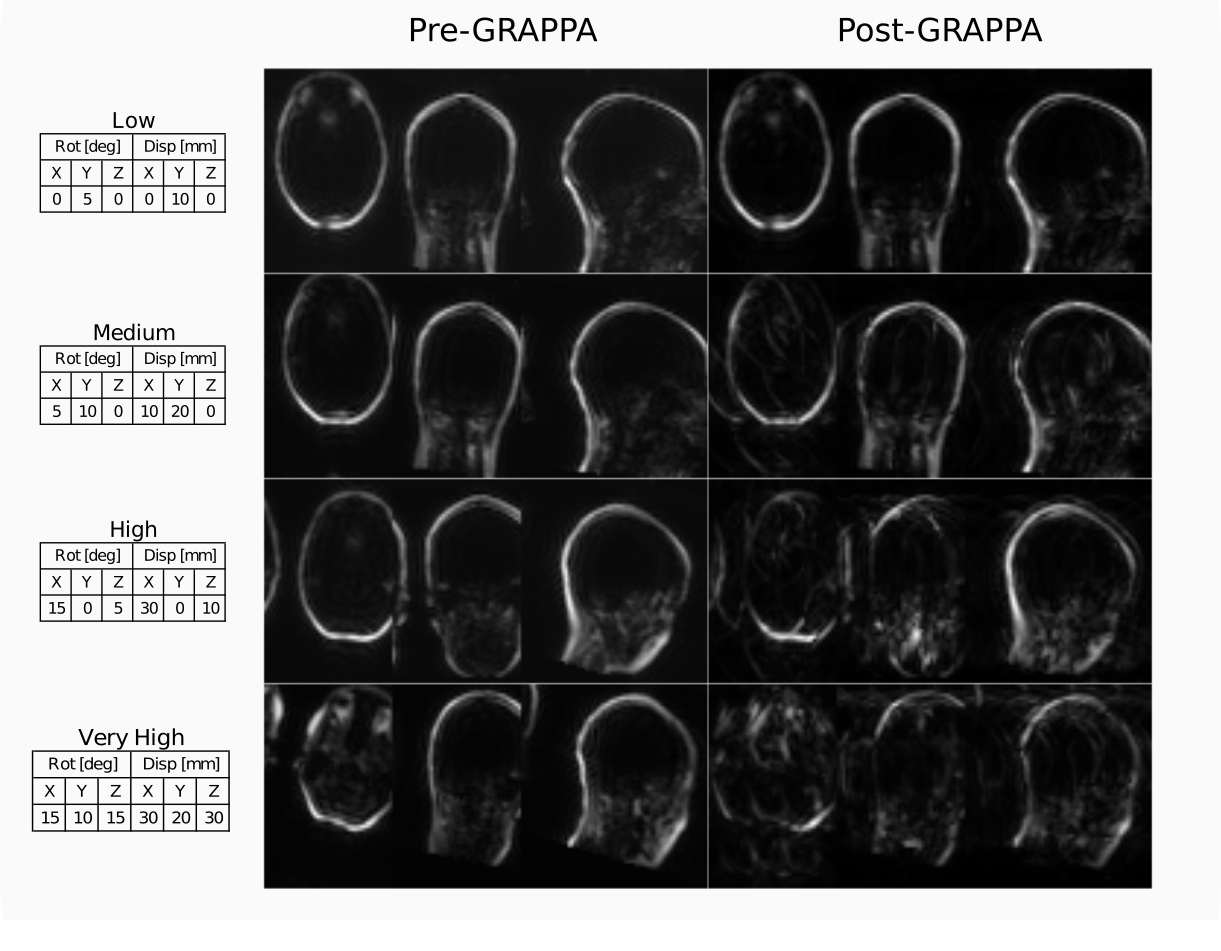
Figure
1. Comparison between FatNav volume before and after GRAPPA
‘re-reconstruction’, for four different amounts of motion (tables
on the left), to simulate effect of mismatched ACS data: parallel
imaging artifacts increase with the amount of motion.
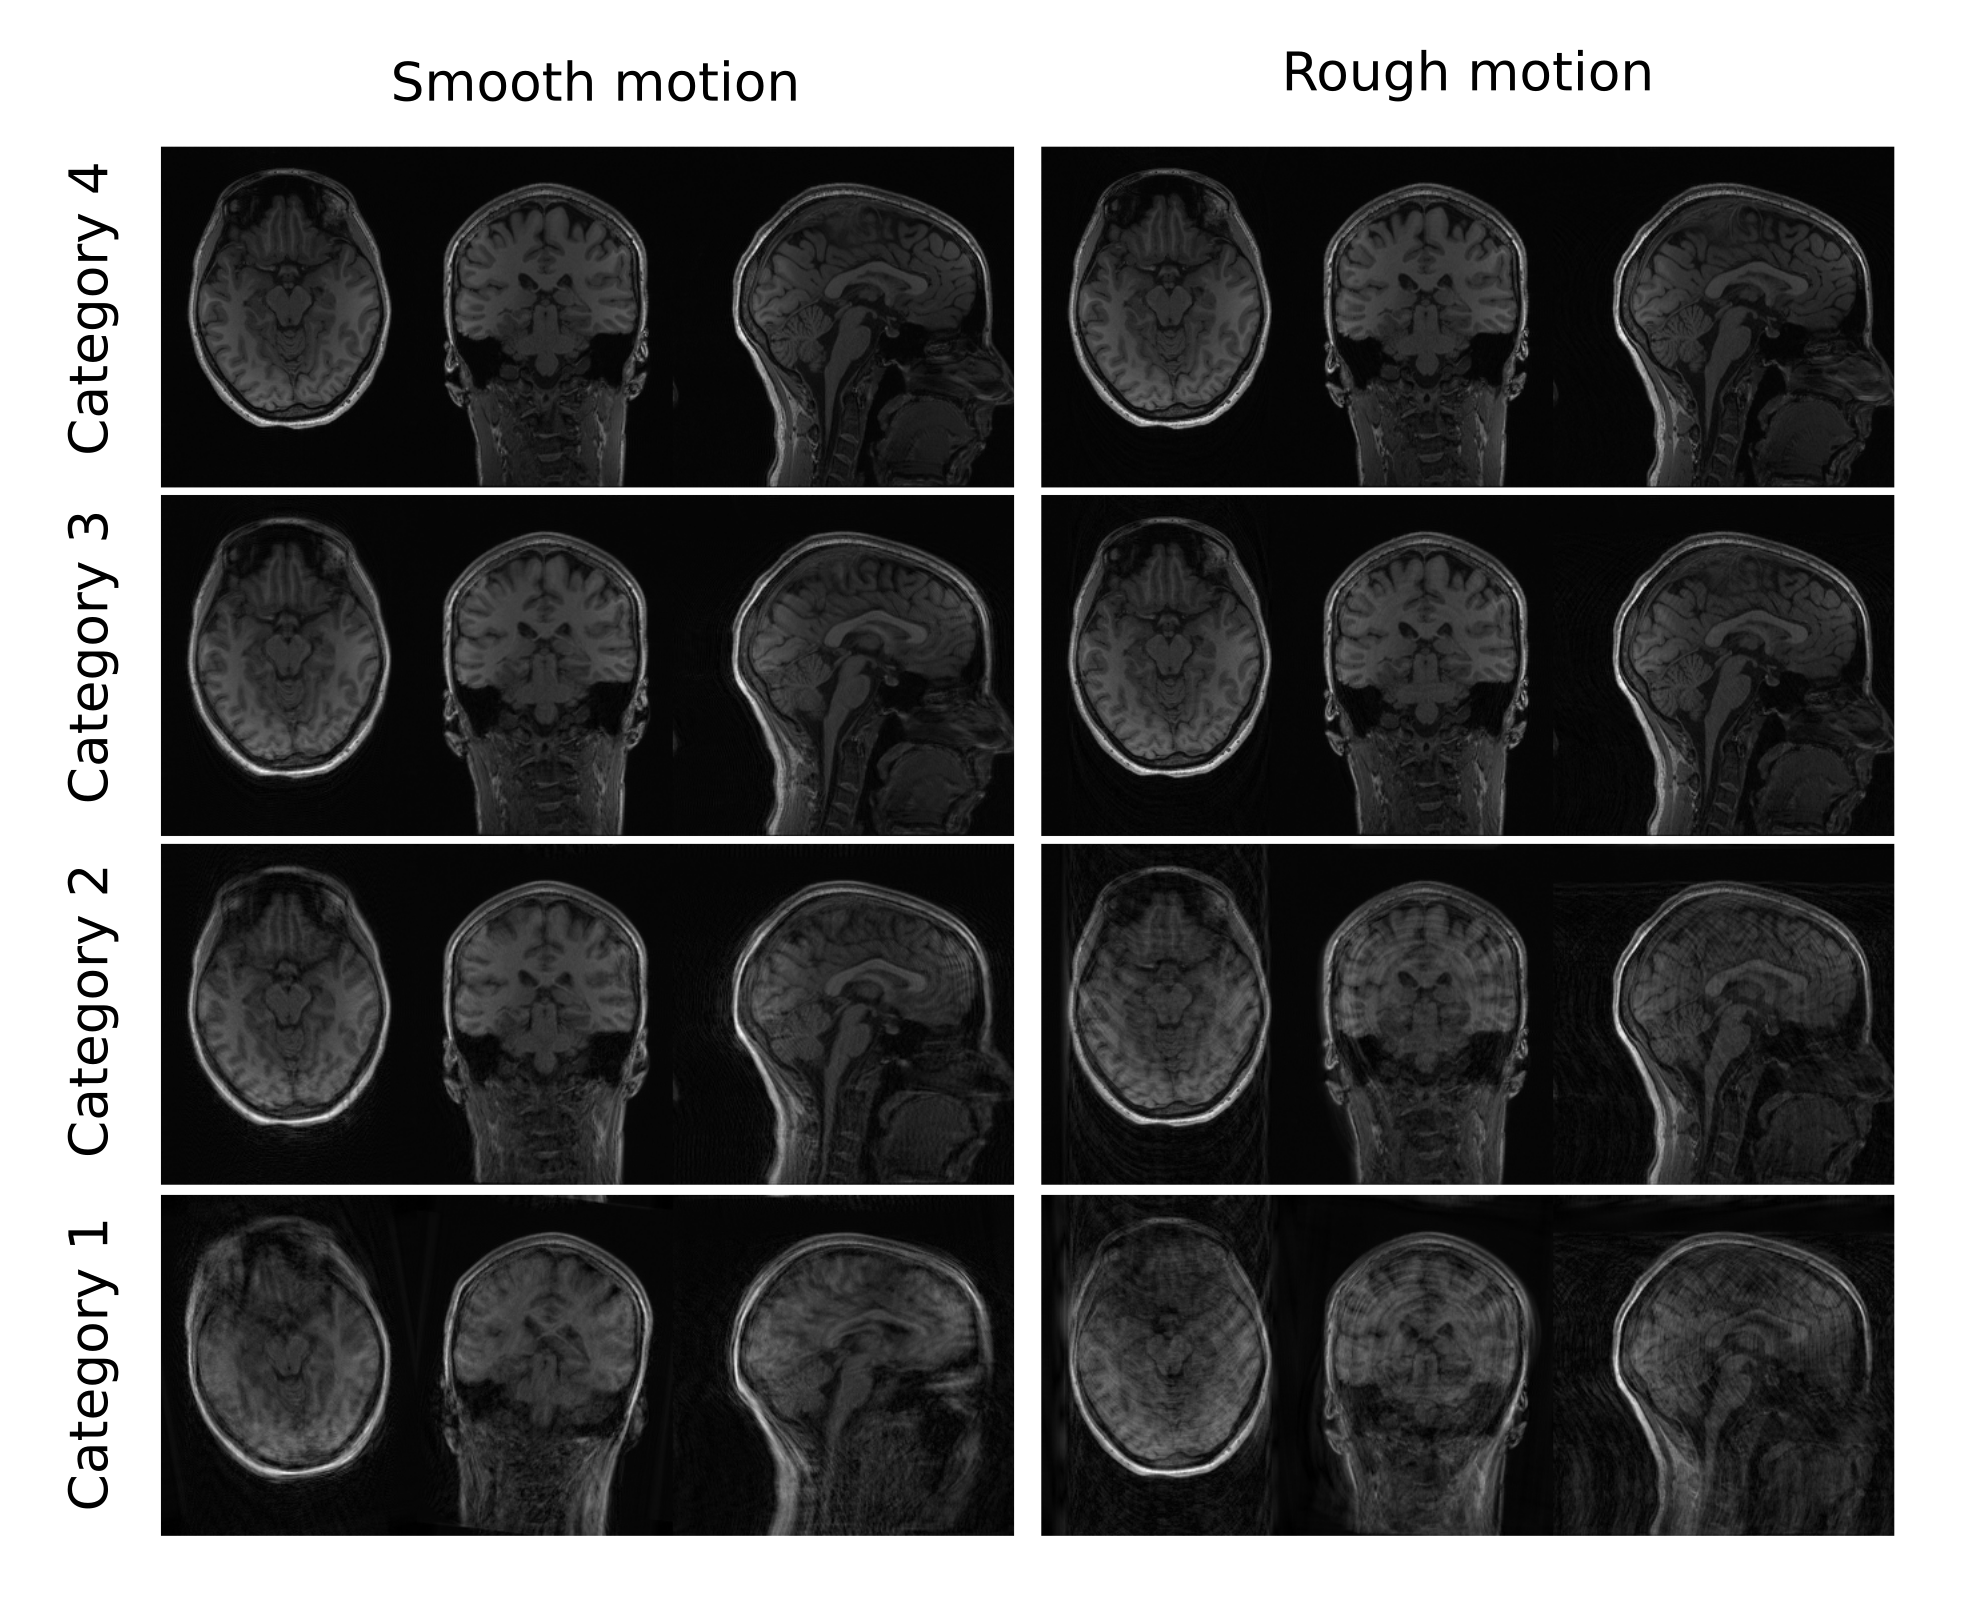
Figure
2. MPRAGE images affected by smooth (on the left) and rough (on the right) ‘residual
motion’, calculated by the interpolation step, each
falling in a different evaluation category: category 4=no motion
artifacts, 3=small motion artifacts, 2=strong motion artifacts,
1=severe motion artifacts. Relative real and ‘residual motion’
have been reported in Figure 3 and 4 for smooth and rough motion
respectively.
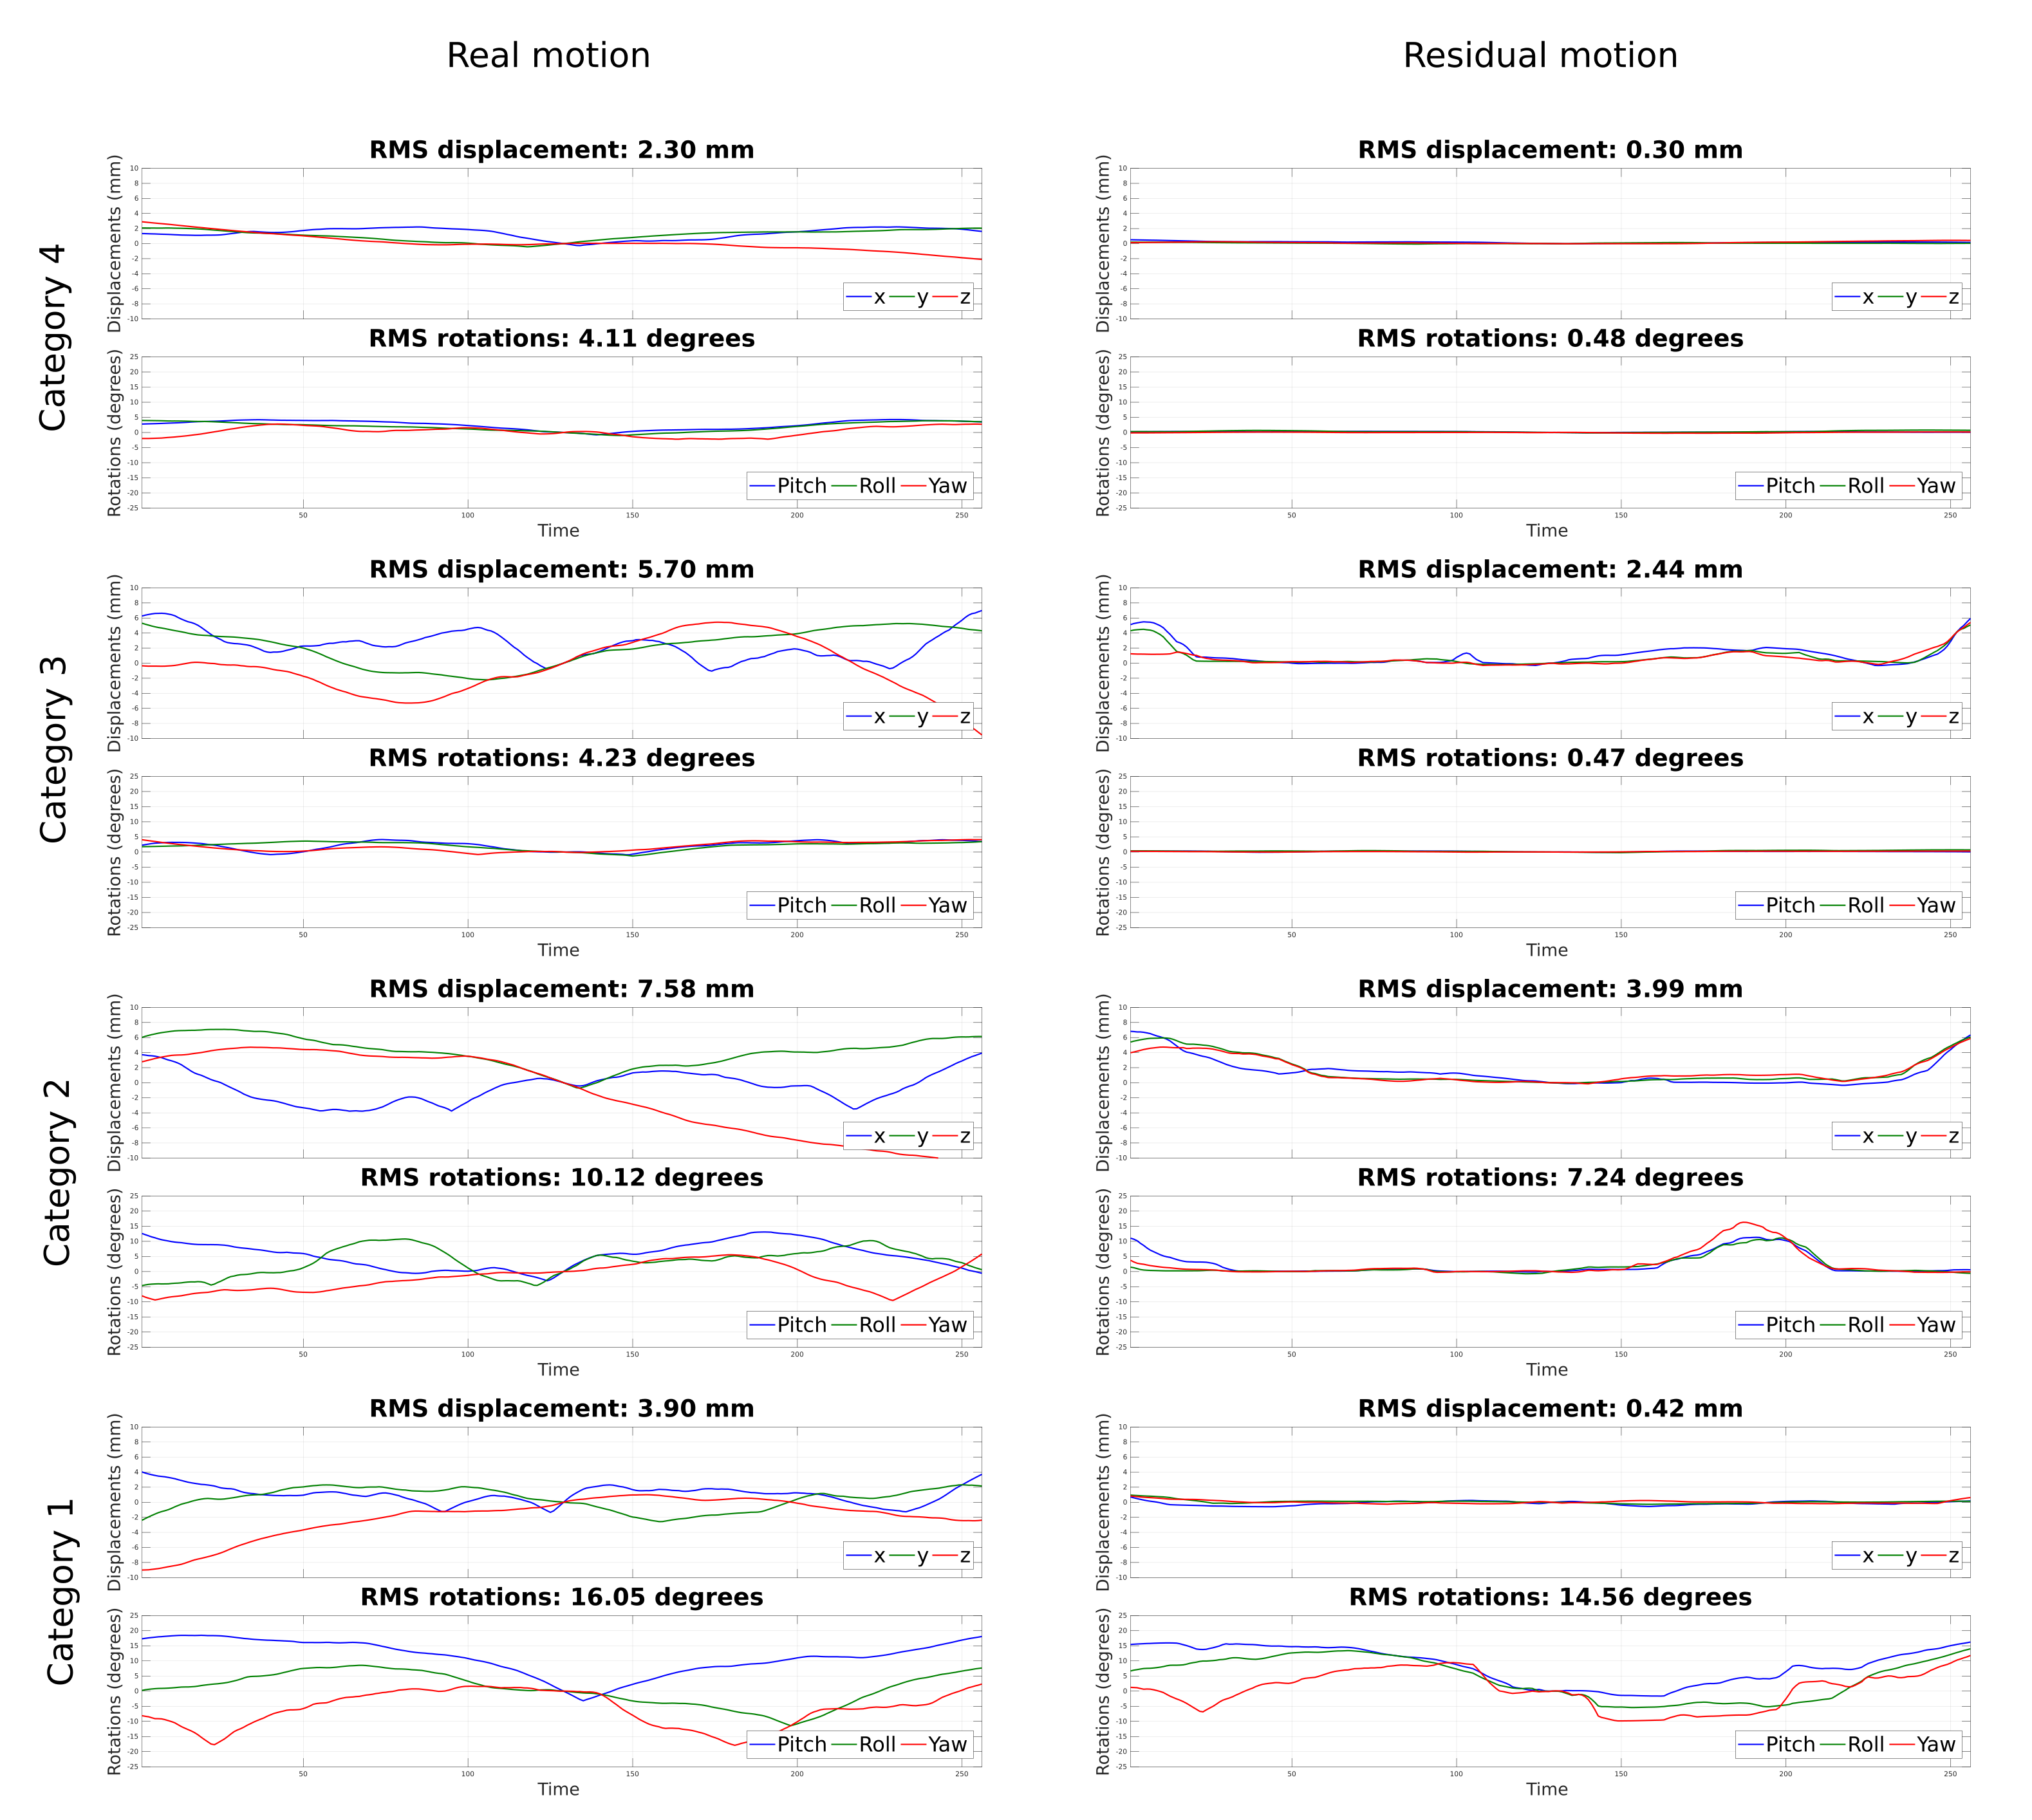
Figure
3. Comparison between real motion curves and the residual motion,
given after the interpolation step, in case of a smooth kind of
motion. The latter represent the apparent head motion after FatNav
correction of each correspondent MPRAGE image reported in Figure 2.
Root Mean Square (RMS) of rotational and translational motion
displays the overall amount of smooth motion applied throughout the
k-space, where smooth motion is defined by slow changes in the head
position.
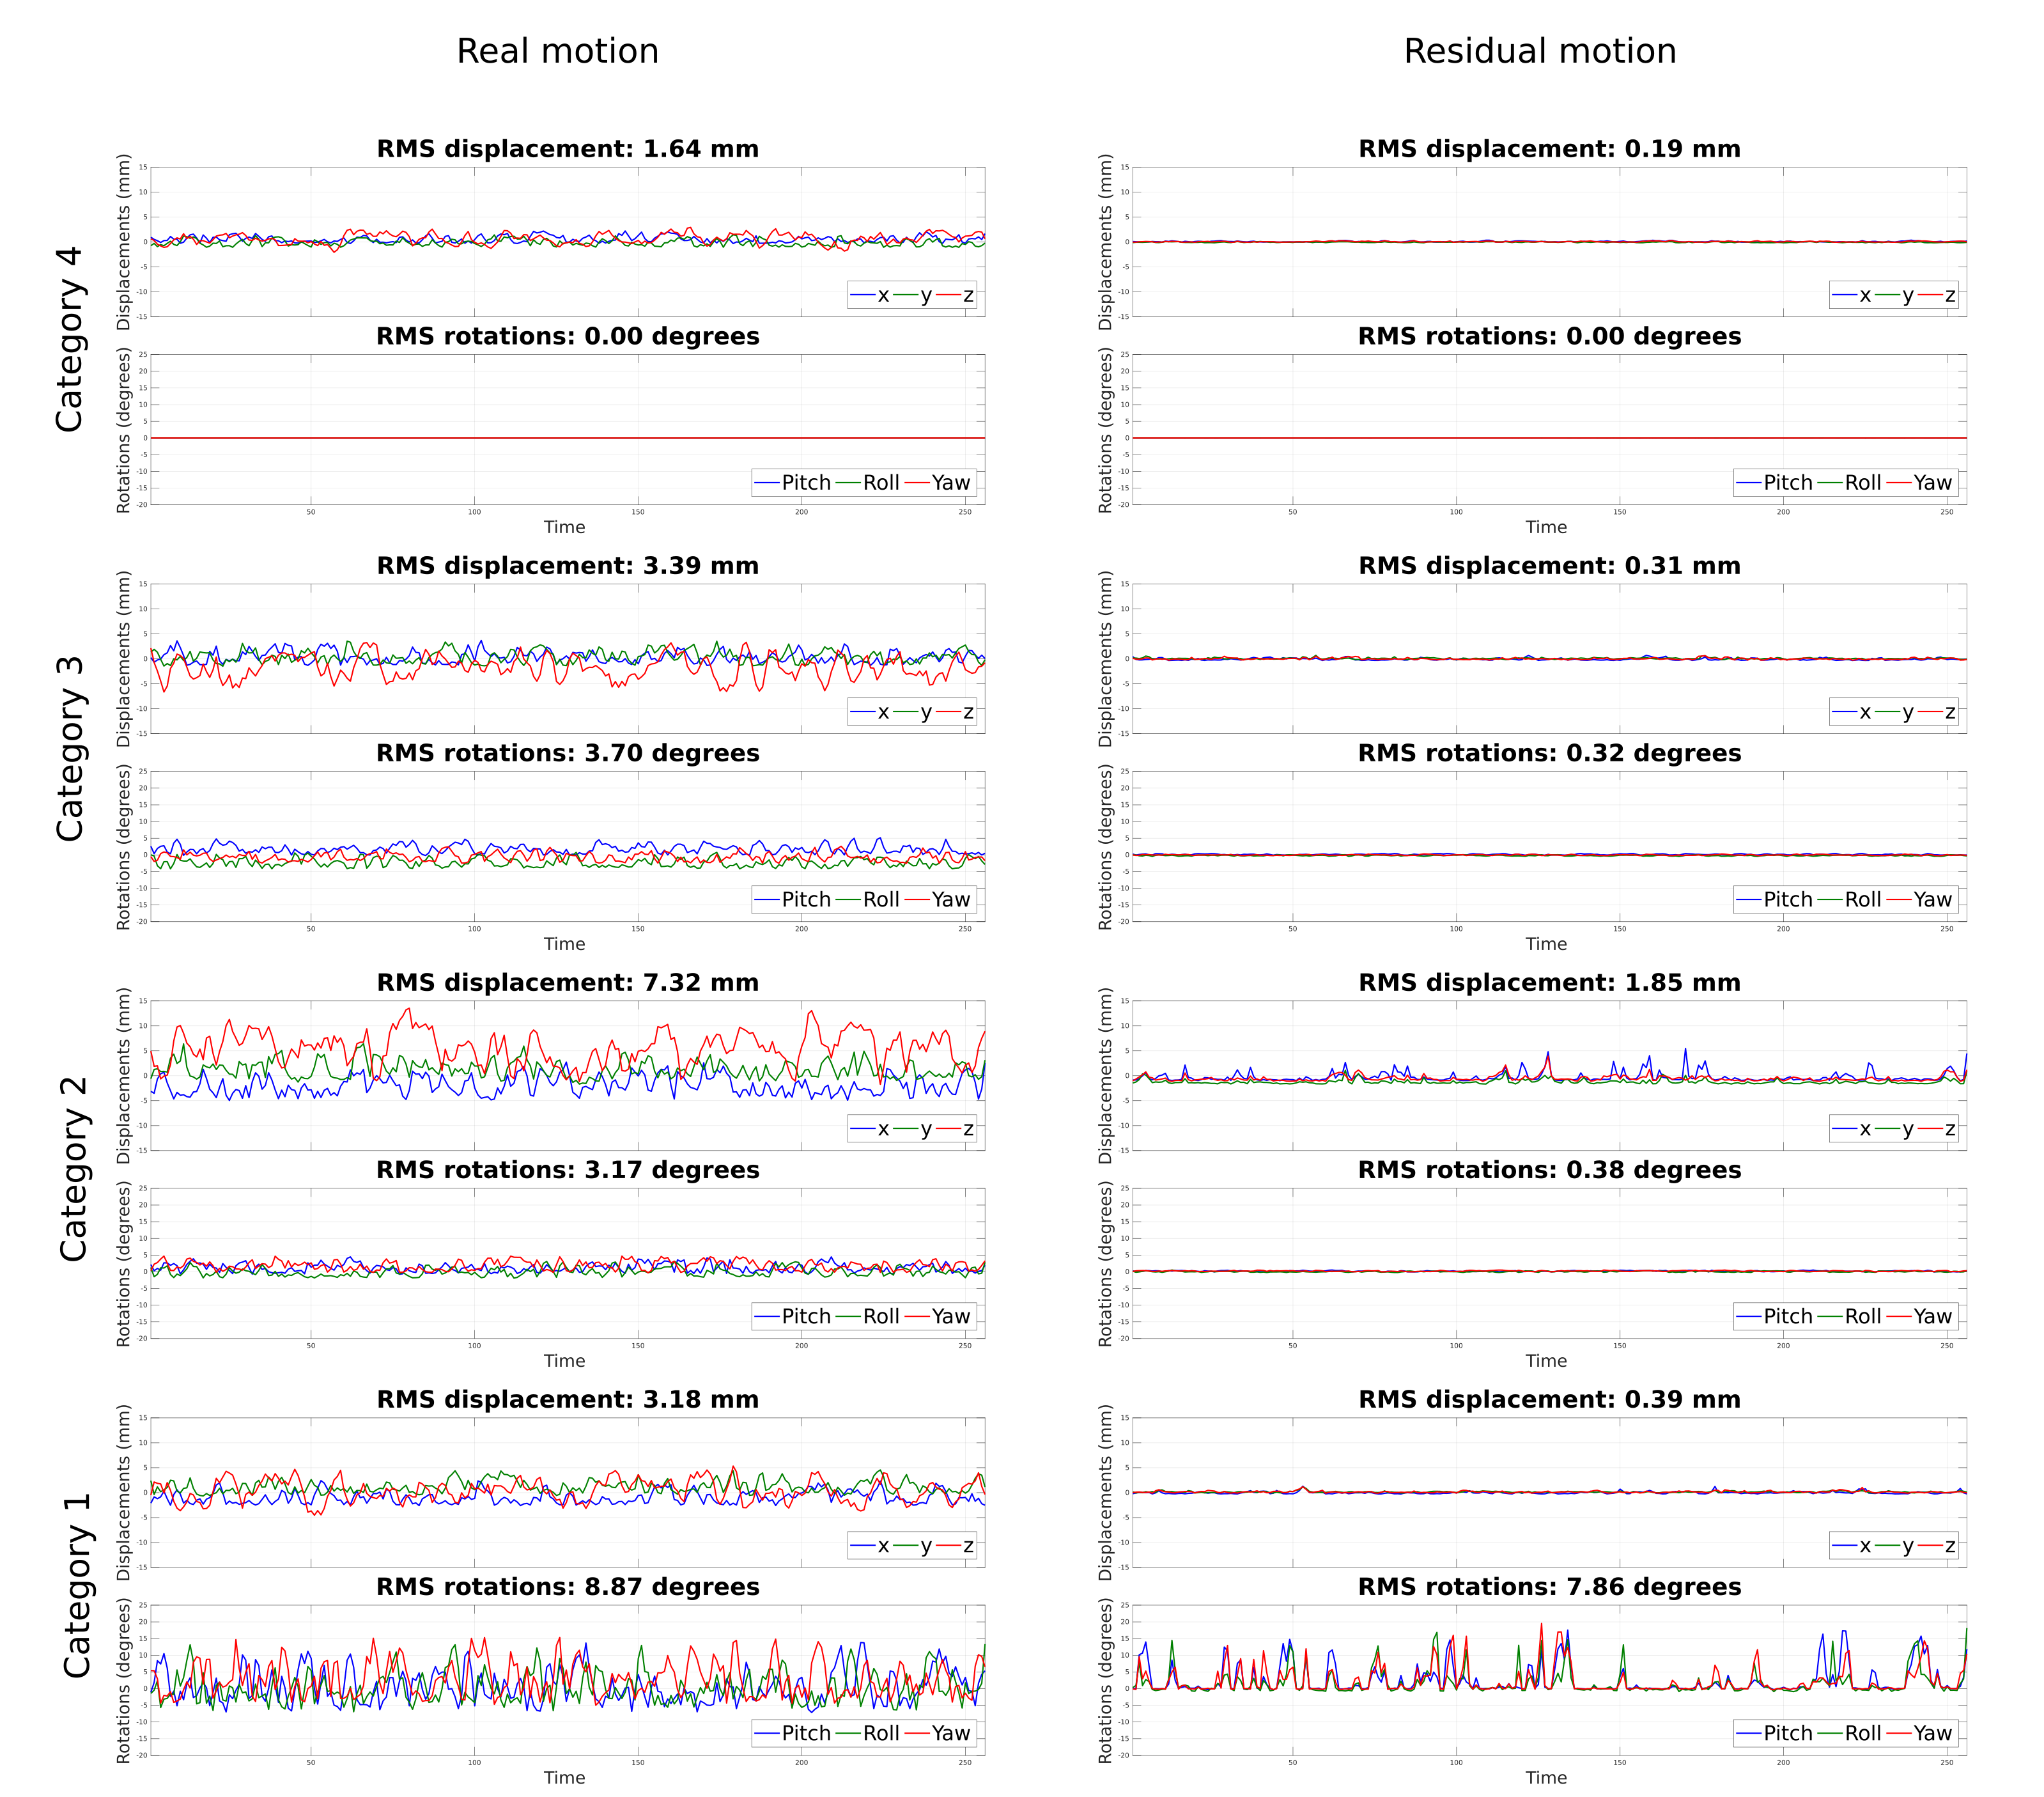
Figure
4. Comparison between real motion curves and the residual motion,
given after the interpolation step for a rougher kind of motion,
where the latter represent the apparent head motion after FatNav
correction of each correspondent MPRAGE image reported in Figure 2.
Rough motion is defined by rapid changes in the head position.
Relative RMS of rotational and translational motion is reported for
each motion curve, representing the overall amount of motion
occurring throughout the k-space.
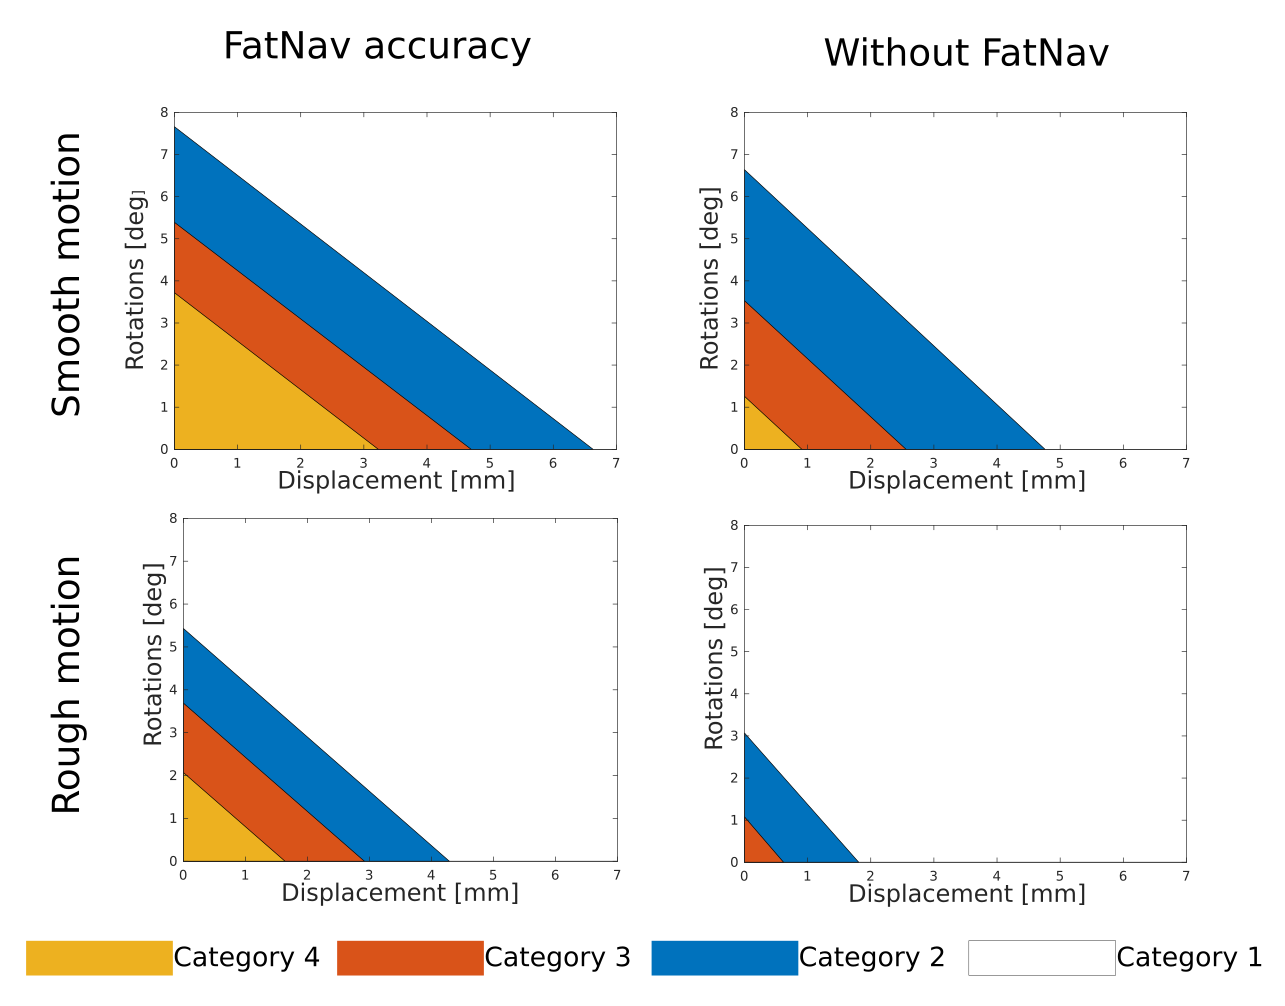
Figure
5. Each coloured region in the plot bounds the rotational and
translational motion parameters range for each evaluation category
after FatNav (left) and without motion correction (right), in case of
smooth (top row) and rough motion (bottom row). FatNavs can correct
very well for an RMS value, averaged along the three axes, of
~3.7°/3mm and 2°/1.6mm for smooth and rough motion respectively
(category 4 boundary); without motion correction, image quality drops
much more quickly (~1.2°/1mm).