1373
Cortical Mapping and T1-Relaxometry using Motion Corrected MPnRAGE: Test-Retest Reliability with and without Motion Correction1University of Wisconsin-Madison, Madison, WI, United States
Synopsis
A test-retest study of FreeSurfer cortical thickness, surface area, and volume, as well as cortical R1 relaxometry, was performed on pediatric subjects scanned without sedation using SNARE-MPnRAGE. Reliability was assessed with coefficients of variation (CoVs) and intraclass correlation coefficients (ICCs). When SNARE motion correction was used all parameters had statistically significant improvements and high reliability. For the mean (thickness/surface area/volume/R1) across the regions of FreeSurfer’s DK Atlas, the mean CoVs (% x100) were (1.2/1.6/1.9/0.9) and the mean ICCs were (0.88/0.96/0.94/0.83). When assessed on a per-vertex basis, the CoVs and ICCs for thickness/R1 had mean values of (2.9/1.9) and (0.82/0.68).
Background
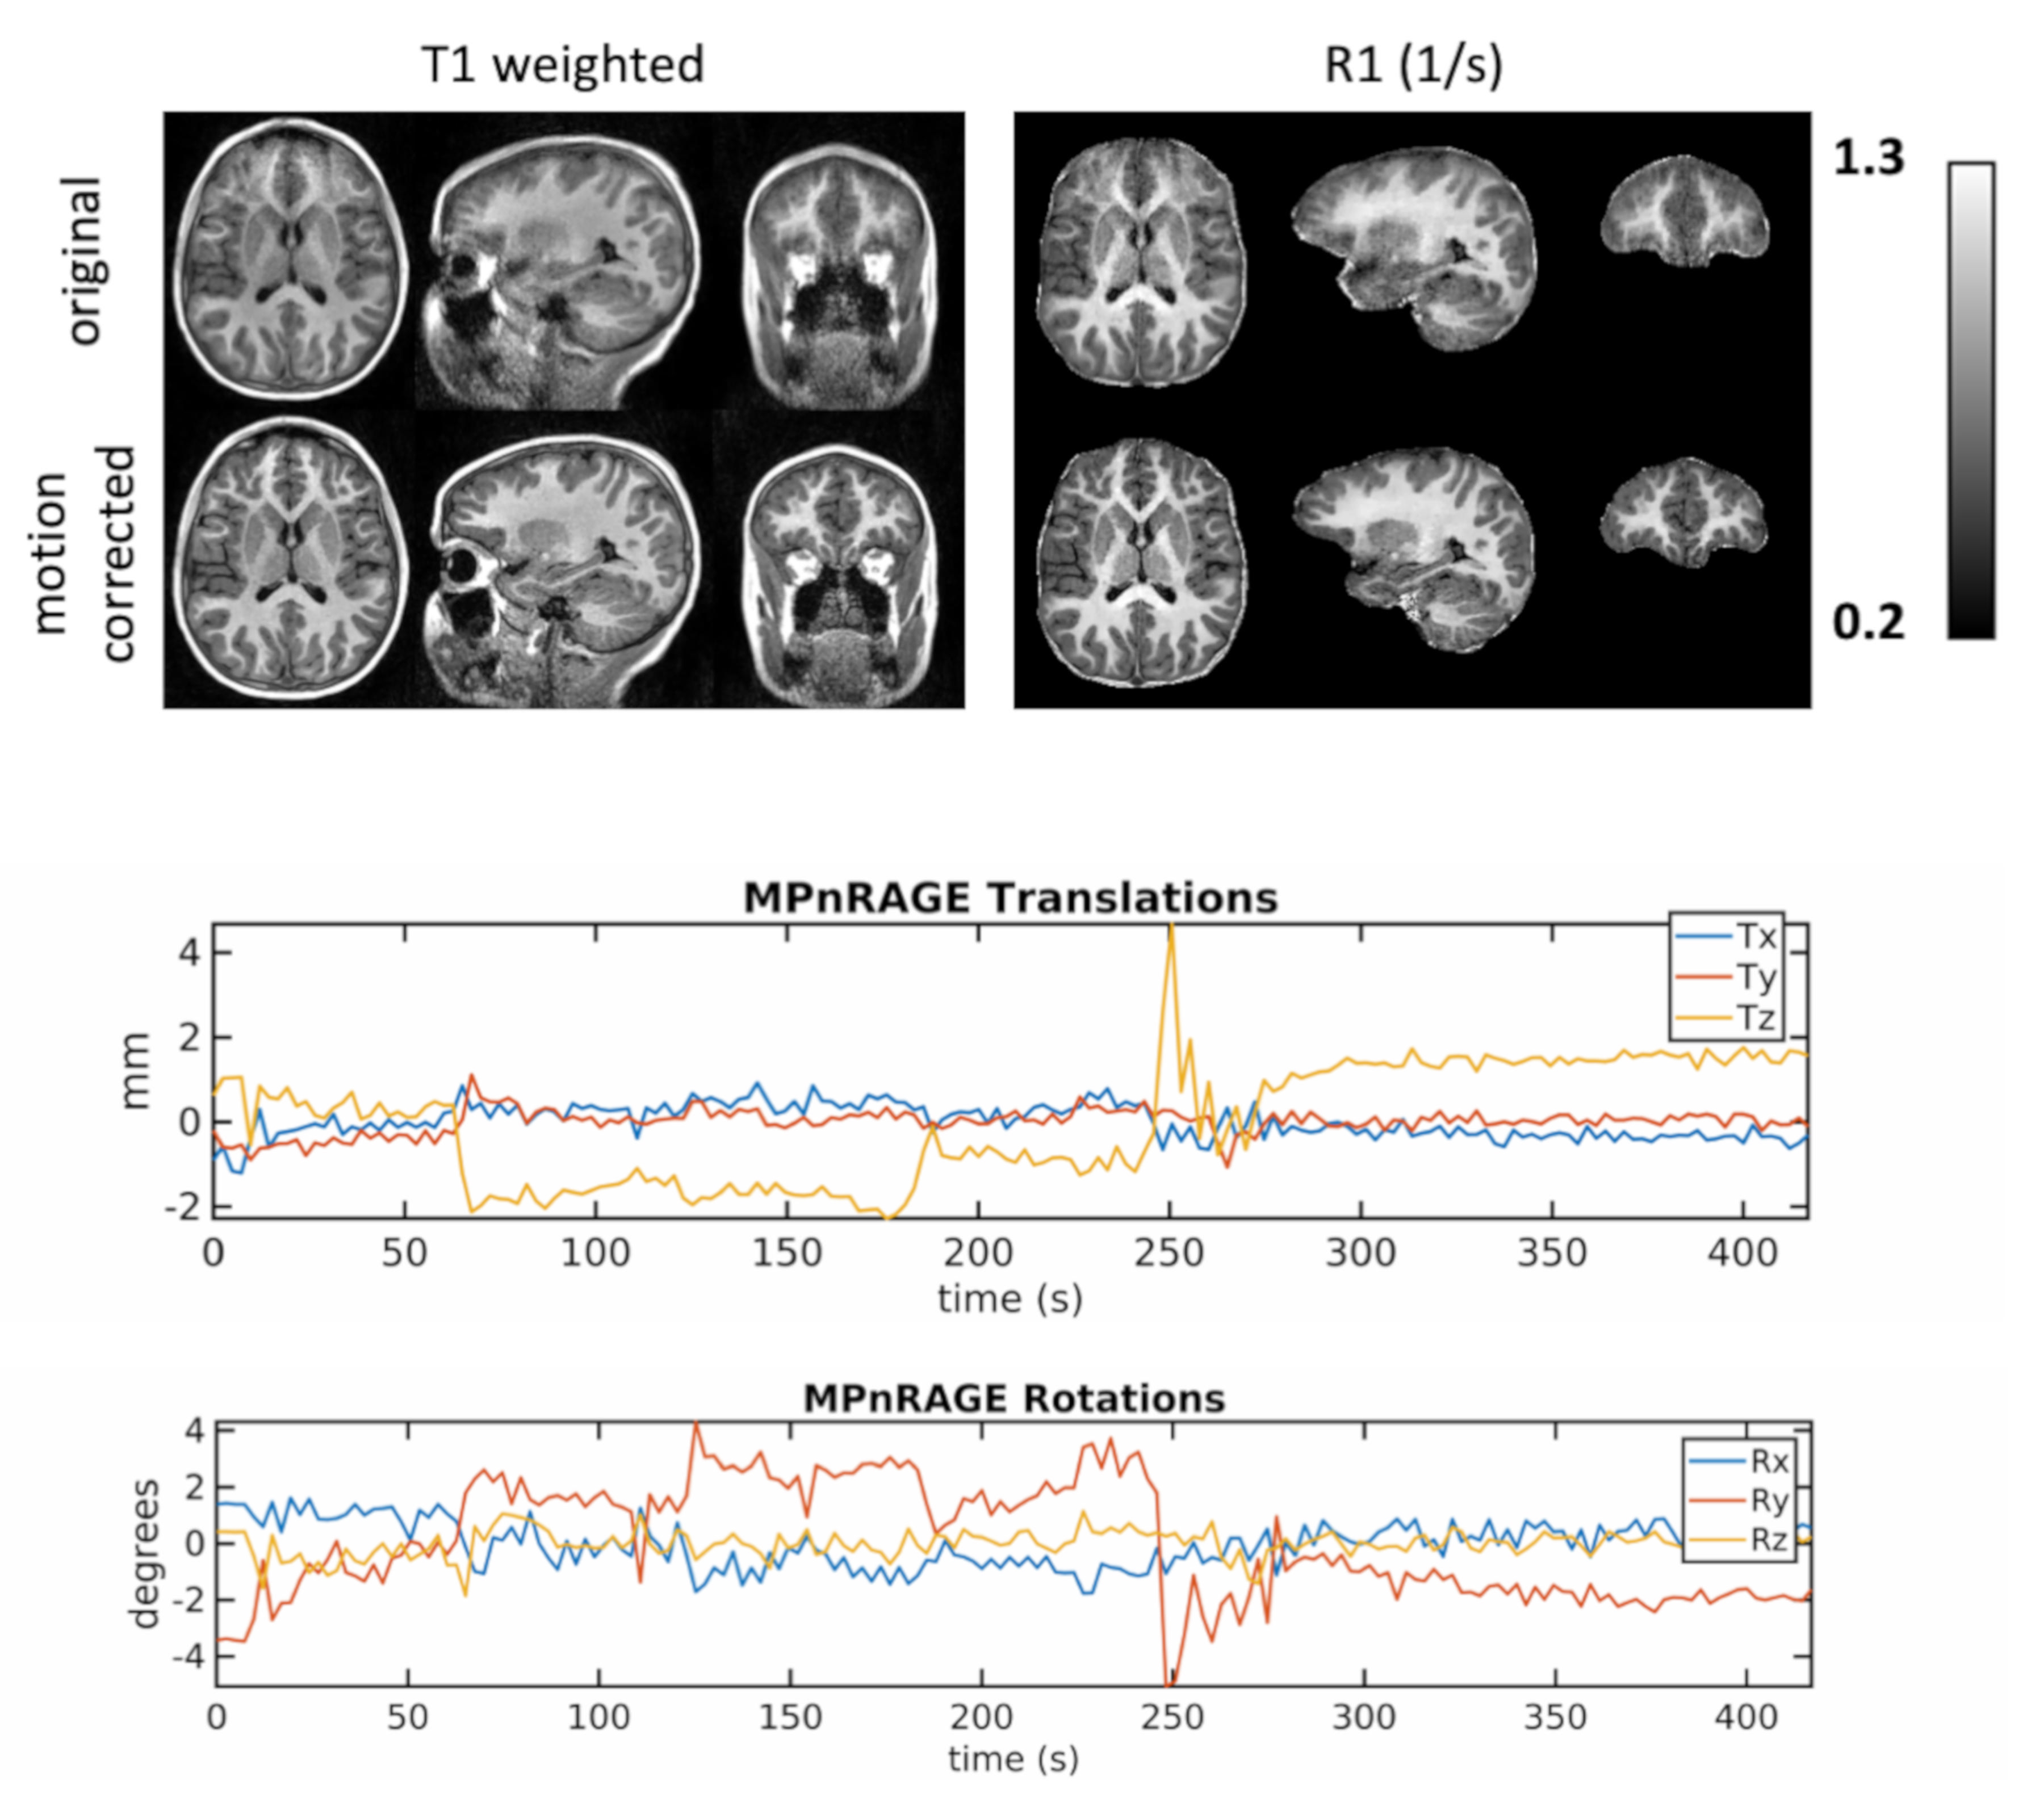
A self navigated retrospectively motion corrected magnetization prepared sequence with n rapidly acquired echoes (SNARE-MPnRAGE) [1-4] was used in this study. It is a MPRAGE [5] acquisition with a double interleaved 3D radial k-space trajectory. The ordering is arranged to allow the reconstruction of motion navigator images directly from the imaging data as well as a large number, n, of inversion times (n~400) from a single acquisition. Motion estimates are derived directly from the imaging data and used to correct for rotational and translational motions directly in k-space. The n-inversion time images are used for quantitative R1 relaxation estimation. Whole head imaging with 1mm isotropic resolution is achieved in 7 minutes.Motion-corrected MPnRAGE was previously evaluated by clinical radiologists and found to be highly effective for producing consistently high quality T1w images in a study of 44 children (~13 +/- 3 years old) [2]. More recently, in a younger pediatric cohort (6-12 years old), we demonstrated that MPnRAGE with SNARE yielded consistently higher image quality and automated regional segmentation repeatability than 3D Cartesian MPRAGE with prospective motion correction [3]. Quantitative R1 relaxometry of subcortical regions also demonstrated high test-retest [4]. In this study, we extend the analysis to include test-retest of cortical R1 relaxometry, as well as traditional cortical measures such as thickness, surface area, and volume estimated from FreeSurfer [6]. In additional to region-of-interest measurements, test-retest of cortical R1 relaxometry and thickness is also assessed on an individual vertex basis. Power analysis were performed to help estimate the number of subjects need for group comparisons in future studies.
Methods
Twelve children (9.4+/-2.6 years, min=6.5 years, max=13.8 years, 6 male and 6 female) without known neurological health concerns were selected for imaging on a 3T MRI scanner (GE MR750) with a 32 channel head coil (Nova Medical). Each participant received three SNARE-MPnRAGE scans (acquisition time 7 minutes) interleaved within an approximately 60 minute scan session. Stabilization padding was removed prior to the second and third MPnRAGE scans.T1-weighted “composite” images, with contrast similar to conventional MPRAGE acquisitions, were reconstructed with and without motion correction as described in [2] and used for cortical surface reconstruction in FreeSurfer [5]. Similarly, images from each of the 385 inversion times (from 12ms to 1889ms), were reconstructed with and without motion correction and used for quantitative R1 relaxation estimation as described in [2] and [4]. All inversion time images, as well as the T1-weighted “composite” image and R1 map are inherently aligned.
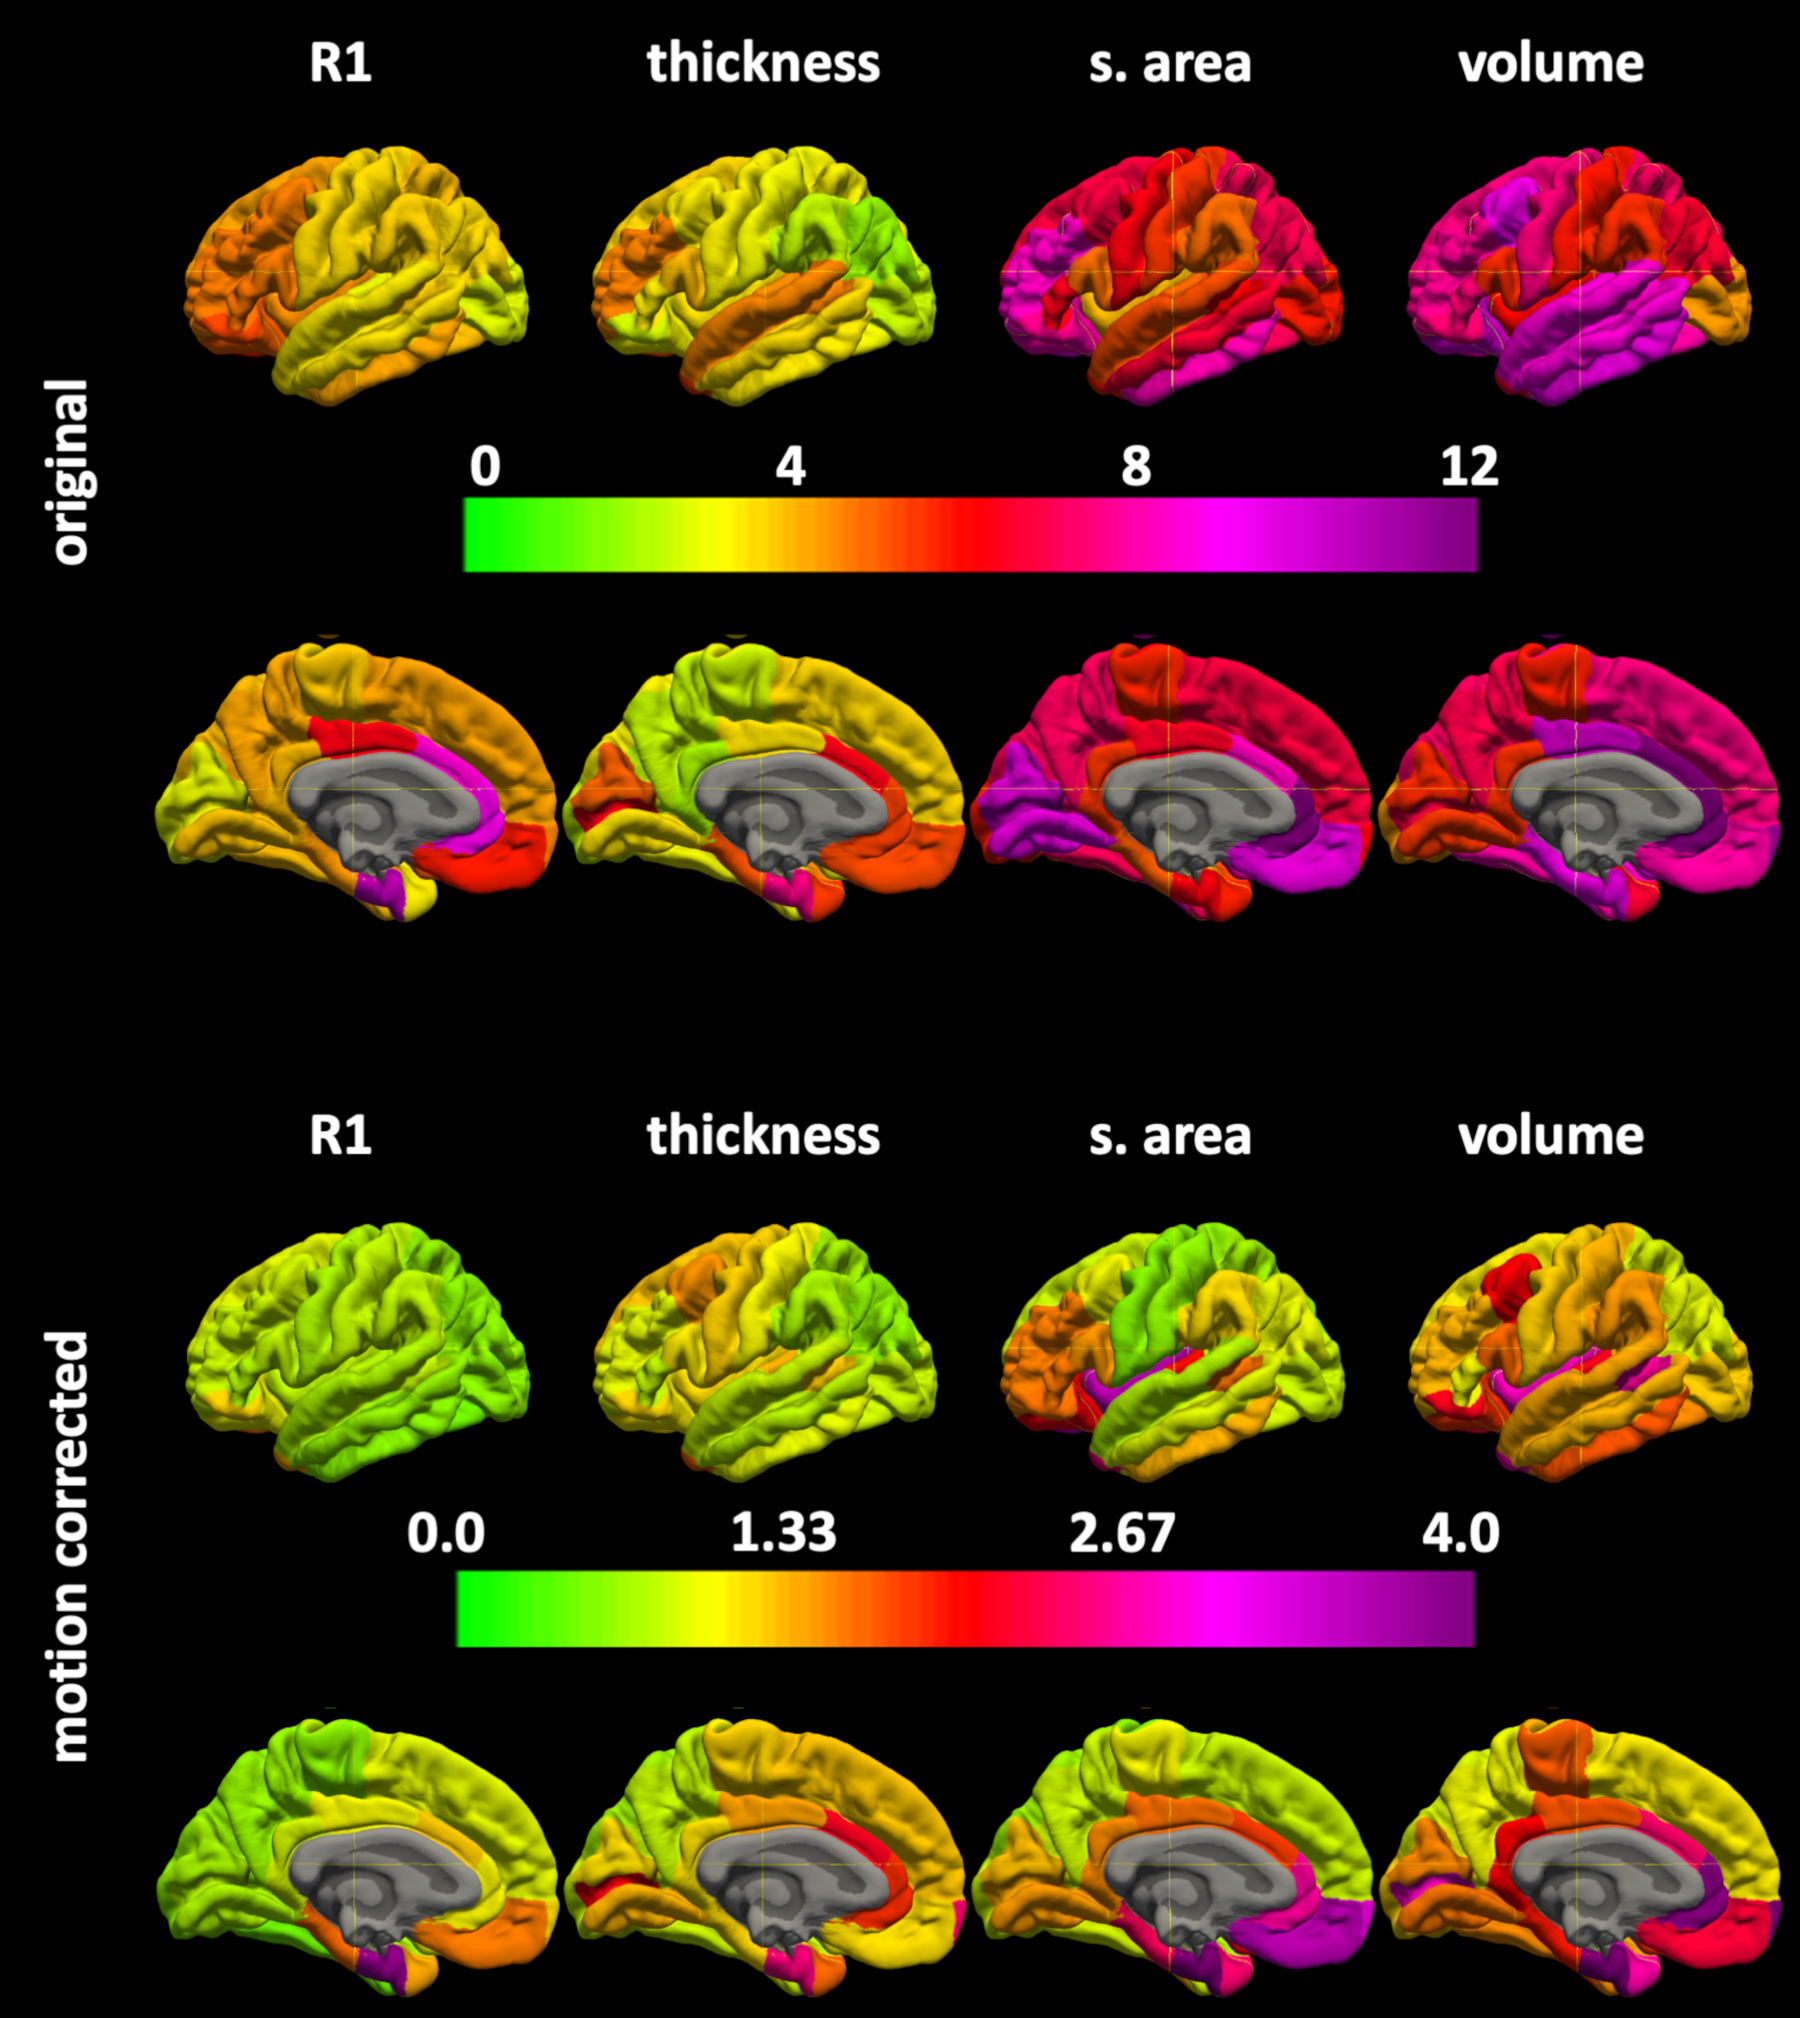
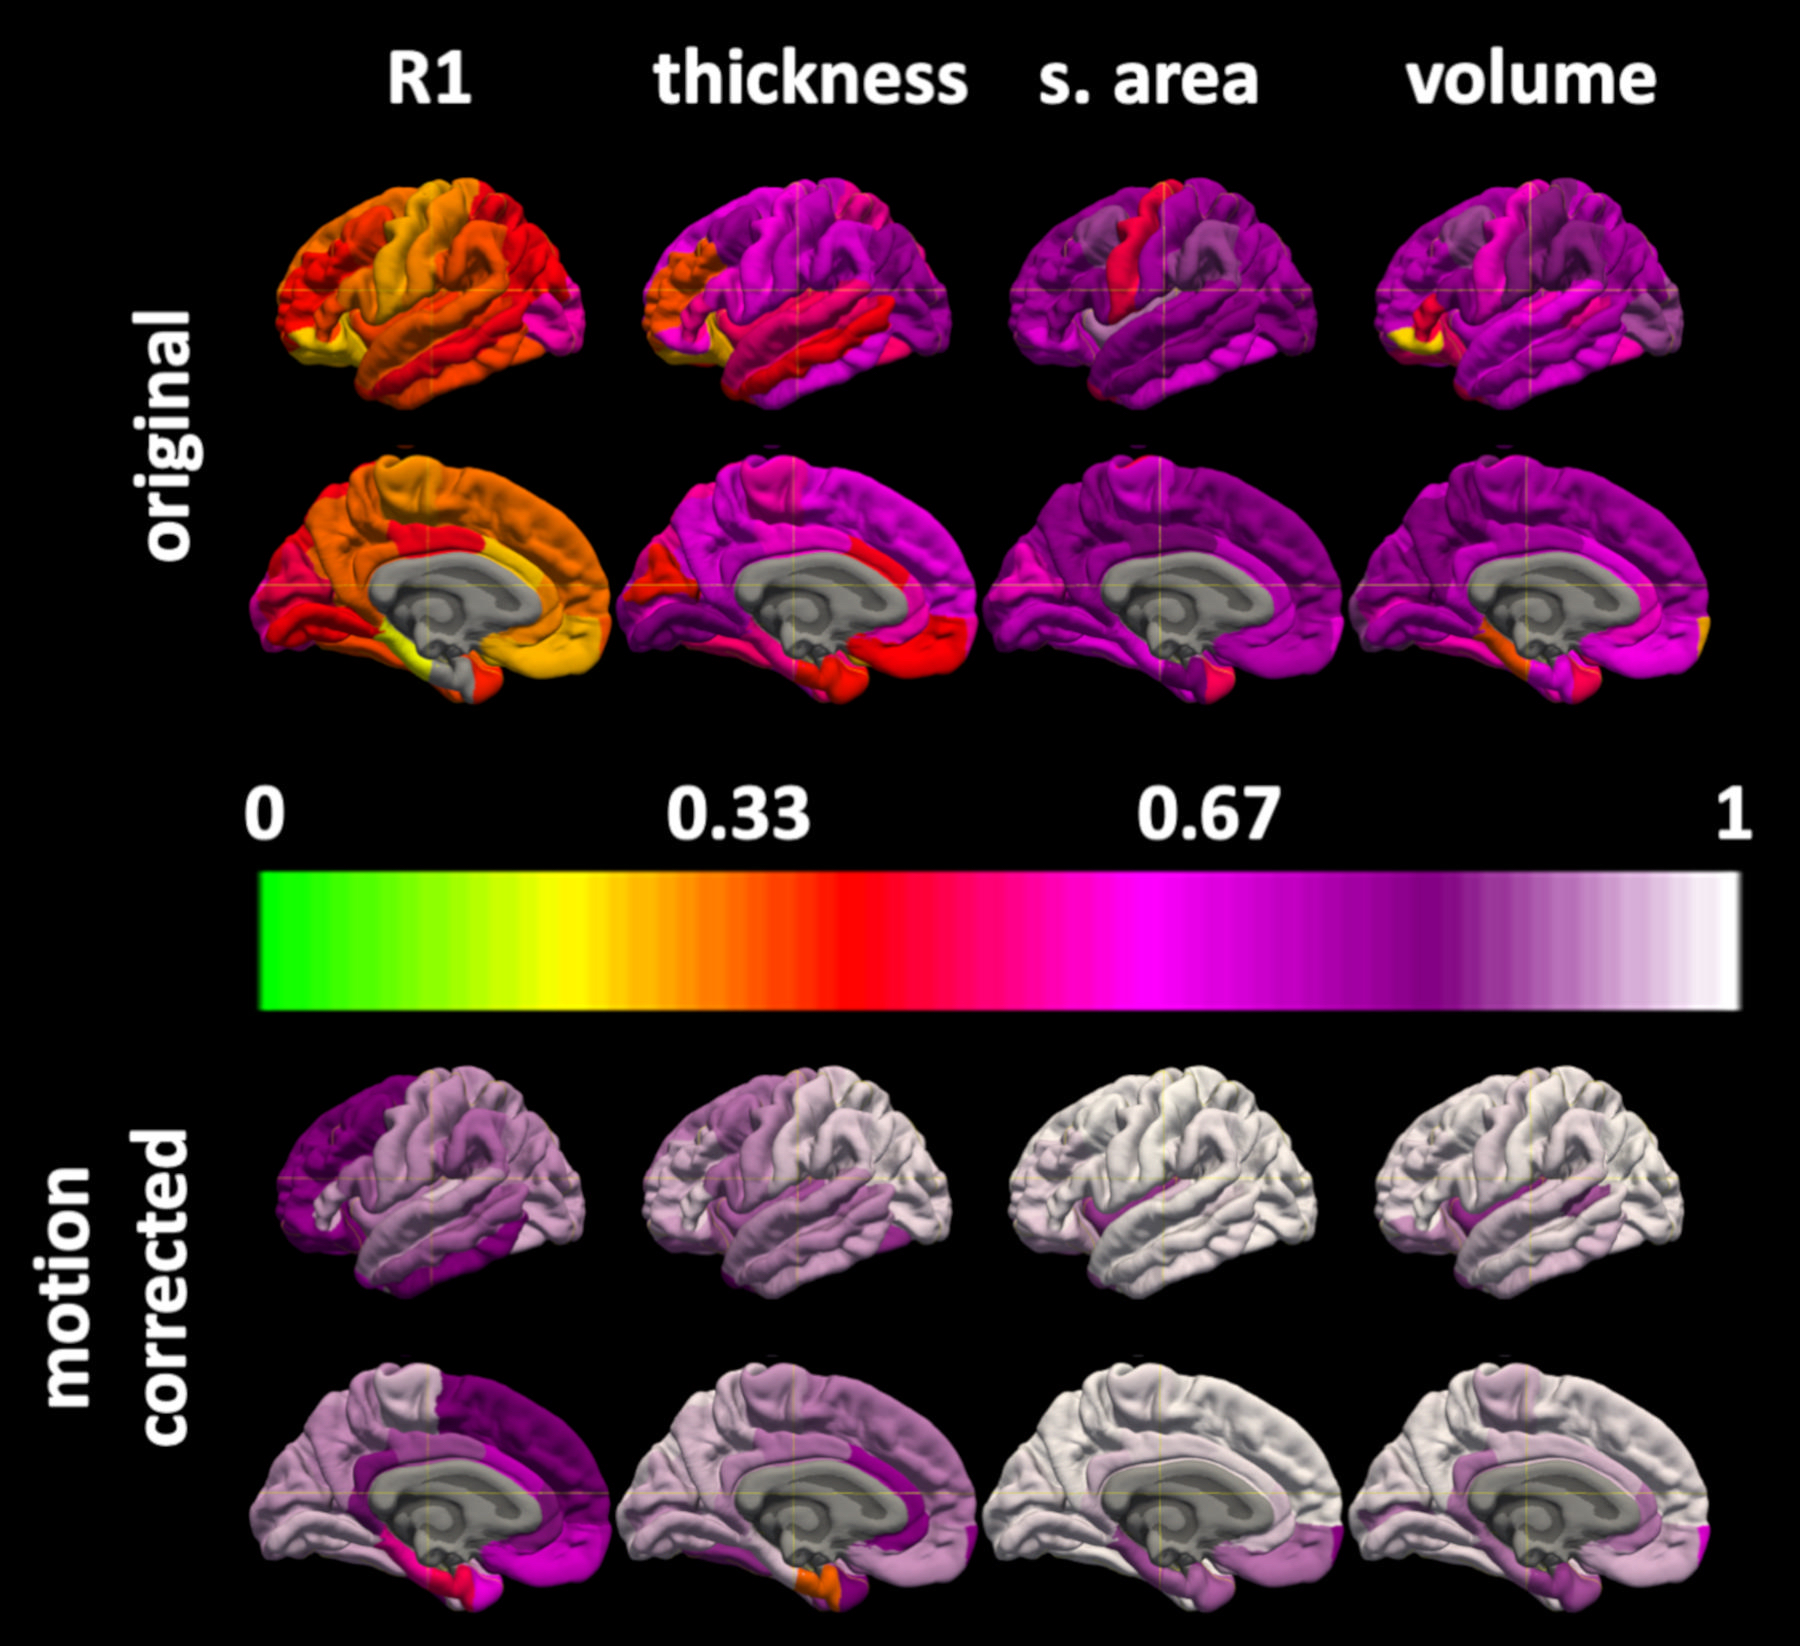
R1 values within the cortical surface of each subject are sampled at the midpoint between the white matter / gray matter boundary and the pial surface using FreeSurfer’s tool mri_vol2surfwith option “--projfrac 0.5”. Reliability of these values, along with cortical thickness, cortical surface area, and cortical volume was assessed with coefficients of variation (CoVs) and intraclass correlation coefficients (ICCs). Statistical differences between the mean measures with and without motion correction were assessed with the Wilcoxon signed-rank test. Corrections for false discoveries was performed with the Benjamini-Hochberg procedure [7] at the significance level of p=0.05. Analysis for R1 and thickness was performed both regionally based on the Destrieux and DK Atlases, as well as on an individual vertex level, after mapping all subjects to the FreeSurfer fsaverage population template.
Results
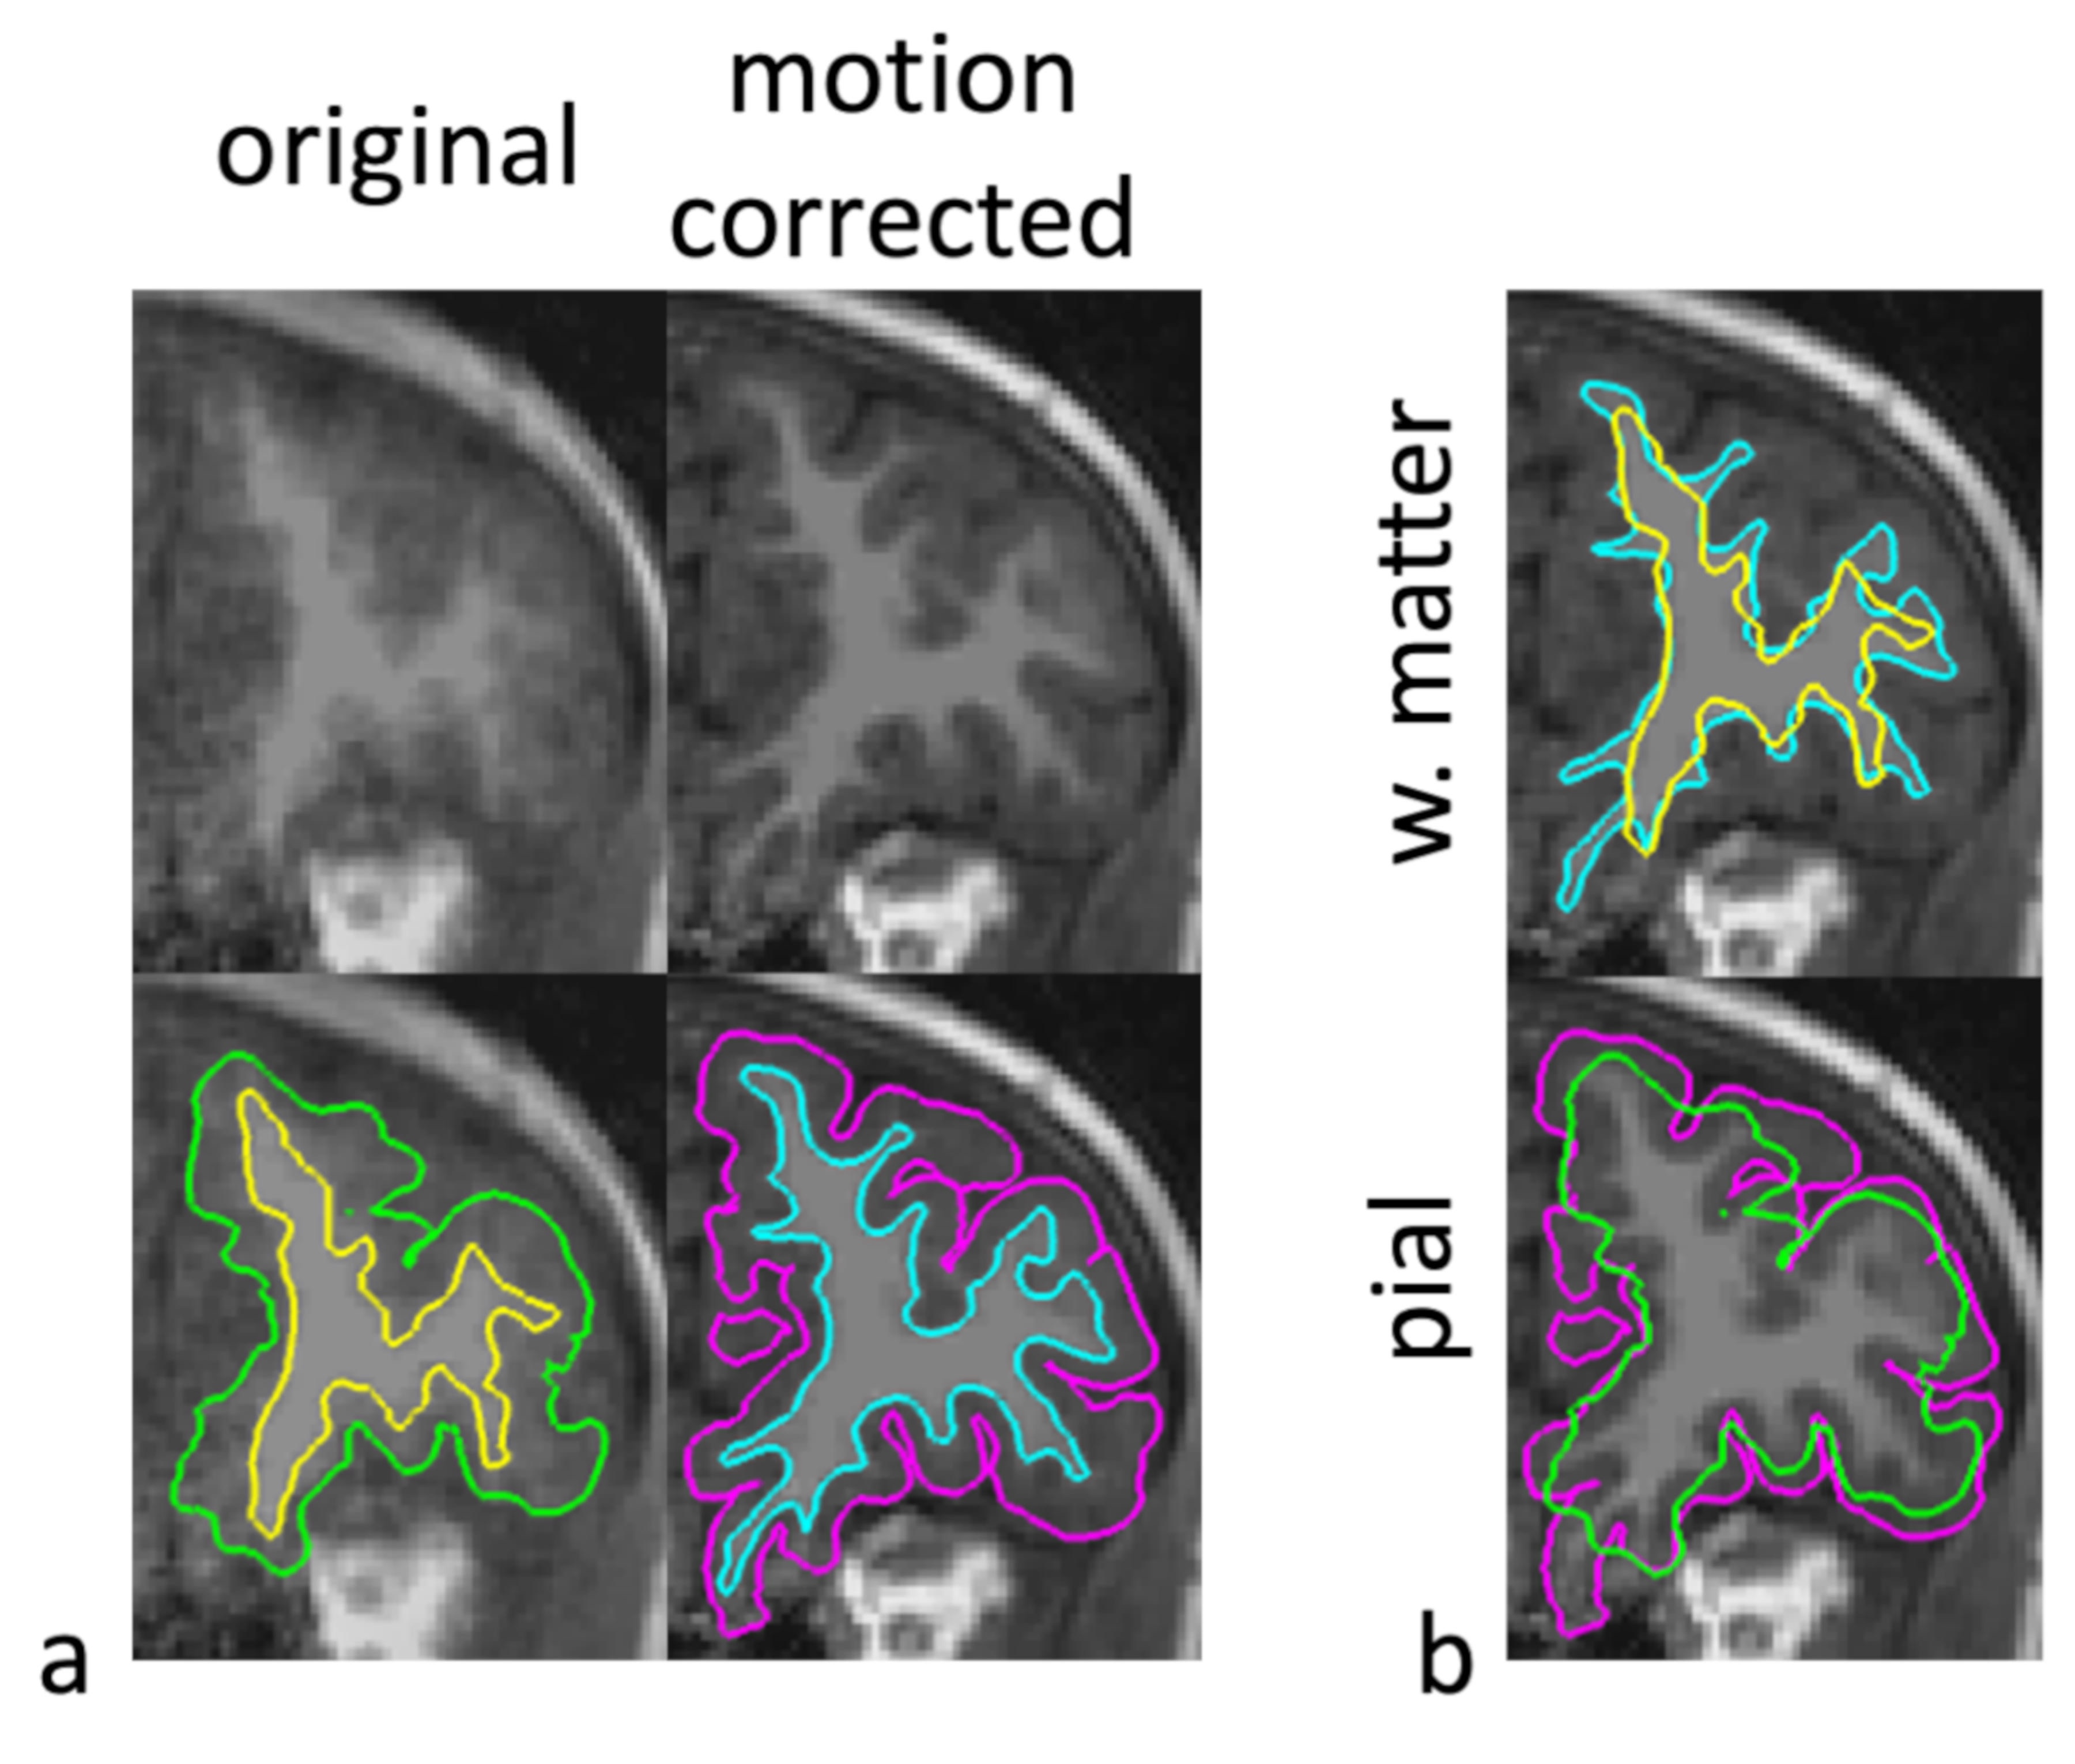
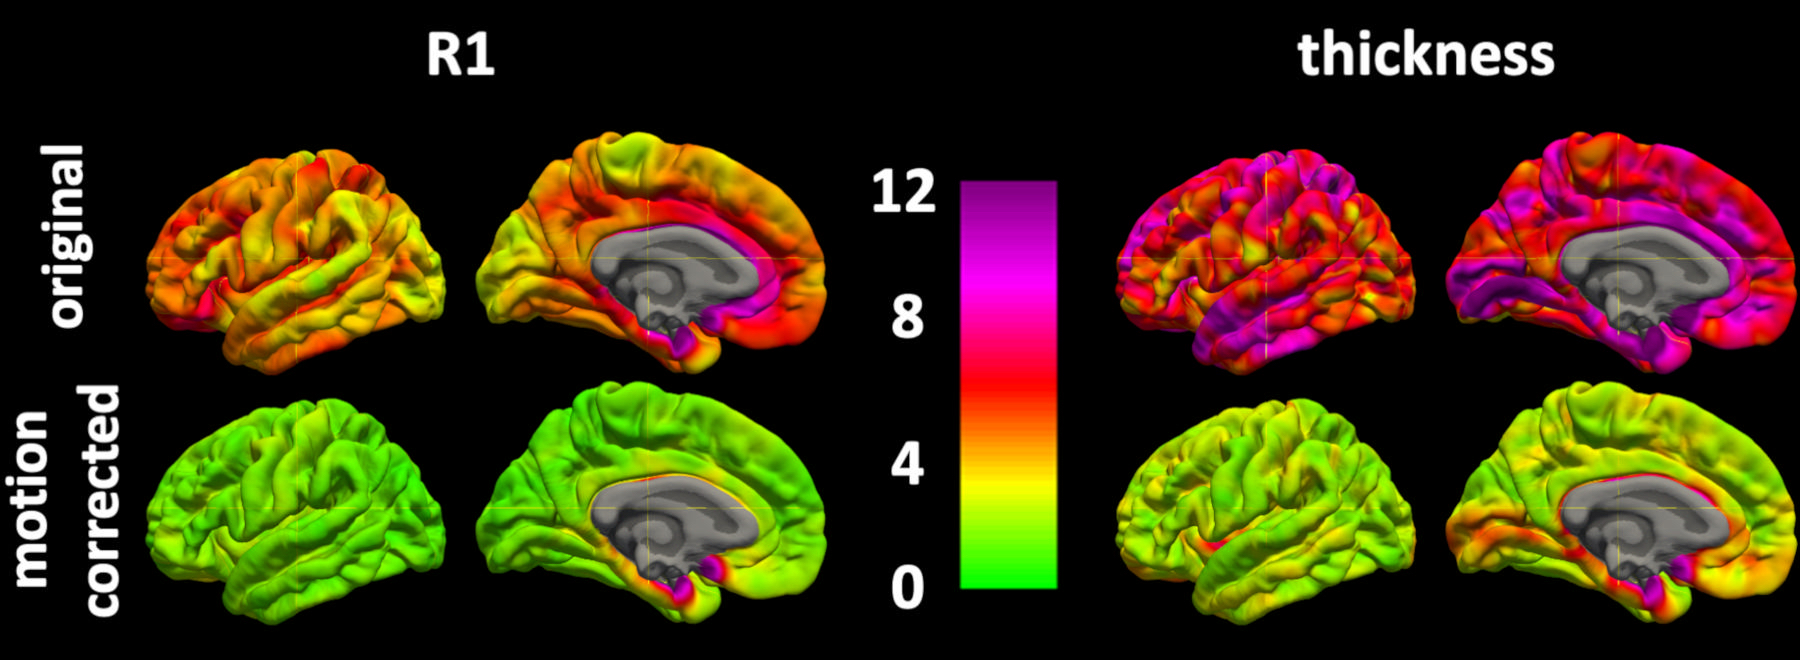
Example T1-weighted, quantitative R1 maps, and motion estimates from a case with significant blurring are shown in Figure 1, while an example of the corresponding FreeSurfer cortical segmentation is shown in Figure 2. Regional surface maps of the CoVs and ICCs are shown in Figures 3-5.When SNARE motion correction was used all parameters had statistically significant improvements and demonstrated high reliability. Reliability varied depending on parameter, region, and measurement type (vertex or region of interest). For the mean values for (thickness/surface area/volume/mean R1) across the regions of FreeSurfer’s DK Atlas, the mean CoVs (% x100) were (1.2/1.6/1.9/0.9) and the mean ICCs were (0.88/0.96/0.94/0.83). When assessed on a per-vertex basis, the CoVs and ICCs for thickness/R1 had mean values of (2.9/1.9) and (0.82/0.68) across the regions of the DK Atlas.
Discussion/Conclusion
In this work we examined the test-retest of cortical thickness, cortical surface area, and cortical volume from FreeSurfer reconstructions and quantitative R1 relaxometry of the cortex using self-navigated retrospectively motion corrected MPnRAGE images from a cohort of pediatric participants. When motion correction was used, all measures had high test-retest performance as assessed by coefficients of variation and intraclass correlation coefficients. The results of the geometric measures (thickness, surface area, and volume) in this pediatric cohort using 100% data acceptance were similar to those obtained in a previously report using visually inspected datasets for a study with normal adult subjects [8].Acknowledgements
Funding: National Institutes of Health, Grant/Award Number: AG051216, AG15001, DA050258, HD094715, MH097464, MH100031 and MH101504; Eunice Kennedy Shriver National Institute of Child Health and Human Development, Grant/ Award Number: IDDRC U54 HD090256; Department of Radiology, University of Wisconsin-MadisonReferences
1. Kecskemeti S, Samsonov A, Hurley SA, et al (2016) MPnRAGE: A technique to simultaneously acquire hundreds of differently contrasted MPRAGE images with applications to quantitative T1 mapping. Magn Reson Med 75:1040–1053
2. Kecskemeti S, Samsonov A, Velikina J, et al (2018) Robust Motion Correction Strategy for Structural MRI in Unsedated Children Demonstrated with Three-dimensional Radial MPnRAGE. Radiology 289:509–516. https://doi.org/10.1148/radiol.2018180180
3. Kecskemeti SR, Alexander AL (2019) Test-retest of automated segmentation with different motion correction strategies: A comparison of prospective versus retrospective methods. Neuroimage 209:116494. https://doi.org/10.1016/j.neuroimage.2019.116494
4. Kecskemeti S, Alexander AL (2020) Three-dimensional motion-corrected T1 relaxometry with MPnRAGE. Magn Reson Med.https://doi.org/10.1002/mrm.28283
5. Mugler JP, Brookeman JR (1990) Three‐dimensional magnetization‐prepared rapid gradient‐echo imaging (3D MP RAGE). Magn Reson Med 15:152–157. https://doi.org/10.1002/mrm.1910150117
6. Dale AM, Fischl B, Sereno MI (1999) Cortical surface-based analysis. I. Segmentation and surface reconstruction. Neuroimage 9:179–194. https://doi.org/10.1006/nimg.1998.0395
7. Benjamini Y, Hochberg Y (1995) Controlling the False Discovery Rate: A Practical and Powerful Approach to Multiple Testing. J R Stat Soc Ser B 57:289–300
8. Iscan Z, Jin TB, Kendrick A, et al (2015) Test-retest reliability of freesurfer measurements within and between sites: Effects of visual approval process. Hum Brain Mapp 36:3472–3485. https://doi.org/10.1002/hbm.22856
Figures