1366
Perceptual motion scoring: An algorithm for automated detection and grading of MRI motion artifacts
Rafael Brada1, Michael Rotman1, Sangtae Ahn2, and Christopher J. Hardy2
1GE Reserach, Herzliya, Israel, 2GE Research, Niskayuna, NY, United States
1GE Reserach, Herzliya, Israel, 2GE Research, Niskayuna, NY, United States
Synopsis
We introduce a method for the automatic detection and scoring for motion artifacts in 2D FSE images. The method is based on analyzing the difference in k-space data between two coil array elements. The relative motion score is a parameter free calculation. To match human observer rankings, linear regression coefficients were calculated on a development set of seventeen T1 brain series. The normalized score was tested on nine T1-FLAIR FSE brain series achieving an R2 of 0.91. The ability to automatically detect and grade the severity of motion artifacts is important for better clinical workflows, and for research purposes.
Introduction
Patient motion during MRI exams is a significant clinical problem, rendering scans sometimes clinically unusable and often requiring rescans1. There are also indications that even subtle motion artifacts affect structural measurements2,3. Over the years multiple methods have been proposed for detecting and correcting for patient motion during a scan4. Most current approaches require additional dedicated hardware or use of navigator sequences. We introduce a novel motion scoring algorithm compatible with standard FSE protocols that correlates well with a human observer score (R2 = 0.91). The algorithm uses the k-space data from two elements of the receiver array and produces signals indicative of discrete motions and of continuous motions. The two signals are used to calculate a combined motion score. From the discrete motion signal the timing of the discrete motions can be calculated.Methods
We acquired 26 T1-FLAIR 2D FSE brain scans of subjects instructeded to move their head in different motion patterns during the scan. The motion patterns included different discrete motions and/or continuous head motion. The number of discrete motions within each scan varied from 0 to 8. The severity of the motion artifacts depends on the number of movements and their timing. The motion artifacts are more severe for movements that take place while the center part of k-space is being scanned. A scan order (Figure 1) was used consisting of multiple echo trains of length 8. For T1-FLAIR each echo train is acquired sequentially across slices before acquisition of the next echo train. The motion signal is calculated by Fourier transforming a pair of complex coil-intensity-corrected images from two of the coils in the receiver array back into k-space, calculating their difference, projecting along the frequency-encode direction as shown in Figure 2. The projected differences are then summed over all slices (Figure 3a), followed by a self normalization step performed by subtracting and dividing the signal by its minimum value (Figure 3b). The motion signal is then calculated by summing over the different echo trains (Figure 3c). A discrete motion signal (Figure 3d) is calculated by removing the baseline per k-space region from the motion signal. 17 series were used as a development set and 9 series for testing. For each series the degree of motion artifact visible in the images was ranked by 3 observers on a scale of 0-10, 10 being the most severe motion corruption. The average observer value defined the user score. The algorithmic motion score was calculated by linearly fitting the areas under the curves shown in Figure 3c-d to the user ranking on the development set. The final score was taken to be the linearly transformed area under the curve in graph 3c if its value is greater than 3 and the transformed area under the curve of graph 3d otherwise.Results
The calibrated score was evaluated on a test set of nine T1-FLAIR brain series. The subjects were asked to move their head between 0 to 8 times during the scan, with an average of 2 movements, and at different times. The resulting images received a user motion score ranging from 0 to 10 with an average score of 4.6. The R2 value for the correlation between the user score and the calculated score was 0.91. The correlation between the user score and the calculated score on the test set and the development set are shown in Figure 4. Figure 5 shows images, taken from the test set, with different levels of motion artifacts and their related user score and calculated score. One of the series, which was listed as motion free in the protocol, exhibited slight motion artifacts, and received a motion score of 1.4 by the algorithm and a user score of 1.Discussion
This work presents a novel approach for detecting and scoring the severity of motion artifacts in MR images. The method also provides the timing of discrete motions. This opens the door to multiple future strategies for overcoming patient motion and for answering research questions related to the presence and effect of motion artifacts on quantitative and qualitative results of MRI exams. The work needs to be extended to additional coil settings and scan protocols for developing and validating a consistent motion score.Conclusion
We have developed a novel method for calculating a motion-artifact severity score for 2D FSE images. The method was tested for scoring the motion artifacts caused by rigid body movements, such as a subject’s head movement during a brain scan. The calculated score closely correlates with human visual perception of the artifacts’ severity. The method can be used to detect the presence of both continuous and discrete motions during the scan. The method can be used to time the discrete motions. The calculated motion score integrates the contribution from both discrete and continuous movements. The relative motion score is a parameter free calculation for a given acquisition protocol. A perceptual motion score can be calculated by a linear transformation applied to the relative motion score following a calibration process.Acknowledgements
No acknowledgement found.References
- Jalal B. Andre, MD. Toward Quantifying the Prevalence, Severity, and Cost Associated with Patient Motion During Clinical MR Examinations. J Am Coll Radiol 2015; 12:689-695.
- Aaron Alexander-Bloch et al. Subtle In-Scanner Motion Biases Automated Measurement of Brain Anatomy From In Vivo MRI. Hum Brain Mapp. 2016 July; 37(7): 2385–2397. doi:10.1002/hbm.23180
- M. Reuter, M. D. Tisdall, A. Qureshi, R. L. Buckner, A. J. W. van der Kouwe, and B. Fischl, ``Head motion during MRI acquisition reduces gray matter volume and thickness estimates,'' NeuroImage, vol. 107, pp. 107-115, Feb. 2015.
- F Godenschweger et al. Motion correction in MRI of the brain. Phys Med Biol. 2016 March 7; 61(5): R32–R56. doi:10.1088/0031-9155/61/5/R32.
Figures
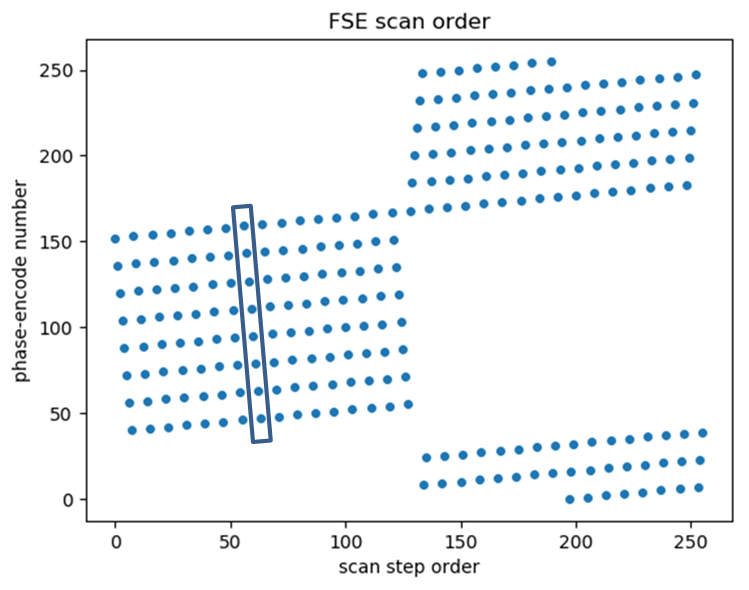
Figure 1. The 2D FSE scan order used for
the experiments. The center part of k-space is scanned first. The rectangular
region includes a single echo train.
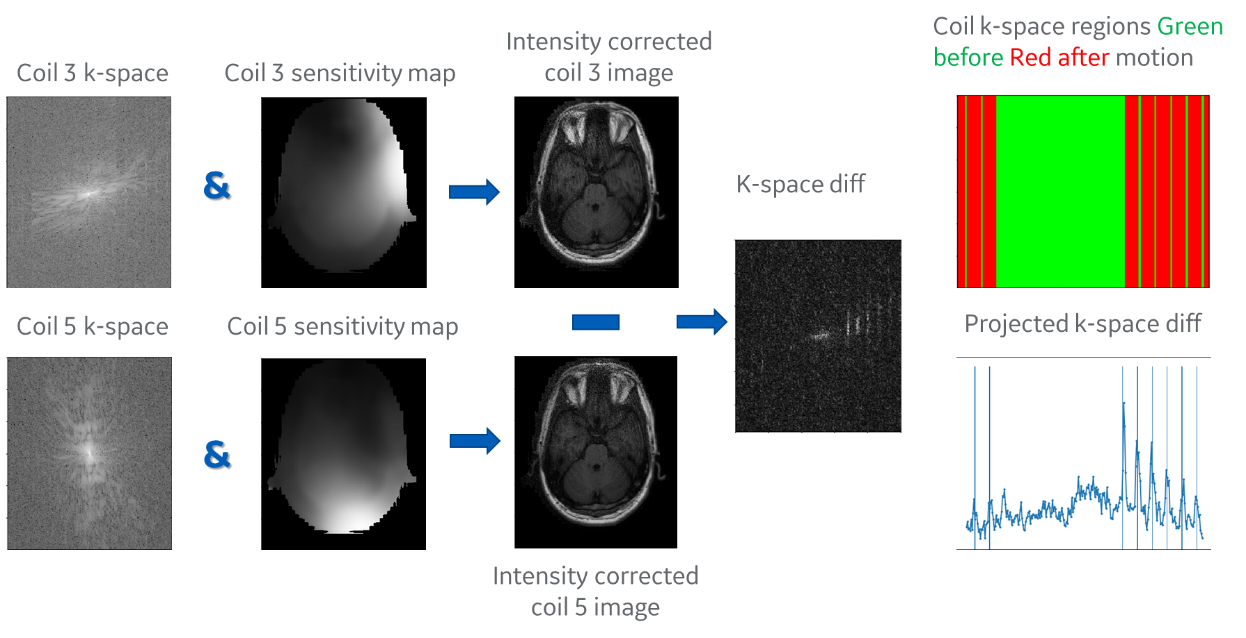
Figure 2. Motion signal
calculation for a single slice is performed by taking the k-space data of two
selected coils reconstructing two single coil images, taking the difference,
going back to k-space and summing the difference in k-space along the readout
direction
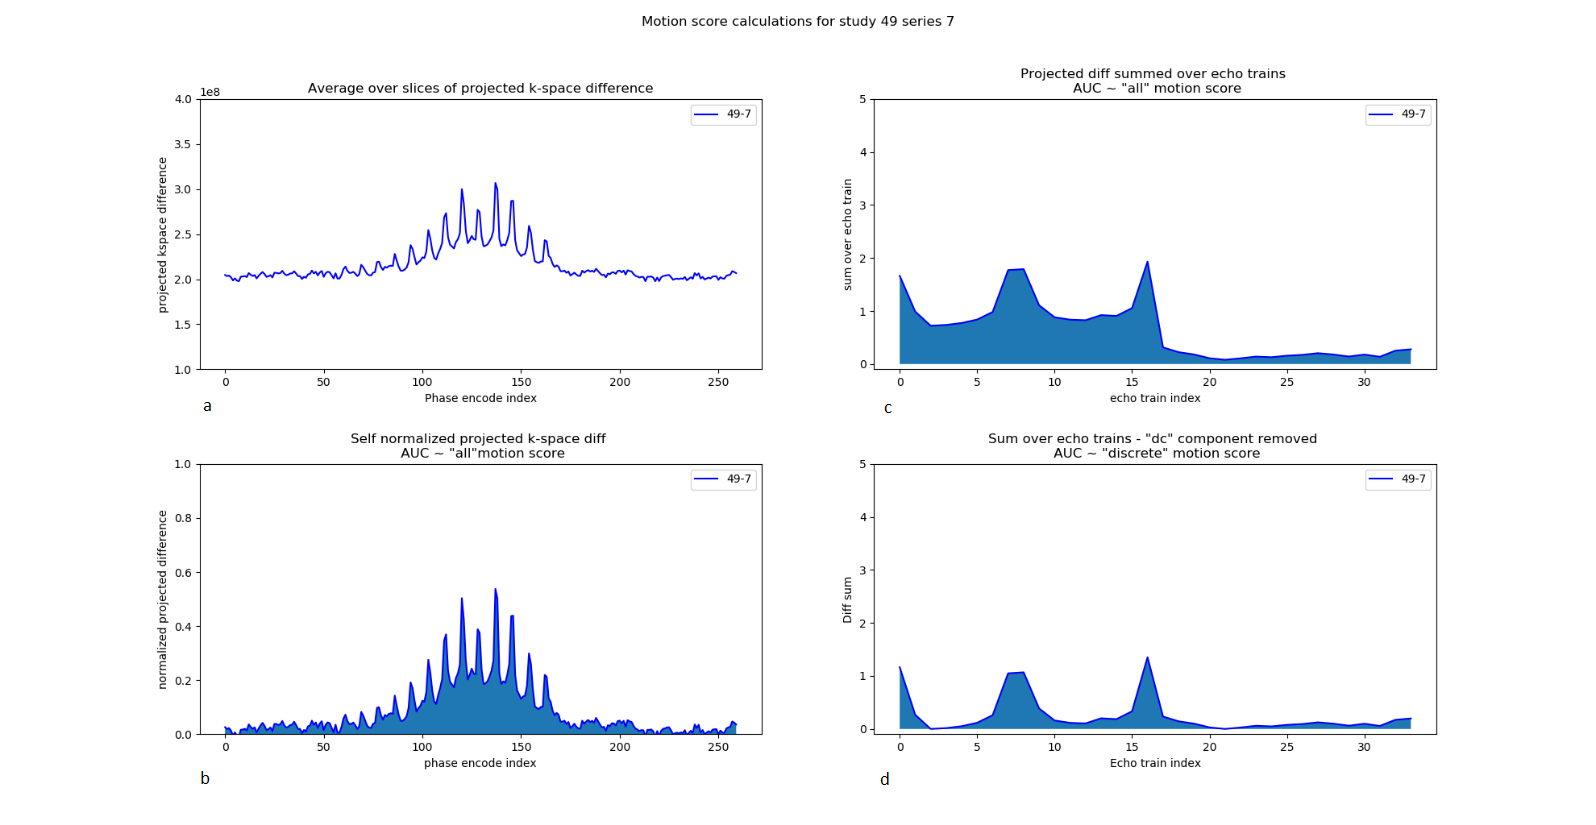
Figure 3. a) Sum
over all slices of the projected k-space difference. b) Self normalized
projection calculated by subtracting and dividing the signal by its minimum
value. c) Motion signal summed over the different echo trains. d) Discrete
motion signal calculated by removing the baseline for each k-space region from
the curve shown in c.
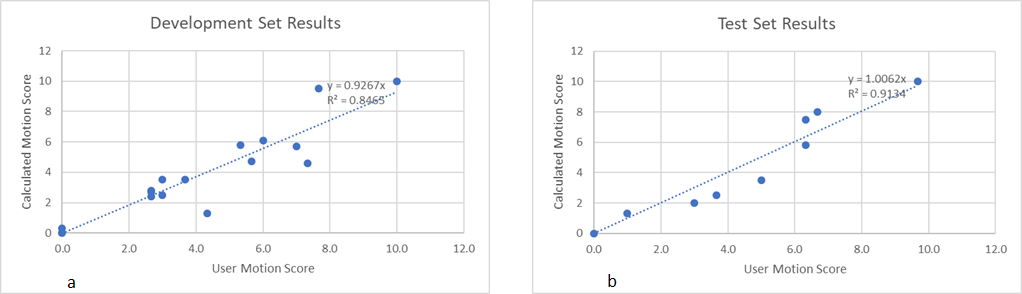
Figure 4. a) Correlation
between the calculated motion score and the user score for the development set.
b) Correlation between the calculated motion score and the user score for the
test set, with an R2 value of 0.91
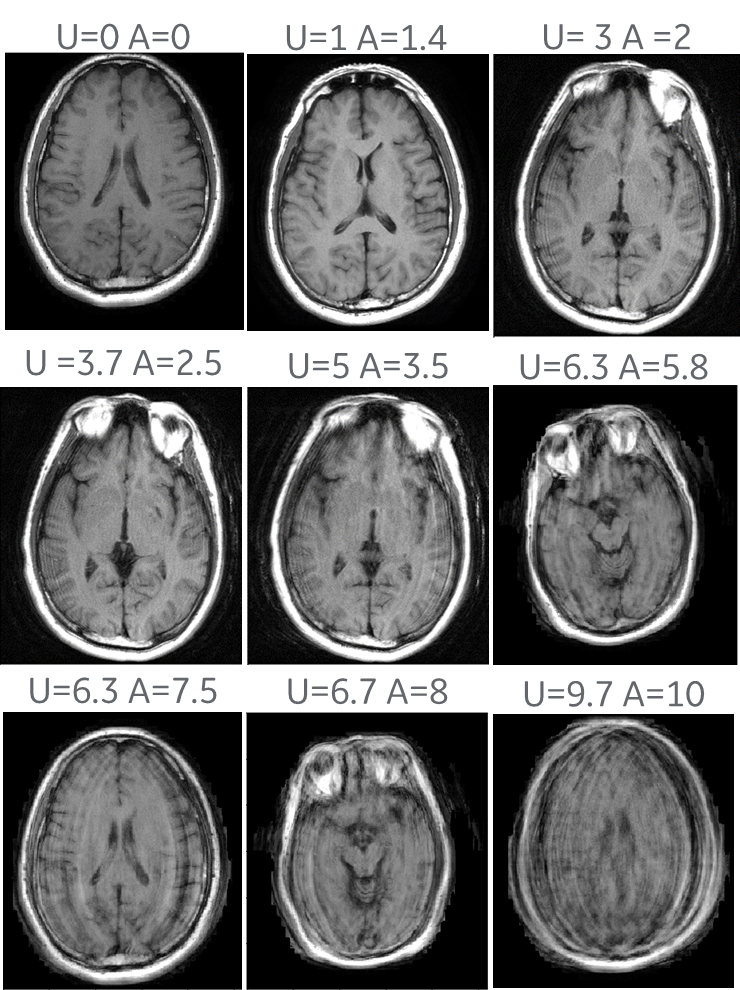
Figure 5. Sample images taken from each of the nine series in
the test set. U = The user assigned
score. A = The algorithm assigned score