1364
Listening in on the Pilot Tone: A Simulation Study1Department of Radiology, Lausanne University Hospital and University of Lausanne, Lausanne, Switzerland, 2Siemens Healthcare Magnetic Resonance, Erlangen, Germany
Synopsis
The Pilot Tone navigator is a novel electromagnetic motion sensing method capable of contactless respiratory and cardiac motion sensing. We demonstrate the physical processes underlying the Pilot Tone navigator using electromagnetic simulations on a realistic virtual human phantom and validate these simulation results in-vivo. These simulations can be used to investigate how the PT signal is shaped by motion of the underlying anatomy with the aim of using this information to aid in improving our processing pipeline.
Introduction
Pilot Tone (PT) is a novel electromagnetic motion sensing method1 that enables contactless sensing of respiratory and cardiac motion in an MR environment. It is based on inductive coupling between a PT signal generator coil and the MR scanner’s receive coils via conductive tissues. The generator loop, driven at a frequency close to the Larmor frequency, forms a magnetic field $$$\mathbf{B}_{PT}$$$ which induces eddy currents in conductive tissues. These eddy currents generate a secondary magnetic field $$$\mathbf{B}_{sec}$$$ and the sum $$$\mathbf{B}_{PT}+\mathbf{B}_{sec}$$$ is measured using the scanner’s receive coils. Motion of these tissues then modulates the received signal. Each coil measures a signal modulated by a combination of respiratory and cardiac motion and these components can be separated by using independent component analysis (ICA2). The resulting signals can be used in a variety of applications instead of ECG or MR navigators3-7. We performed a simulation study aimed at understanding how Pilot Tone works at a fundamental level and leveraging this knowledge to improve our processing pipeline. We were able to corroborate our findings in-vivo and present here first results aimed at improving the extraction of motion signals from PT raw data: One of the remaining challenges in fully automating the separation of cardiac and respiratory components has been the indeterminacy of the extracted motion signal’s sign after performing ICA. In addition to that, we have observed that the signs of motion signals differ between coils. Using our simulation results, we can now describe and predict the relation of the received signal’s sign to the underlying geometry.Methods
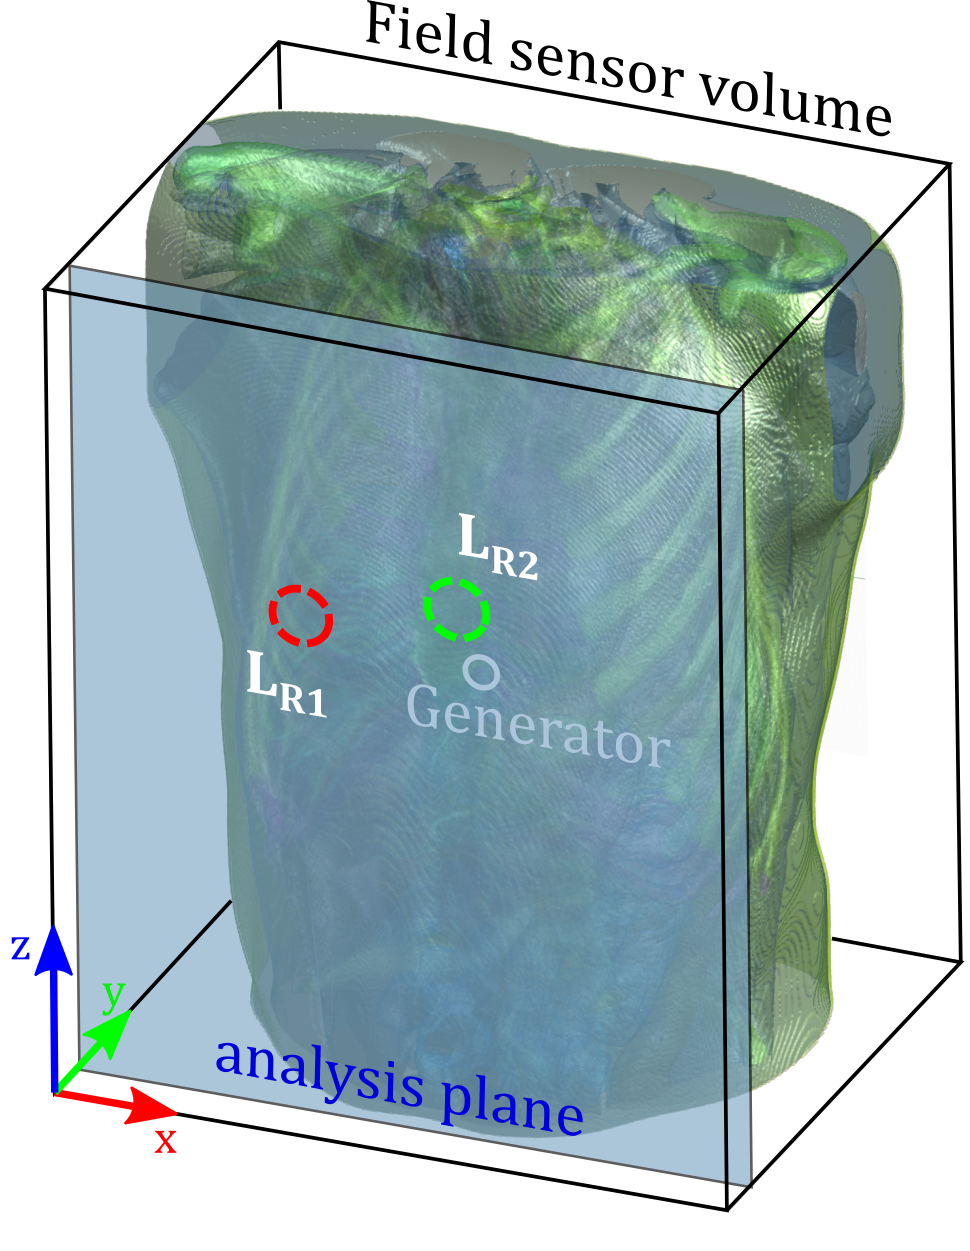
We simulated a realistic human torso (XCat v2 phantom8), comprised of 30 different tissue types with their respective values for conductivity and relative permittivity9 at $$$f_{PT}=122.5\,MHz$$$ (simulating a $$$3\,T$$$ system) using the Sim4Life FDTD (finite differences in the time-domain) solver (ZMT Zurich MedTech AG, Zurich, Switzerland). The virtual phantom (Fig.1) was set to simulate a cardiac cycle at 11 equally spaced timepoints. The PT generator coil was positioned anterior to the heart of this phantom and driven with $$$i(t)=9\,mA*\sin(2 \pi f_{PT}t)$$$. Simulation was performed using Sim4Life’s CUDA FDTD solver (Quadro M4000, NVIDIA Corporation). The magnetic fields $$$\mathbf{B}(x,y,z,t_n)$$$ at each timepoint $$$t_n,n\in[1,11]$$$ were extracted at an anterior plane $$$\Sigma_{ant}$$$ (where receive coils would be positioned in-vivo, see Fig.1). Receive coils were simulated by integrating the magnetic field component normal to $$$\Sigma_{ant}$$$. The resulting signal,$$u_{t_n,ROI}\propto\int_{ROI}B_{y,t_n}dA_{ROI}$$
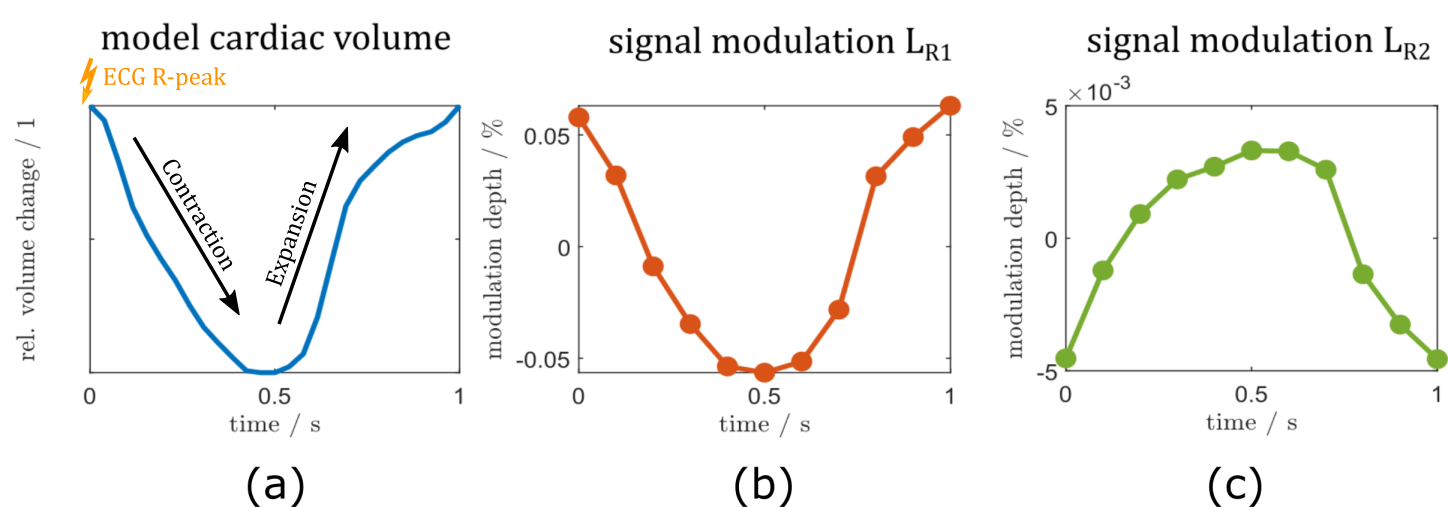
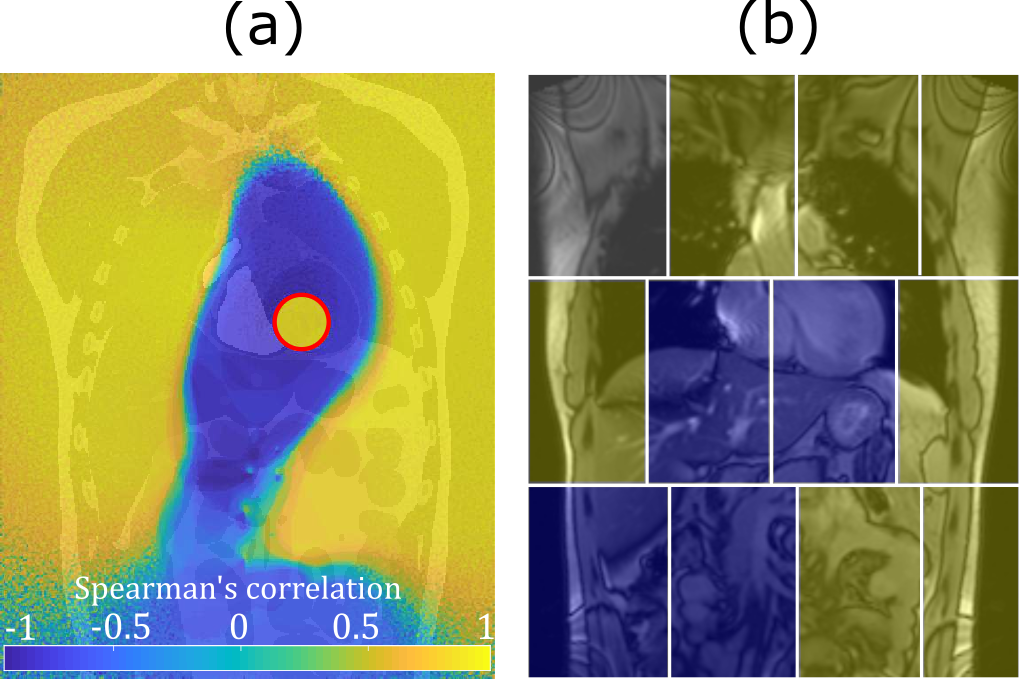
proportional to the magnetic flux through the coil, is then evaluated along its $$$t_n$$$ direction, yielding the simulated time-signal $$$u[t_n]$$$, shown for two virtual coils in Fig.2. To determine whether the magnetic field time-signal at a point in $$$\Sigma_{ant}$$$ contains modulation due to cardiac motion, we determined the correlation coefficient at each pixel of $$$\Sigma_{ant}$$$ to cardiac volume ground truth, yielding the correlation map of $$$B_y[t_n]$$$ to $$$V_{card}$$$ in $$$\Sigma_{ant}$$$ (Fig.3, left). We then scanned a volunteer similar in size to the virtual phantom at 3T using a 12-channel array-coil with integrated PT generator (MAGNETOM Vida & Biomatrix Body12, Siemens Healthcare, Erlangen, Germany) and compared the sign of the cardiac signal as determined by temporal relation to ECG R-peak (see Fig.2a), in each receive element to simulation results (Fig.3, right).
Results
Figure 2 shows the simulated cardiac signal modulation in percent of the average received signal in $$$L_{R1}$$$ (b) and $$$L_{R2}$$$ (c) compared to cardiac volume ground truth (a). Note how the sign of the modulation signal differs in these two coils. We found absolute modulation depths in $$$\Sigma_{ant}$$$ ranging from 0 to 0.1 percent. Figure 3a shows a pixelwise correlation map for $$$\Sigma_{ant}$$$. Changes in the sign of the received signal can be seen along a well-defined boundary surrounding the heart and extending into the abdomen (P<0.001 except on sign boundary). In our volunteer (Fig.3b), the sign of the received signal follows a similar pattern: negatively correlated channels (like Fig.2c) over the heart, and positively correlated channels in the periphery.Discussion
Our simulations show qualitatively a similar signal behavior as that observed in-vivo, with channels close to the heart having negative correlation to cardiac volume, while more distant elements are positively correlated. Quantitatively, the simulated modulation depth close to the generator is lower than that typically observed in-vivo (0-0.1% vs. 0-1%) and approaches in-vivo results in the periphery. We believe that this is due to additional capacitive effects, i.e. capacitive coupling between generator, tissue and receive coils, and suppression of the primary field by geometric decoupling not considered in our simulation. The sign distribution in the correlation maps agree well with in-vivo results and knowledge of the location-dependent signal behavior could aid in the aforementioned problem of automatically determining the sign of motion components. The utilization of existing receive hardware makes PT a very attractive technique for obtaining physiological motion signals, but this also means that the placement of receive coils is constrained by requirements of the actual MR imaging. It is therefore imperative to understand how the PT signal behaves at these positions and electromagnetic simulations offer a useful tool for further research in this direction. The XCat phantom can simulate a wide variety of anatomies and future research could be focused on investigating how anatomical variation impacts signal behavior.Acknowledgements
No acknowledgement found.References
1] P. Speier, M. Fenchel, and R. Rehner, “PT-Nav: a novel respiratory navigation method for continuous acquisitions based on modulation of a pilot tone in the MR-receiver,” in Magnetic Resonance Materials in Physics, Biology and Medicine, 2015, vol. 28, no. Book of Abstracts, pp. 97–98, doi: 10.1007/s10334-015-0487-2.
[2] A. Hyvärinen, J. Karhunen, and E. Oja, “Independent Component Analysis,” Appl. Comput. Harmon. Anal., vol. 21, no. 1, pp. 135–144, 2001, doi: 10.1002/0471221317.
[3] M. Bacher, P. Speier, J. Bollenbeck, M. Fenchel, and M. Stuber, “Pilot Tone Navigation Enables Contactless Prospective Cardiac Triggering : Initial Volunteer Results for Prospective Cine,” in Joint Annual Meeting of the ISMRM & ESMRMB, Paris, 2018, p. 4798.
[4] M. Bacher, P. Speier, J. Bollenbeck, M. Fenchel, and R. Stollberger, “Retrospective Evaluation of Pilot Tone Based Cardiac Trigger Quality In A Volunteer Cohort,” in Magnetic Resonance Materials in Physics, Biology and Medicine, 2017, vol. 30, no. Book of Abstracts, pp. 360–361, doi: 10.1007/s10334-017-0634-z.
[5] M. Bacher et al., “Performance Analysis of a Fully Automatic Real-Time Capable Pilot Tone Cardiac Triggering Framework,” Proc. from 23rd Annu. SCMR Sci. Sess., vol. 63, pp. 412–414, 2020.
[6] T. Vahle et al., “Respiratory Motion Detection and Correction for MR Using the Pilot Tone,” Invest. Radiol., vol. 55, no. 3, pp. 153–159, Mar. 2020, doi: 10.1097/RLI.0000000000000619.
[7] M. B. L. Falcão et al., “5D Flow – A quantitative in vivo comparison between Self Gating and Pilot Tone Gating,” vol. 74, no. 5, pp. 2019–2021, 2019.
[8] W. P. Segars, G. Sturgeon, S. Mendonca, J. Grimes, and B. M. W. Tsui, “4D XCAT phantom for multimodality imaging research,” Med. Phys., vol. 37, no. 9, pp. 4902–4915, 2010, doi: 10.1118/1.3480985.
[9] P. Hasgall et al., “IT’IS Database for thermal and electromagnetic parameters of biological tissues, Version 4.0, May 15, 2018.” [Online]. Available: itis.swiss/database.
Figures