1350
Automatic Phase Image Texture Analysis for Motion Detection in Diffusion MRI (APITA-MDD) with Adaptive Thresholding1Department of Diagnostic Radiology and Nuclear Medicine, University of Maryland School of Medicine, Baltimore, MD, United States, 2Siemens Medical Solutions USA Inc, Malvern, PA, United States, 3Department of Electrical and Computer Engineering, Johns Hopkins University, Baltimore, MD, United States
Synopsis
In this study, we propose a more robust PITA-MDD method with automatic brain ROI selection and adaptive thresholding for the motion threshold (termed APITA-MDD). Automatic brain ROI is initially identified by Otsu’s method and then improved by erosion and dilation. Haralick’s Homogeneity Index (HHI) of each slice is converted to a deviation score independent of image SNR and ROI size for motion detection. APITA-MDD was tested on brain dMRI data acquired with head motion and leg crossing motion and correctly detected motion slices missed by PITA-MDD due to insufficient coverage at edge slices and single thresholding.
INTRODUCTION
Motion during diffusion MRI (dMRI) acquisition causes signal drop-out, which may impact the image quality and diffusion estimation. To deal with motion during dMRI acquisition, we have developed a prospective motion-robust dMRI acquisition that detects motion in real-time and performs online re-acquisition of motion-corrupted data1. The motion detection was based on the Phase Image Texture Analysis for Motion Detection in Diffusion MRI (PITA-MDD) technique2. In this study, we propose a more robust PITA-MDD method with automatic brain ROI selection and adaptive thresholding for the motion threshold (termed APITA-MDD). We show that the APITA-MDD method provides increased accuracy in detecting more subtle head motion (e.g. leg crossing) and applicable to multi-b values dMRI acquisitions.METHODS
PITA-MDD motion detectionPITA-MDD method detects motion by calculating a Haralick’s Homogeneity Index (HHI) that measures the dMRI phase image homogeneity2. HHI ranges from 0 to 1 and is high for motion free and low for motion corrupted image slices. In the previous PITA-MDD acquisition1, a box ROI needs to be defined for HHI calculation, along with an HHI threshold need to be set for motion detection.
Automatic brain ROI delineation
In the APITA-MDD method, a brain ROI was automatically determined in a non-diffusion weighted volume at the beginning of the acquisition. Following the Otsu’s method for initial brain mask identification, a few morphological operations were performed which includes erosion with a pair of 9x1 and 1x9 flat structural elements to eliminate the skin and other non-brain areas surrounding the brain, and dilation with a pair of 7x1 and 1x7 flat structural elements to fill holes within a brain mask. The dilation structural elements were specifically chosen to be smaller to increase the robustness of the ROI in case of subject movement during the dMRI acquisition.
Adaptive thresholding
HHI is known to be affected by image SNR (e.g. b-value) and ROI size (e.g. slice location and included anatomy size). Different motion thresholds may also be needed depending on subject co-operation. The adaptive thresholding determines motion corrupted slices by considering the slice location, the acquisition b-value, as well as corresponding (slice/b-value) HHI values from all previous volumes within the same dMRI acquisitions. We use the Median Absolute Deviation (MAD) method to convert an HHI value to a deviation score M for each slice, x, within a volume, y.
$$M(x,y|y\in[1,n_{j}])=\frac{HHI(x,y)-median(HHI(x, y=1, ...,n_{j}))}{MAD_{x,j}}$$
where $$${MAD_{x,j}}=median|HHI(x,y=1,...,n_{j})-median(HHI(x,y=1,...,n_{j}))|$$$, $$$n_{j}$$$ represents number of volumes with b-value, j.
Evaluation
The APITA-MDD motion detection method was tested on brain dMRI data with b-values at 1000 s/mm2 (Brain b1000) and 2000 s/mm2 (Brain b2000) acquired on four volunteers on a Siemens PrismaFIT 3T scanner (Siemens Healthcare, Erlangen, Germany) using single shot 2D spin-echo echo planar imaging with GRAPPA iPAT factor of 2, 3 non-diffusion weighted volumes and 32 diffusion gradient directions, FOV=240 mm, 54 slices, 2.5mm slice thickness, matrix size 96×96. Other imaging parameters include: Brain b1000: TR=5700 ms, TE=72 ms, bandwidth 2480 Hz/Px. Brain b2000: TR=6700 ms, TE=77 ms, bandwidth 2084 Hz/Px. For each subject, the data were acquired with no motion and with instructed head rotation. For two subjects, additional dMRI data was also acquired with instructed leg crossing motion, which caused subtle head motion as compared to head rotation. In this study, slices with M > 10 are considered motion corrupted. Motion detection results were compared with visual inspection as gold standard.
RESULTS
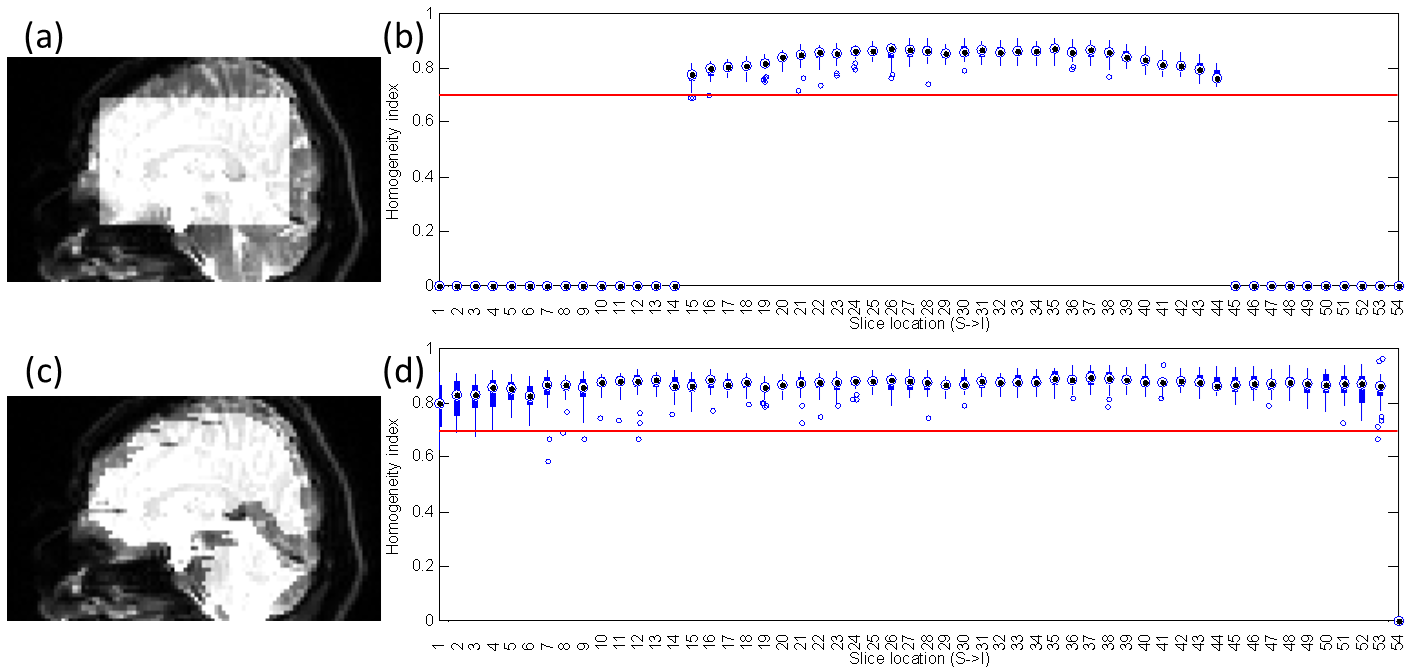
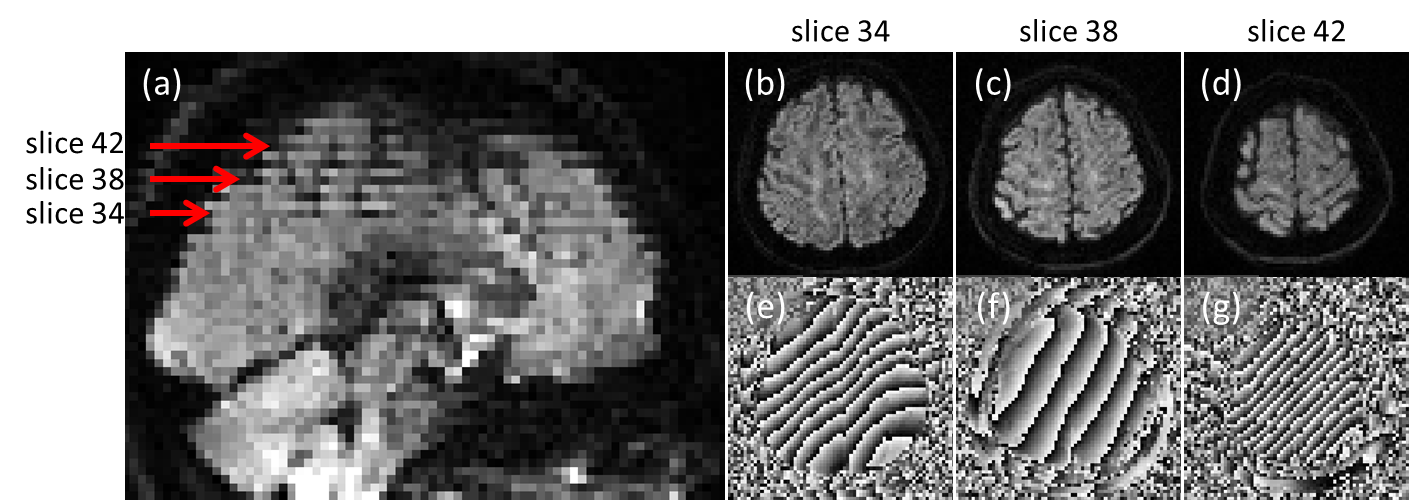
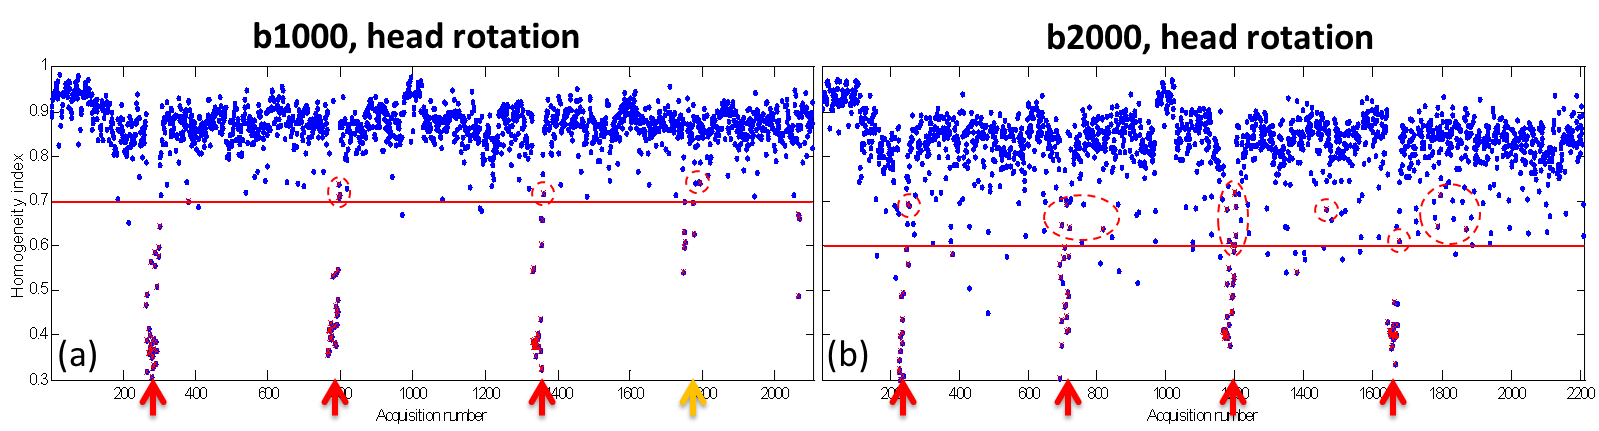
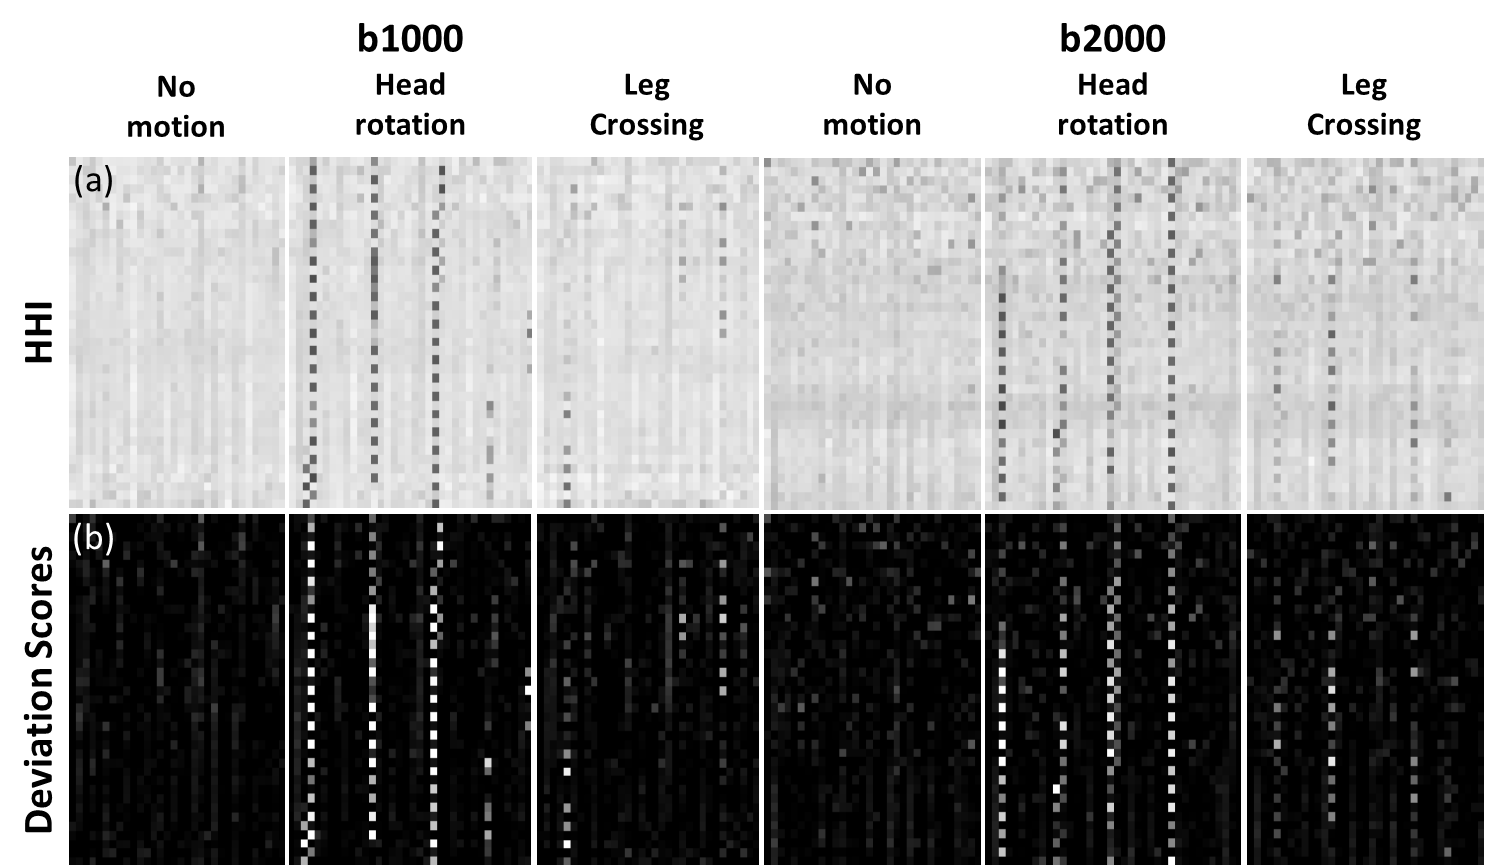
As shown in Figure 1, edge slices tend to have lower HHI, which could lead to misclassification of them to be motion corrupted. With the brain ROI, the HHI values are more consistent across slice locations. With the brain ROI, we were also able to correctly identify motion corrupted slices from leg crossing which was previously missed due to slices not covered by the box ROI (Figure 2). Figure 3 shows a comparison between the single thresholding and the adaptive thresholding approaches for different b values. The adaptive thresholding approach can properly detect motion slices at different b values, which will be well suited for multi-b value acquisitions. A comparison between the HHI and deviation score M are shown in heat maps in Figure 4 for different motion cases. Both metrics show clear motion volumes with the head rotation cases. With more subtle head motion caused by leg crossing, the deviation score appears to be more sensitive.DISCUSSION
We have developed an improved APITA-MDD method that is more automatic and robust to dMRI motion artifacts. APITA-MDD eliminates the need for user defined ROI for HHI calculation, has higher sensitivity to smaller head motions (e.g. from leg crossing), and is more robust to imaging conditions (e.g. image SNR, b-values, or scanner differences). Within the adaptive thresholding framework, motion re-acquisition can also be implemented more adaptive to subject co-operation as well. For example, a maximum re-acquisition percentage (e.g. 20%) could be specified, where only the most corrupted data will be re-acquired to ensure patient comfort.CONCLUSION
We show that the enhanced PITA-MDD motion detection method with automatic brain ROI delineation and adaptive thresholding can reliably detect large and small motion in the brain dMRI data. The enhanced will be incorporated into the prospective PITA-MDD sequence to achieve a more user-friendly motion-robust dMRI acquisition technique.Acknowledgements
Imaging conducted at the University of Maryland School of Medicine Center for Innovative Biomedical Resources, Translational Research in Imaging @ Maryland (CTRIM) – Baltimore, Maryland. The work is supported by grant NIH/NIDCD R01 DC014717 and NIH/NINDS R01 NS10505503-01A1.References
1. Liang X, Su P, Patil S, Elsaid N, Roys S, Stone M, Gullapalli R, Prince J, Zhuo J. Prospective Motion Detection and Re-acquisition in Diffusion MRI using Phase image-based Method (PITA-MDD). 2020 ISMRM & SMRT Virtual Conference & Exhibition, Aug. 8-14, 2020
2. Elsaid N, Prince J, Roys S, Gullapalli R, Zhuo J. Phase Image Texture Analysis for Motion Detection in Diffusion MRI (PITA-MDD) Magn Res Imaging 2019;62:228–41.
Figures