1347
Quantitative Evaluation of Multiband Diffusion MRI Data1Physics and Astronomy, University of Rochester, Rochester, NY, United States, 2Biostatistics and Bioinformatics, Emory University, Atlanta, GA, United States, 3Radiology and Imaging Sciences, Emory University School of Medicine, Atlanta, GA, United States, 4Biomedical Engineering, Emory University, Atlanta, GA, United States, 5Imaging Sciences, University of Rochester Medical Center, Rochester, NY, United States, 6Brain and Cognitive Sciences, University of Rochester, Rochester, NY, United States, 7Neuroscience, University of Rochester Medical Center, Rochester, NY, United States, 8Biostatistics and Computational Biology, University of Rochester Medical Center, Rochester, NY, United States
Synopsis
We sought to understand the implications of slice and phase acceleration factors on diffusion MRI (dMRI) data quality. As part of an on-going study about the impact of acceleration on dMRI quality, reconstruction, and data analysis, we acquired data from young and old, healthy subjects as well as mild cognitive impairment (MCI) subjects. From our study results, we found that there appears to be a trade-off between SNR loss due to higher acceleration and SNR gain from reducing the impact/magnitude of motion. Future studies should examine how the costs and benefits of acceleration impact diffusion metrics, tractography, and reproducibility.
Background
Diffusion MRI (dMRI) is a widely used MRI modality employed to quantify white matter integrity of the brain. Simultaneous multi-slice (SMS) imaging1, 2 is a technique to accelerate high-quality dMRI acquisition typically needed for advanced diffusion modeling. Despite time reductions, SMS introduces artifacts; in particular, noise amplification may lead to image degradation3 and TR reduction leads to signal loss due to reduced longitudinal magnetization recovery4. Selecting the optimal acceleration factor for dMRI is currently understudied5, 6; a better understanding of how SMS influences data quality and subsequent post-processing steps is critically important in study designs to improve the estimation of biological effects.Methods
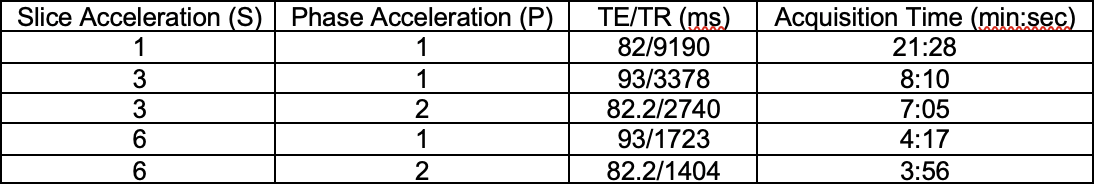
As part of an on-going study about the impact of SMS on dMRI quality, reconstruction, and data analysis, 11 scans from 6 young, healthy subjects (average age – 26.5, 50% female), 16 scans from 8 old, healthy subjects (average age – 70.5, 50% female), and 7 scans from 5 subjects with mild cognitive impairment (MCI) (average age – 64, 43% female) were acquired.MRI protocol was conducted on a Siemens 3T Prisma scanner (Erlangen, Germany) on a 64-channel head and neck coil. Sequences included T1-MPRAGE (TE/TR = 2.34/2530 ms, TI = 1100 ms, 1x1x1 mm3 resolution, 192 slices/slab) and dMRI consisting of multiple SMS and in-plane (phase; GRAPPA) acceleration factors (Table 1). We will use S(n)P(m) notation, where n refers to SMS factor, and m to GRAPPA factor (e.g., S3P2 = SMS factor of 3 and GRAPPA factor of 2). TE were matched for S3P1 and S6P1, S3P2 and S6P2. All dMRI data had a corresponding reverse (PA) phase-encoding map for distortion correction. For the older groups, dMRI scan order was randomized to avoid confounding factor of protocol order.
Pre-processing of dMRI data was implemented using FSL topup7 and eddy8. Outliers were replaced using a Gaussian Process algorithm9. Quality control metrics were extracted using FSL built-in quality control scripts10. These included absolute and relative motion, number of outlier volumes, signal-to-noise ratio (SNR) for b=0 data, and contrast-to-noise ratio (CNR) for the b=1000 and 2000 data. We calculated the “corrected” SNR and CNR by normalizing to to account for T1 saturation effects. Absolute motion is the amount of movement from the first acquisition, while relative motion is the amount of movement from the previous acquisition. We used the time series of relative motion to derive the average amount of motion during the b=0, b=1000, and b=2000 acquisitions.
Results
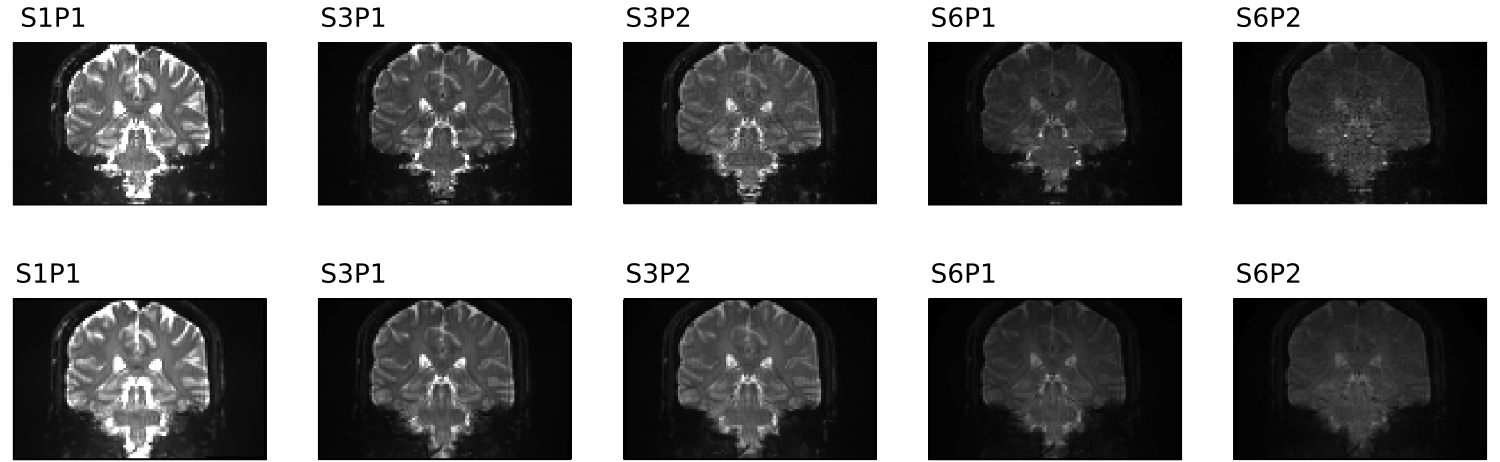
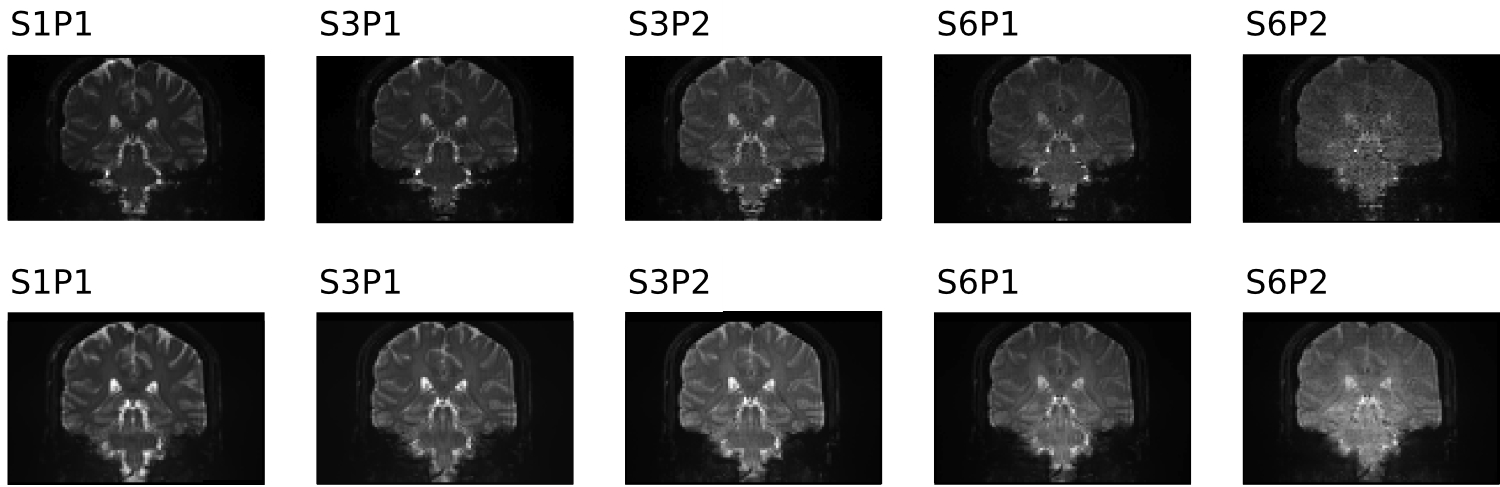
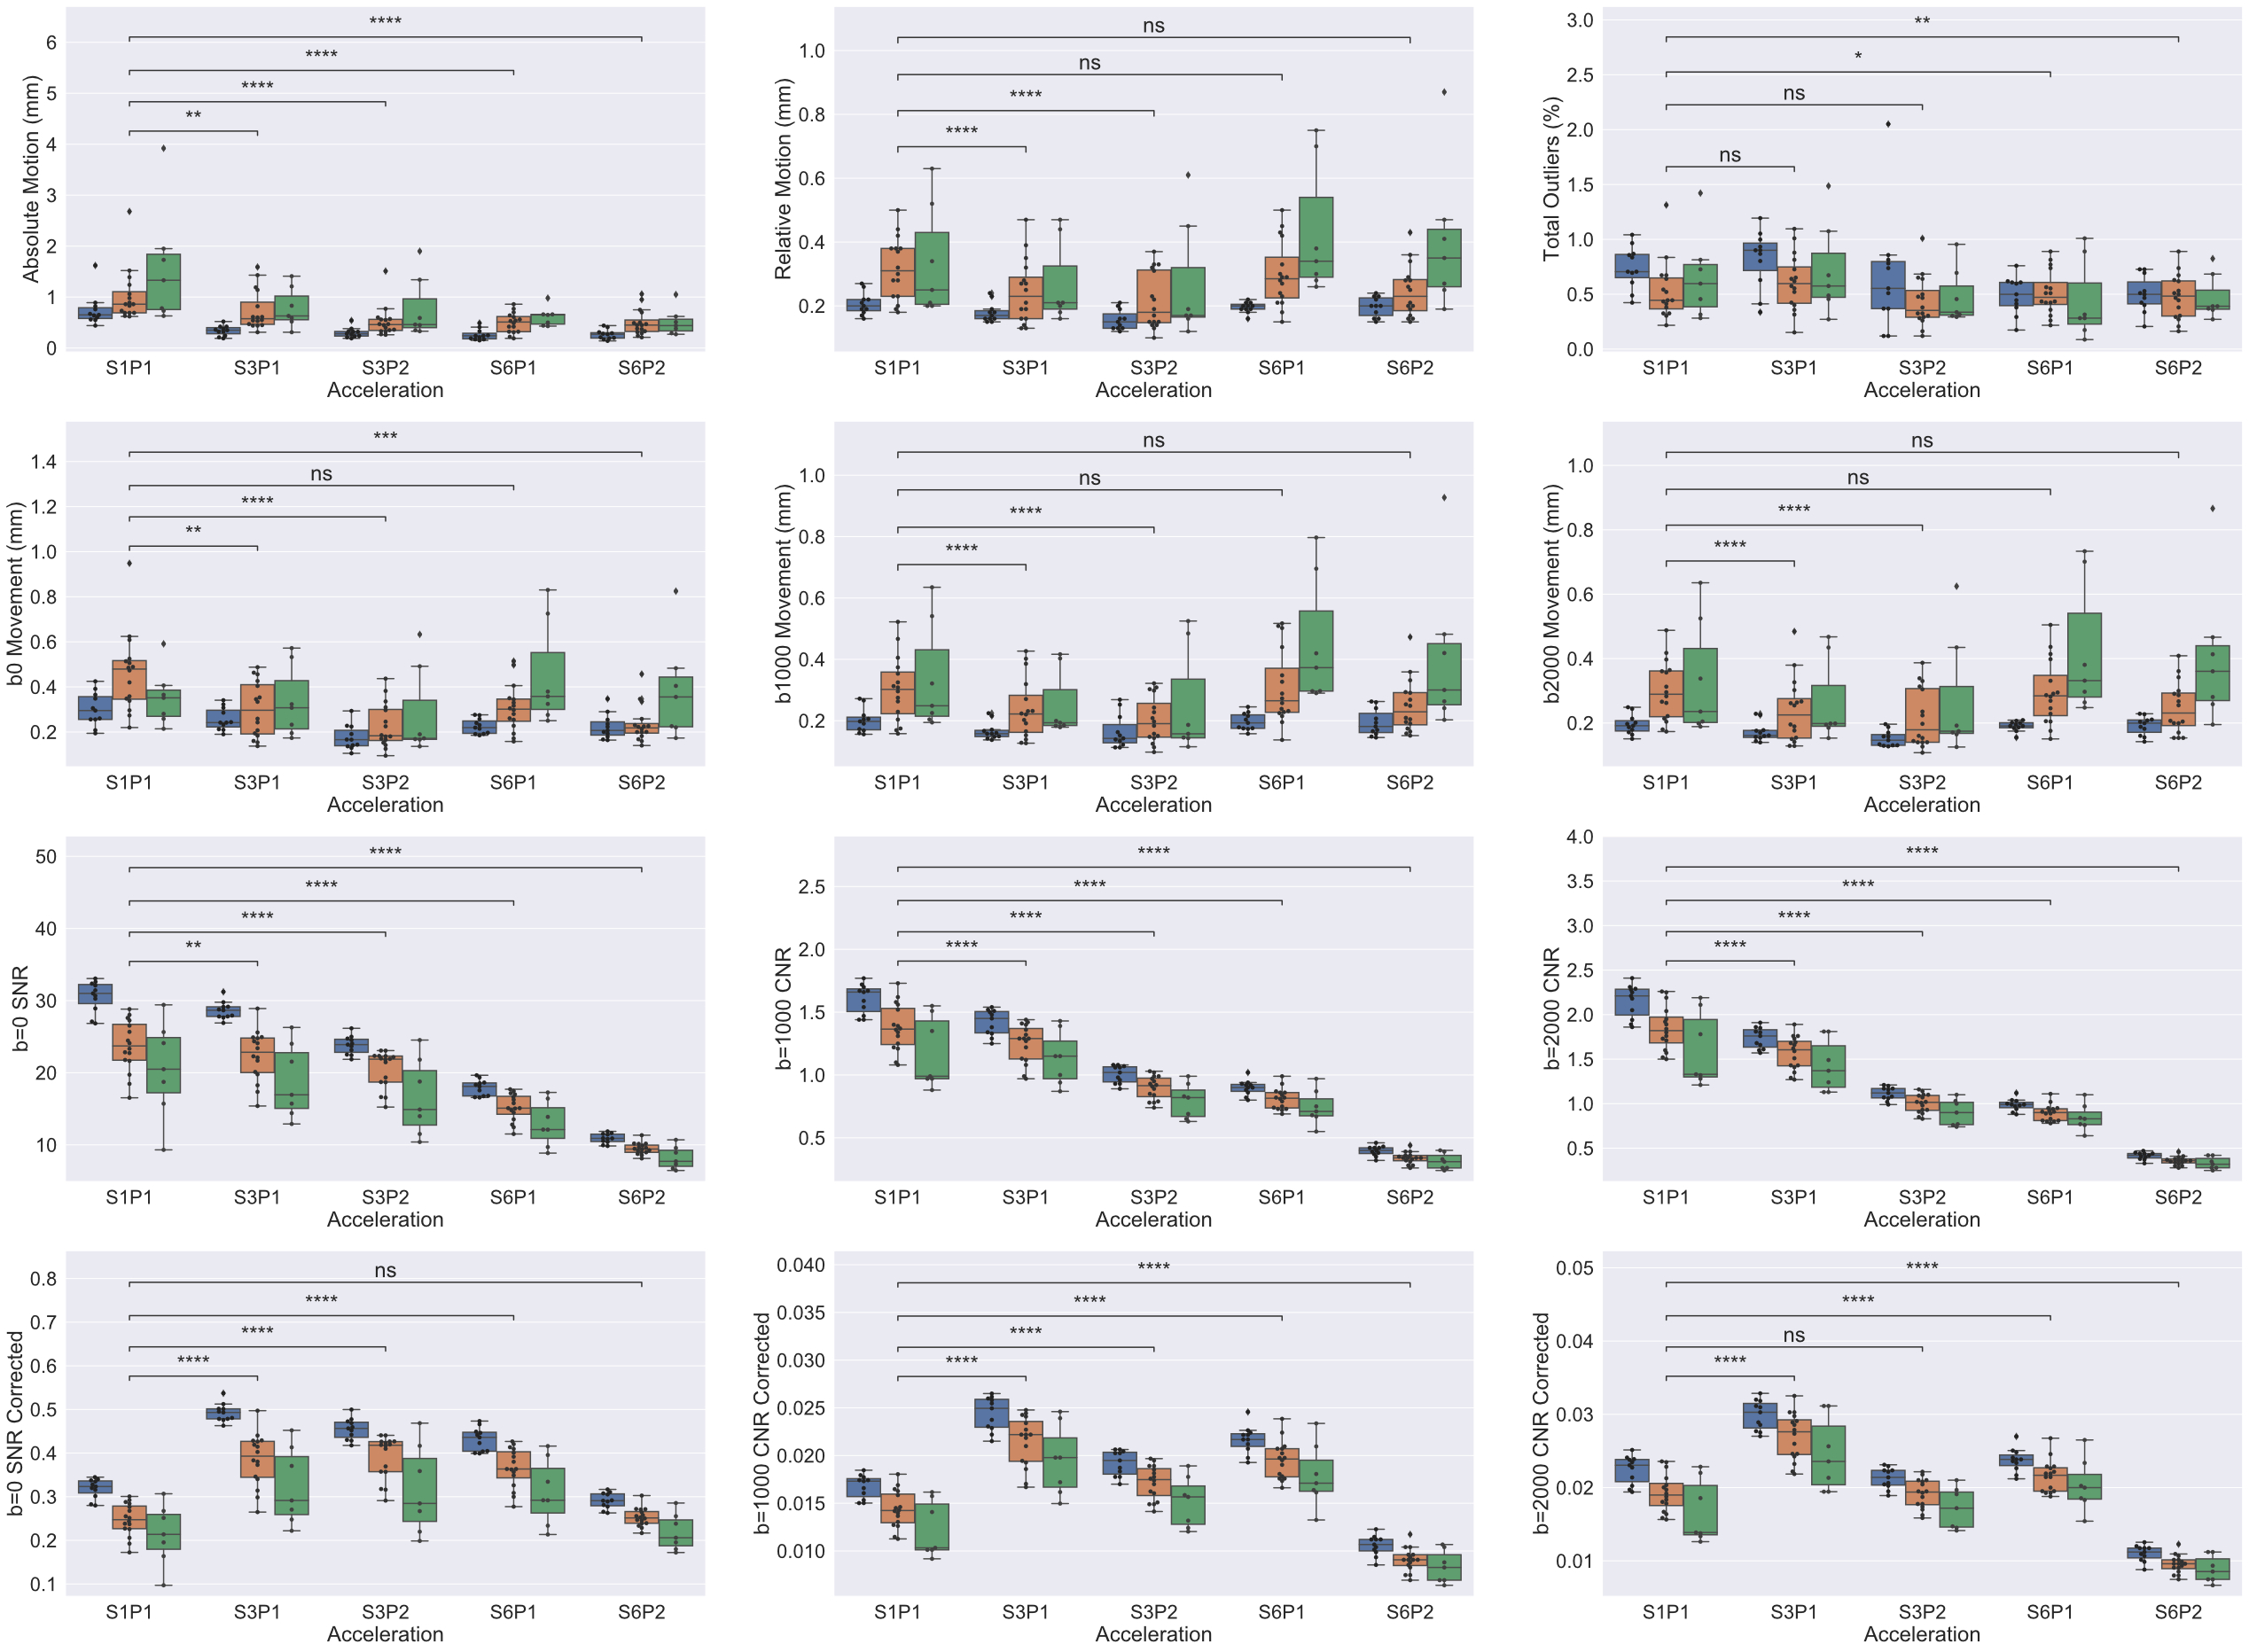
Figure 1 shows dMRI images in a subject before (top row) and after preprocessing (bottom row). Decreased signal intensity was seen with higher acceleration factors due to T1 saturation effects associated with shorter TR at higher SMS factor. To better visualize noise, Figure 2 shows images after intensity normalization.Figure 3 shows boxplots of metrics defined in the Methods section. Absolute motion was decreased across all acceleration schemes, with the older groups moving more. There was a reduction in SNR and CNR as a function of acceleration in all cohorts, and both were lower in the older groups. For SMS factor 6, relative motion was not decreased compared to the unaccelerated acquisition. The corrected SNR and CNR were increased in all acceleration factors relative to S1P1 except for S6P2, where the b=0 SNR was not different and the CNRs were significantly decreased.
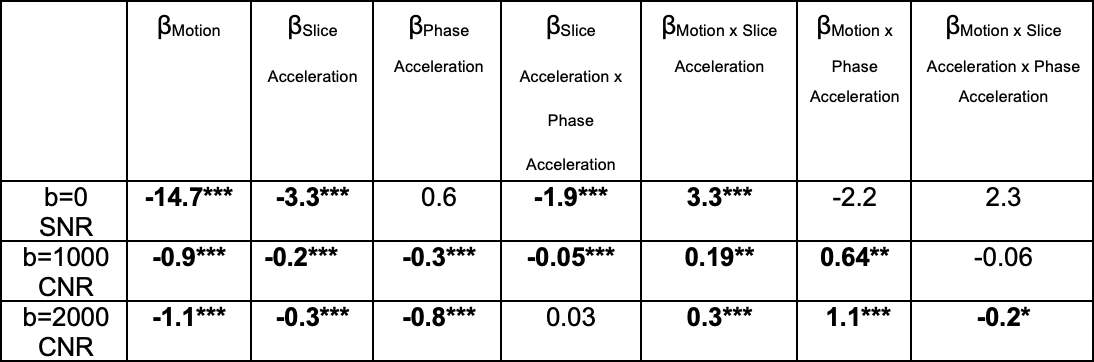
To understand how much of the differences in SNR and CNR seen in Figure 3 were influenced by motion and acceleration, we fit a Generalized Estimating Equation (GEE) with subject as the cluster variable and an exchangeable correlation to probe for effects of motion, slice acceleration, and phase acceleration (Table 2). SNR and CNR were negatively related to patient motion. Increased slice acceleration was negatively related to SNR and CNR, this effect was further decreased by phase acceleration in the b=0, b=1000 shells (fourth column). The negative effect of motion is attenuated by slice and phase acceleration, as indicated by the positive coefficient of their interactions with motion.
Discussion
In this study, we sought to understand the implications of slice and phase acceleration factors on dMRI data quality. Absolute motion was decreased in all acceleration schemes, probably due to the shorter acquisition time. Older groups had lower SNR and CNR, potentially due to increased T111 and decreased T212 values of the aging brain. After correction, the S3P1, S3P2, and S6P1 acceleration schemes all showed higher b=0 SNR, opposite of what was seen in the uncorrected SNR. Further research should probe which of these SNR measurements is more relevant to downstream data analysis. We found that decreased b=0 SNR in our scans was related to acceleration parameters; as b=0 estimation is essential for data normalization, this is an important consideration. The b=1000 and b=2000 CNR were significantly influenced by motion; however, this was slightly reduced by higher acceleration factors, as evidenced by positive interaction terms between motion and slice/phase acceleration. This suggests that motion is more problematic in scans with lower acceleration factors. There appears to be a trade-off between SNR loss due to higher acceleration and SNR gain from reducing the impact/magnitude of motion. Future studies should examine how the costs and benefits of acceleration impact diffusion metrics, tractography, and reproducibility.Acknowledgements
We would like to thank all participants in this study. This study was funded by NIH grant AG066970 and an intramural pilot grant provided by the Center for Advanced Brain Imaging and Neurophysiology (CABIN) at the University of Rochester.References
1. Lee, K.J., et al., Simultaneous multislice imaging with slice-multiplexed RF pulses. Magn Reson Med, 2005. 54(4): p. 755-60.
2. Larkman, D.J., et al., Use of multicoil arrays for separation of signal from multiple slices simultaneously excited. J Magn Reson Imaging, 2001. 13(2): p. 313-7.
3. Xu, J., et al., Evaluation of slice accelerations using multiband echo planar imaging at 3 T. Neuroimage, 2013. 83: p. 991-1001.
4. Feinberg, D.A. and K. Setsompop, Ultra-fast MRI of the human brain with simultaneous multi-slice imaging. J Magn Reson, 2013. 229: p. 90-100.
5. Setsompop, K., et al., Pushing the limits of in vivo diffusion MRI for the Human Connectome Project. Neuroimage, 2013. 80: p. 220-33.
6. Zhao, T., et al., Test-retest reliability of white matter structural brain networks: a multiband diffusion MRI study. Front Hum Neurosci, 2015. 9: p. 59.
7. Andersson, J.L., S. Skare, and J. Ashburner, How to correct susceptibility distortions in spin-echo echo-planar images: application to diffusion tensor imaging. Neuroimage, 2003. 20(2): p. 870-88.
8. Andersson, J.L.R. and S.N. Sotiropoulos, An integrated approach to correction for off-resonance effects and subject movement in diffusion MR imaging. Neuroimage, 2016. 125: p. 1063-1078.
9. Andersson, J.L.R., et al., Incorporating outlier detection and replacement into a non-parametric framework for movement and distortion correction of diffusion MR images. Neuroimage, 2016. 141: p. 556-572.
10. Bastiani, M., et al., Automated quality control for within and between studies diffusion MRI data using a non-parametric framework for movement and distortion correction. Neuroimage, 2019. 184: p. 801-812.
11. Steen, R.G., S.A. Gronemeyer, and J.S. Taylor, Age-related changes in proton T1 values of normal human brain. J Magn Reson Imaging, 1995. 5(1): p. 43-8.
12. Siemonsen, S., et al., Age-dependent normal values of T2* and T2' in brain parenchyma. AJNR Am J Neuroradiol, 2008. 29(5): p. 950-5.
Figures