1344
Optimal Diffusion Sampling Scheme for High Performance Gradients1General Electric Global Research, Niskayuna, NY, United States, 2Walter Reed National Military Medical Center, Bethesda, MD, United States, 3Uniformed Services University of the Health Sciences, Bethesda, MD, United States
Synopsis
In order to establish a benchmark for future studies, we utilize a data driven approach towards optimizing diffusion sampling for an ultra-high-performance gradient MRI sub-system as a means to establish minimal discrepancy compared to a fully sampled, defined superset. This study focused on b-value contribution and the impact of decreased sampling on uncertainty of diffusion and kurtosis tensor estimates, and fiber orientation to resolve sub-voxel information.
Introduction
Utra-high-performance gradient subsystems1 have enabled the combination of increased gradient strength with fast gradient slew rates in diffusion imaging to achieve shorter EPI echo spacing and shorter TE times. Higher spatial and temporal resolution can be targeted with shorter TE times and stronger diffusion weighting, enabling the study of brain microstructure in a more relevant parameter space. dMRI acquisitions are time intensive and encoding schemes need to be optimized to maximize information content while balancing SNR and acquisition time limitations. Informed by the number of shells, the b-values, and the directions sampled for each shell, the optimal sampling space has been extensively discussed2-5. Typically, the sampling and parameter space is set a priori. However, there is still a lack of consensus regarding an optimal sampling scheme for which maximum information from a given set of q samples can be extracted, irrespective of the reconstruction pipeline.In this study a multi-shell acquisition scheme was optimized by evaluating the information content of the signal. The analysis leveraged the availability of an oversampled superset from which candidate subsets could be evaluated as a means to establish minimal discrepancy compared to the defined superset. Utilizing a data driven approach, joint evaluation of sampling scheme and parameter estimation was performed with the objectives: 1) to establish b-value and shell distributions that minimize discrepancy compared to a defined superset, and 2) to capture key quantitative features whereby any further increase in sampling parameters would only serve to increase SNR.
Methods
Defined as a superset, healthy volunteers were scanned under an IRB-approval with written informed consent, on a 3T MRI GE SIGNA MR750 (GE Healthcare, Waukesha, WI, USA), equipped a high-performance head-only gradient (MAGNUS), using a 32-channel phased array head coil (NOVA Medical, Wilmington, MA, USA). The MAGNUS gradient coil operates at 200 mT/m simultaneously with a maximum slew rate of 500 T/m/s. A multi-shell acquisition was used with 45, 60, 80, and 100 directions uniformly sampled over a sphere at b-values of 500, 1000, 2000, and 4000 s/mm2. An additional 16 non-diffusion weighted (T2-weighted, b=0) images were interspersed through the acquisition. For TE/TR = 44.2/7000ms, 160x160x86 matrix, diffusion data were acquired with an isotropic resolution of 1.5x1.5x1.5 mm3 with a total acquisition time of 30 min.Diffusion weighted images were corrected for gradient non-linearity, eddy current distortion, bulk motion and susceptibility using an in-house image processing pipeline. Based on this superset, subsampling was performed with following approaches: 1) shell rejection, to evaluate b-value contribution, and 2) uniform iterative subsampling such that the subset sampling pattern minimized the energy of electrostatic repulsion for points on a sphere6, maximizing angular incoherence. An additional constraint of ensuring the same condition number, as the superset, was imposed in order to constrain noise7.
Diffusion and kurtosis tensors were fitted to all data using an iterative weighted least-squares approach and fractional anisotropy (FA) and orthogonal kurtosis (OrthoK) maps were computed. White matter (WM), grey matter (GM), and cerebrospinal fluid (CSF) segmentations in the brain were used to evaluate the repeatability of tensor derived parameters. MSMT-CSD (mrtrix8) was used to evaluate the impact of angular sampling on recovered fiber orientation distribution functions (fODFs) over the experimental range.
Results and Discussion
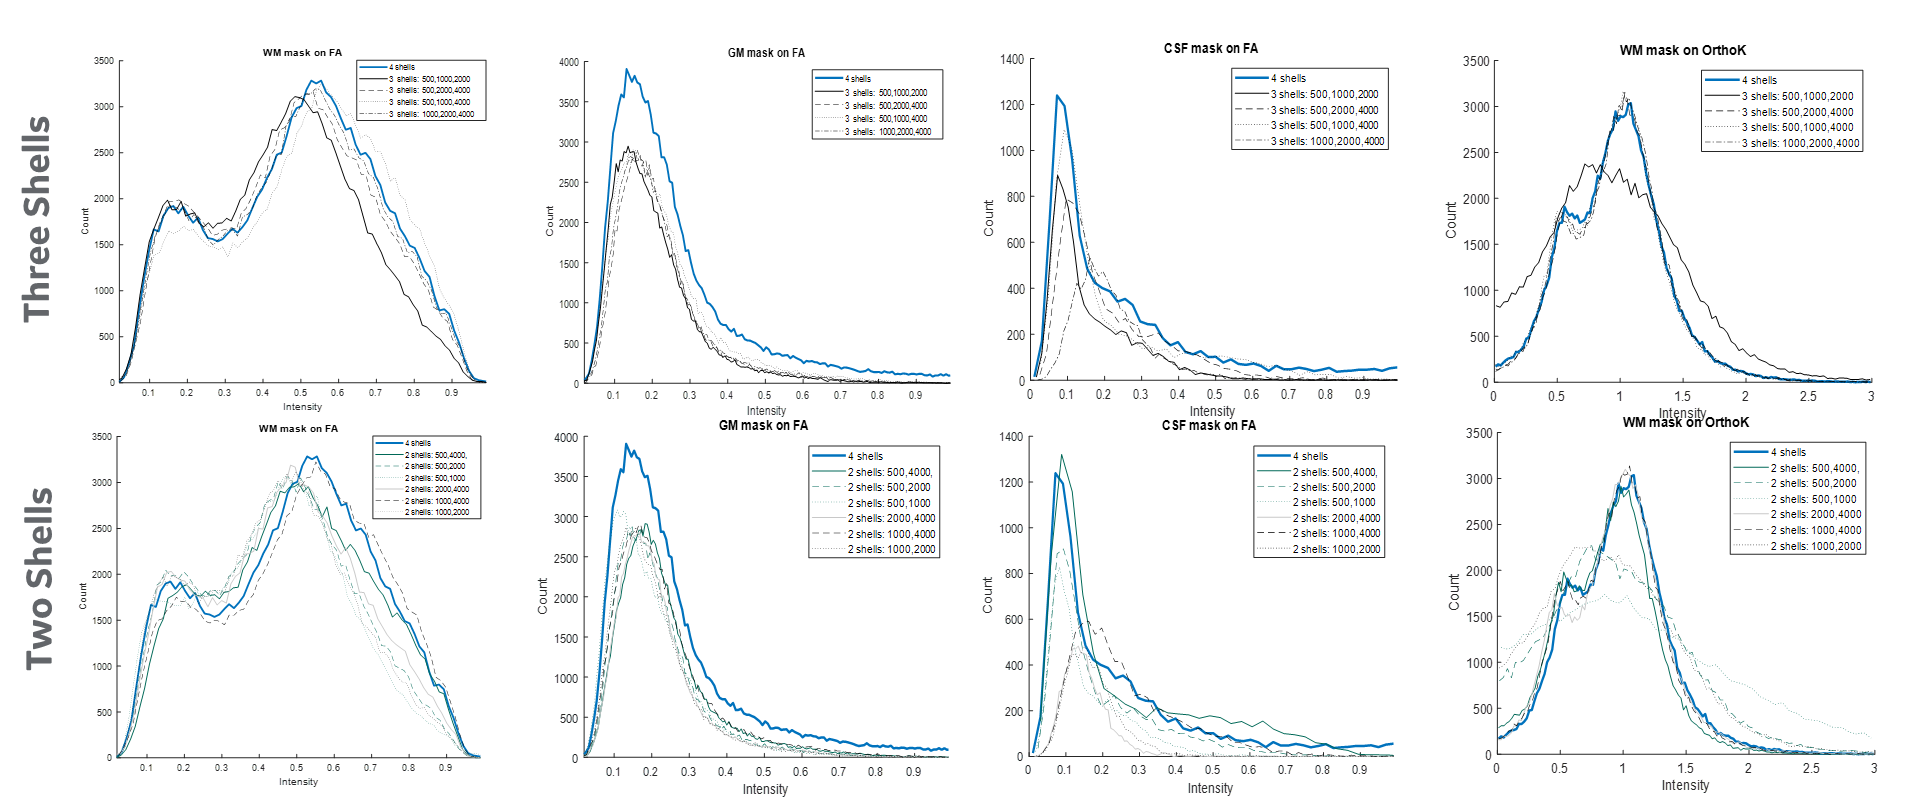
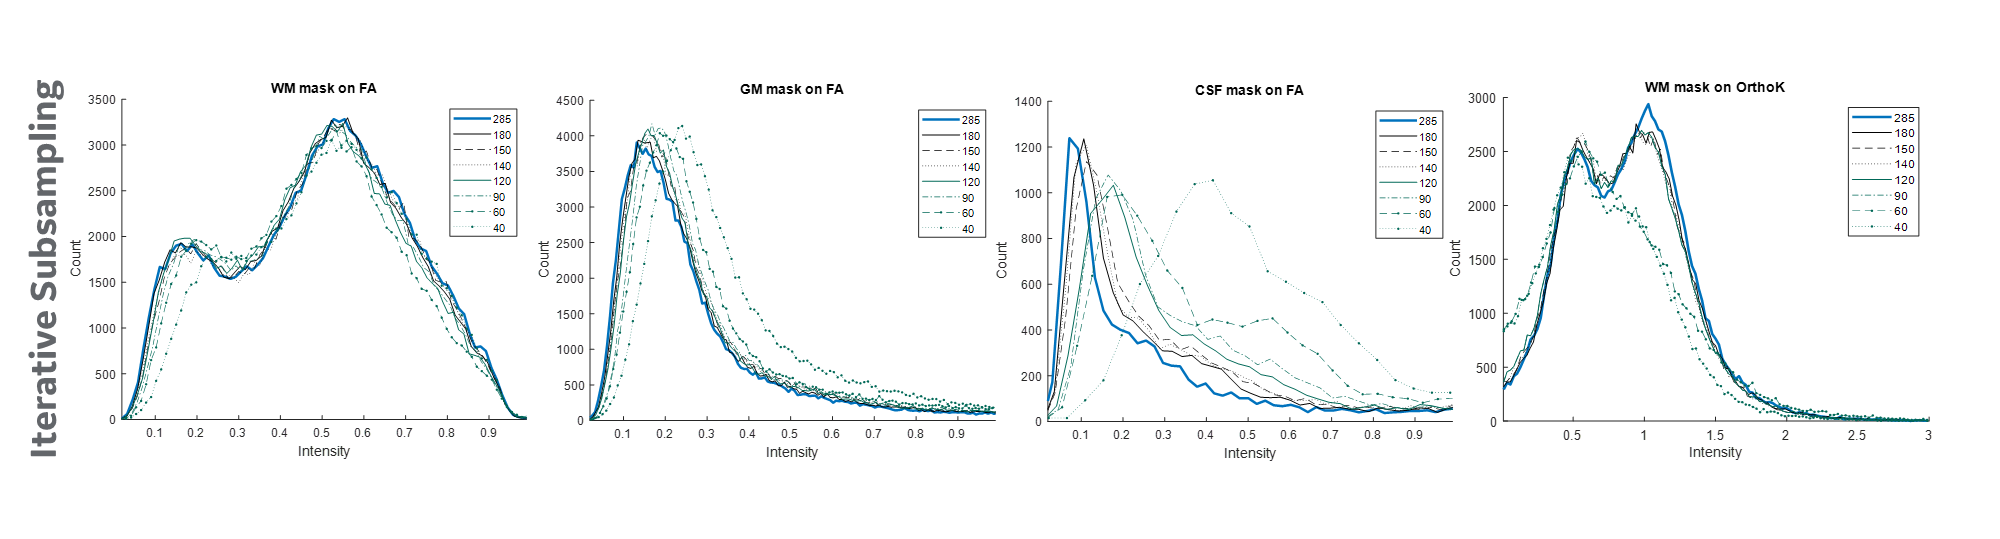
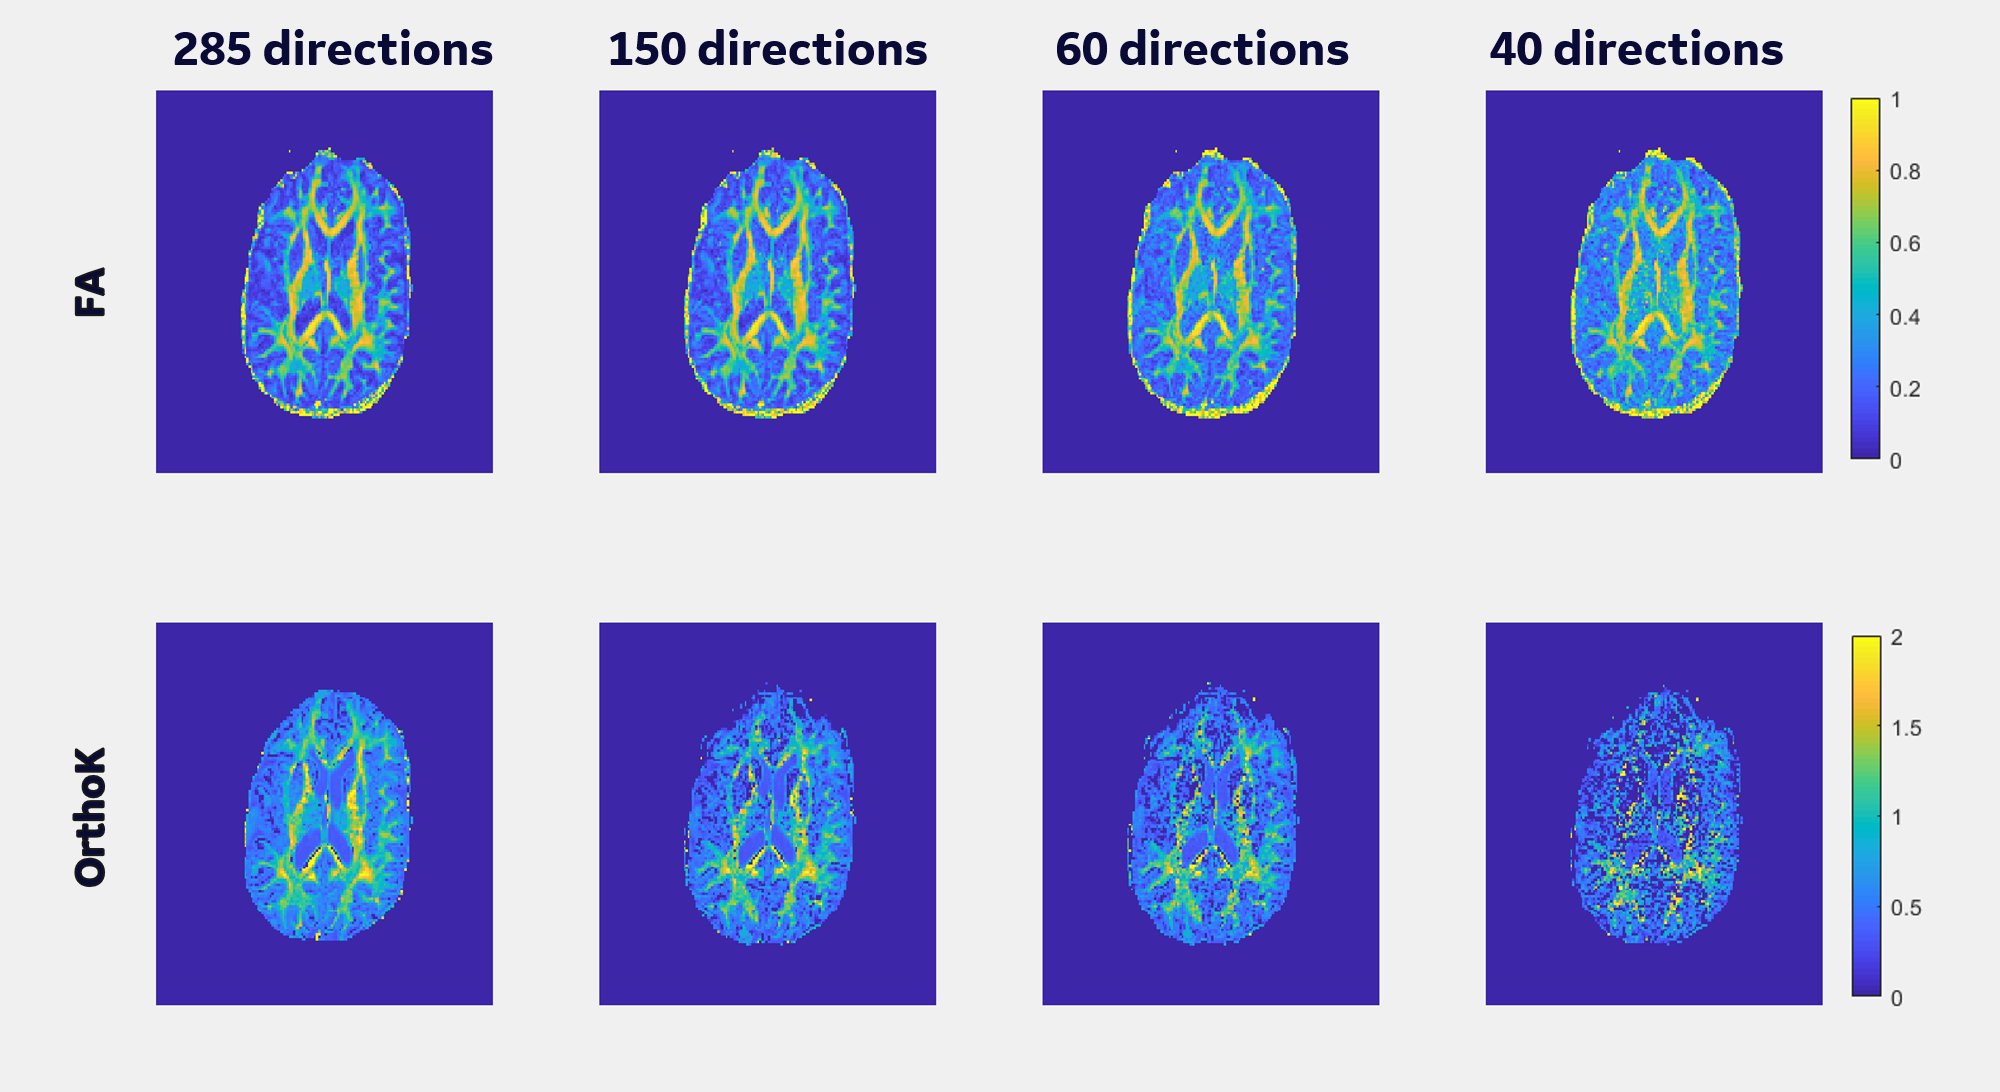
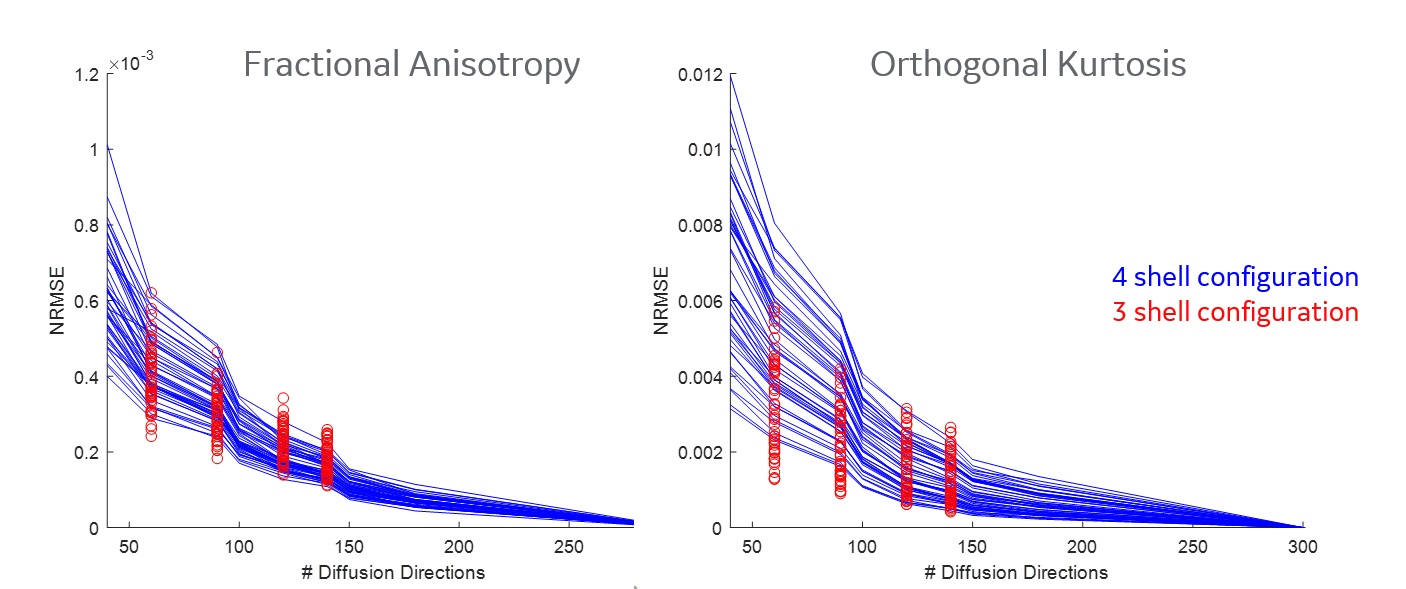
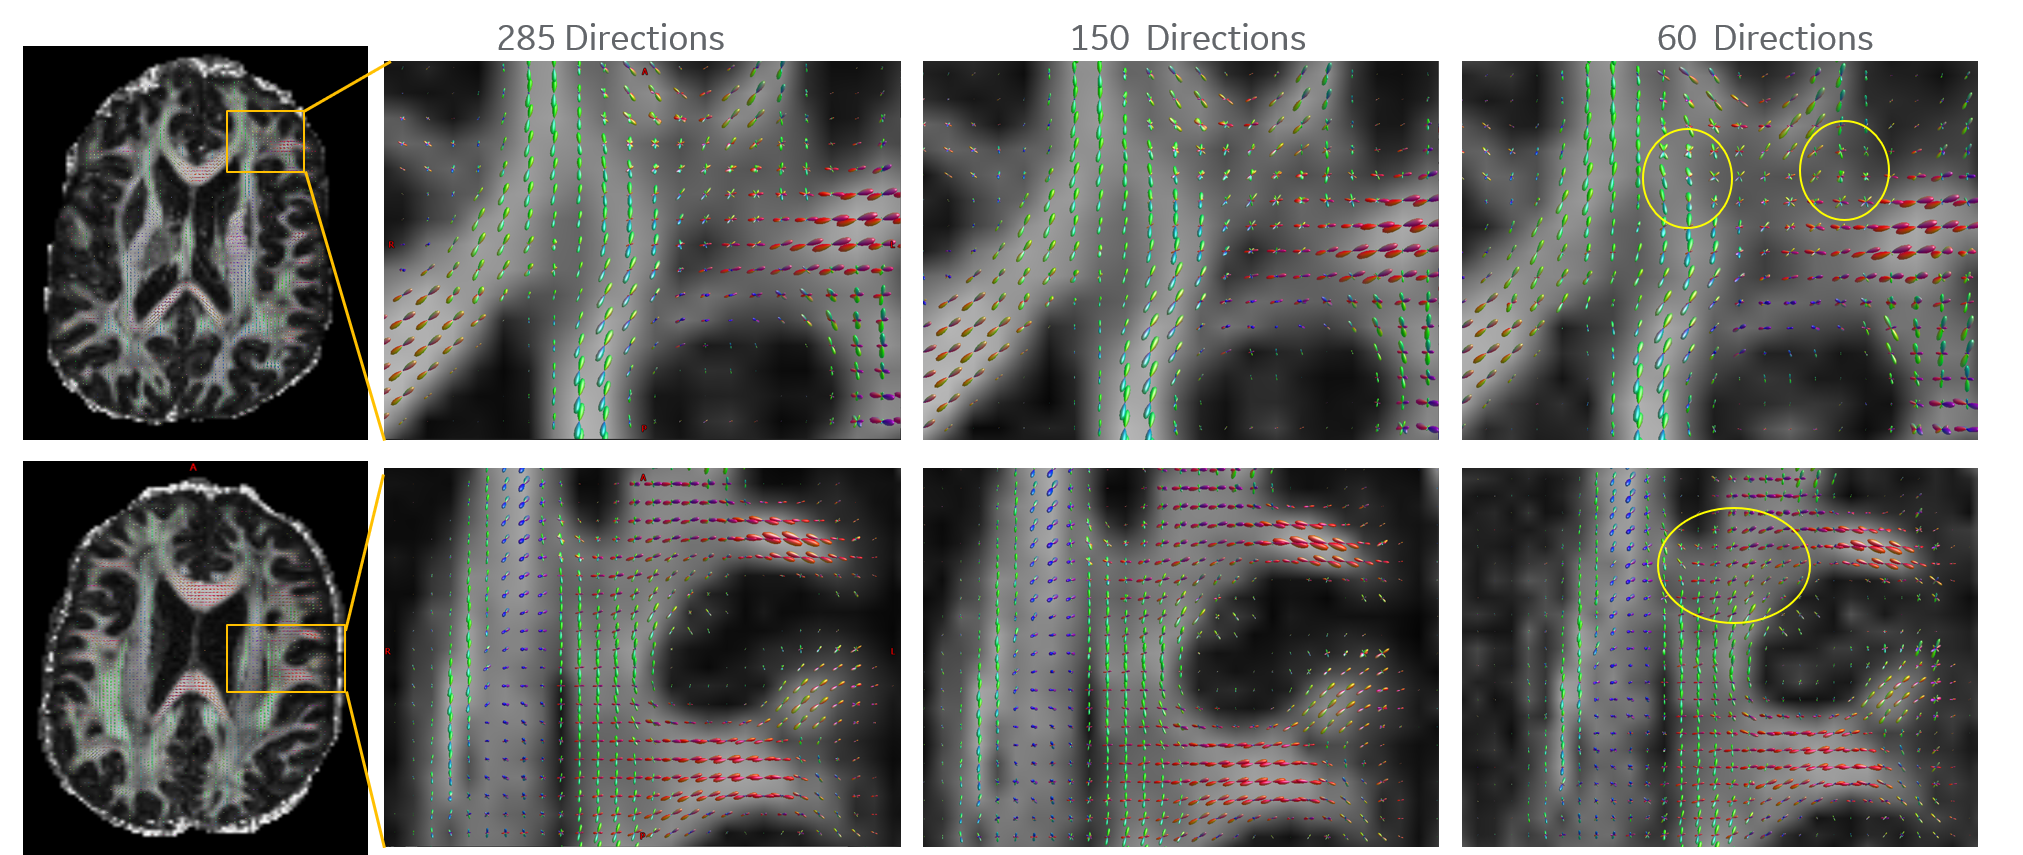
Figure 1 shows the b-values contributing most to noise performance (b=500 s/mm2) and angular content (b=4000 s/mm2). Dependent on the combination of b-values, a three-shell scheme performed on par with the superset. Similar to an earlier report9, as long as the b=4000 s/mm2 shell was adequately sampled, a two-shell scheme can also be utilized. However, with a two-shell acquisition, higher FA and decreased discrimination was observed in the CSF compartments indicating lack of robustness over a weighted two-point fit.Higher b-value shell angular contribution was critical for kurtosis measures, and the strong dependence was reinforced with uniform subsampling (Figure 2), where for >90 directions (or <40 directions on the b=4000 s/mm2 sphere), results were limited by noise. Shell deletion and optimized sampling on the b=4000 s/mm2 shell allowed for a reduction in the bias (Figure 3). Interestingly, angular content evaluated using fODFs indicated that though there was a slight uptick in noise in the interfacial and fiber crossing regions, the principal component was retained (Figure 4), underscoring that angular contribution for sampling schemes cannot be evaluated based on the noise performance of fODF estimation alone.
Conclusions
Using in vivo data, the achievable SNR was differentially impacted by motion, susceptibility, physiological effects even scan duration. With these sources of error, the achievable SNR can reach an asymptote sooner than predicted from simulations alone. As such, the SNR profile dictates the power of each shell and whether tensor metrics or higher order modeling efforts are robust. This study highlighted the impact on tensor derived parameters stemming from the number of directions on each shell, suggesting that the optimal scheme be tailored based on the SNR characteristics of the data. Furthermore, with uniform point distribution over each shell, the sampling scheme can be tailored to establish minimal bias in quantitative metrics.Acknowledgements
Grant funding from NIH U01EB28976, CDMRP W81XWH-16-2-0054References
1. Foo TK, et al., Magn Reson Med. 2019
2. Jones DK. et al., Magn Reson Med. 2004.
3. Batchelor P., et al Conference Proceedings 2002.
4. Hasan KM, et al., JMRI. 2001
5. Papadakis NG, et al., MRI. 2000.
6. D. K. Jones, et al., Magn. Reson. Med. 1999
7. Skare S, et al., J Magn Reson. 2000
8. Tournier, J.-D. et al., NeuroImage, 2019
9. Varadarajan, Divya, and Justin P Haldar. Proceedings. IEEE International Symposium on Biomedical Imaging 2018
Figures