1332
Improved Super-Resolution reconstruction for DWI using multi-contrast information1Center for Biomedical Imaging Research, Department of Biomedical Engineering, School of Medicine, Tsinghua University, Beijing, China, 2MR Clinical Science, Philips Healthcare, Suzhou, China
Synopsis
In clinical scans, the acquired DWI images usually has limited resolution. Super resolution method has the potential to improve the image resolution without adding scan time. Here we propose a deep-learning based multi-contrast super resolution network with gradient-map guidance and a novel FA loss function to reconstruct high-resolution DWI images from low-resolution DWI images and high–resolution anatomical images. In-vivo DWI data are used to test the proposed method. The results show that the image quality can be improved.
Introduction
Diffusion-weighted MRI provides valuable information for neuroscience study and neural disease diagnosis1. However, the available image resolution for clinical DWI scan is limited. Efforts have been made to improve the resolution of DWI images yet these techniques may increase scan time2-3. Super resolution is a post-processing method to improve image resolution without the need to update the imaging sequence. Recently, deep learning-based super resolution methods have been proposed4-7. They outperform many traditional methods while they still cause over-smoothing and blurring in MRI images. Here we propose a 3D super resolution network based on a multi-level dense network with the guidance of gradient map information. Meanwhile, we introduce a subnet to fuse structure information from high-resolution T2w images. An additional FA loss function is introduced to exploit the joint information among diffusion directions to improve the reconstruction accuracy.Theory
Network structureThe network structure is shown in Fig .1a. The network has five branches including two feature extraction branches, one reconstruction branch, one gradient estimation branch and one FA calculation branch.
Each of the feature extraction branches uses a densely connected 3D CNN network with multi-level fusion. Structure of Residual block is shown in Fig. 1b. Outputs of different blocks are fused together before the reconstruction through a bottleneck structure. An additional feature extraction branch is used to extract information from T2W images since directly using T2W images as extra input may introduce contrast contamination.
The gradient branch has gradient blocks composed of fusion and 3D Conv layers. Each gradient block fuses the feature maps of the Residual block to update the gradient map estimation. The estimated gradient maps $$$I_{gradmap}$$$ are compared to the gradient maps obtained from reference images as a loss function.
The reconstruction branch uses a 3D deconvolution layer to recover the HR images. Then 3D Conv layers fuse the estimated gradient maps with feature maps and obtain SR results.
FA loss
Here we introduce a novel FA loss function to further explore the relationships between diffusion directions. Since FA is calculated by tensor fitting and eigenvalue calculation, the loss cannot be easily back propagated. Thus, we pre-train an ANN network G to calculate the FA using input DWI images.The network uses high-resolution patches as input and calculates the FA maps. The FA loss can be expressed as
$$l_{FA}=\parallel G(I_{SR})-G(I_{HR})\parallel_2$$
Then, the network tries to optimize the following loss:
$$ {\min_ {\theta}} l_{ssim}+\alpha_1\parallel \triangledown(I_{SR})-\triangledown(I_{HR})\parallel_1+\alpha_2\parallel I_{gradmap}-\triangledown(I_{HR})\parallel_1+\alpha_3l_{FA}$$
Where $$$\theta$$$ represents trainable parameters and $$$ \alpha_i$$$ represents tradeoff parameters
Method
In-vivo DWI dataset:Twelve healthy volunteers were scanned on a Philips Ingenia 3T scanner using PSF-EPI DWI and T2W-TSE sequence (Philips Healthcare, Best, The Netherlands). The images were acquired with 1*1 mm2 in-plane resolution. 1 b0 and 6 b1000 dirs were acquired for DWI.The DWI images were downsampled to 2*2 mm2 in plane. We split subjects into 9, 2, 1 for training, validation and testing respectively. Each subject has 25 slices. Firstly we used FSL8 to calculate FA maps from high-resolution DWI images as target to pre-train the FA calculation network and fixed the weights. Then we trained the proposed SR network. The input LR patch size was 28*28*16 and the total number of paired patches for training was 18207.
Evaluation
We compared the proposed method to previously reported SRCNN4 and SRResNet9. The netwroks were modified to include T2W images as input. Besides, to demonstrate the value of FA loss function, we compared the performance of the proposed network with and without FA loss. The nRMSE and SSIM of the SR images were calculated and colored FA maps of SR images were obtained using FSL.
Results and discussion
Fig. 2 shows b0 and mean DWI images along with zoomed-in results from 2 representative slices for in-vivo DWI data. Based on the zoomed-in results, SRCNN and SRResNet show more blurring. Detailed structures can be better preserved by the proposed method as pointed by the yellow arrowheads.Fig. 3 shows the results of the pre-trained FA calculation network. As shown in the images, FA maps can be calculated accurately.
The quantitative evaluation results are shown in Fig. 4. The proposed networks with and without FA loss both have lower nRMSE and higher SSIM compared to the previously reported networks.
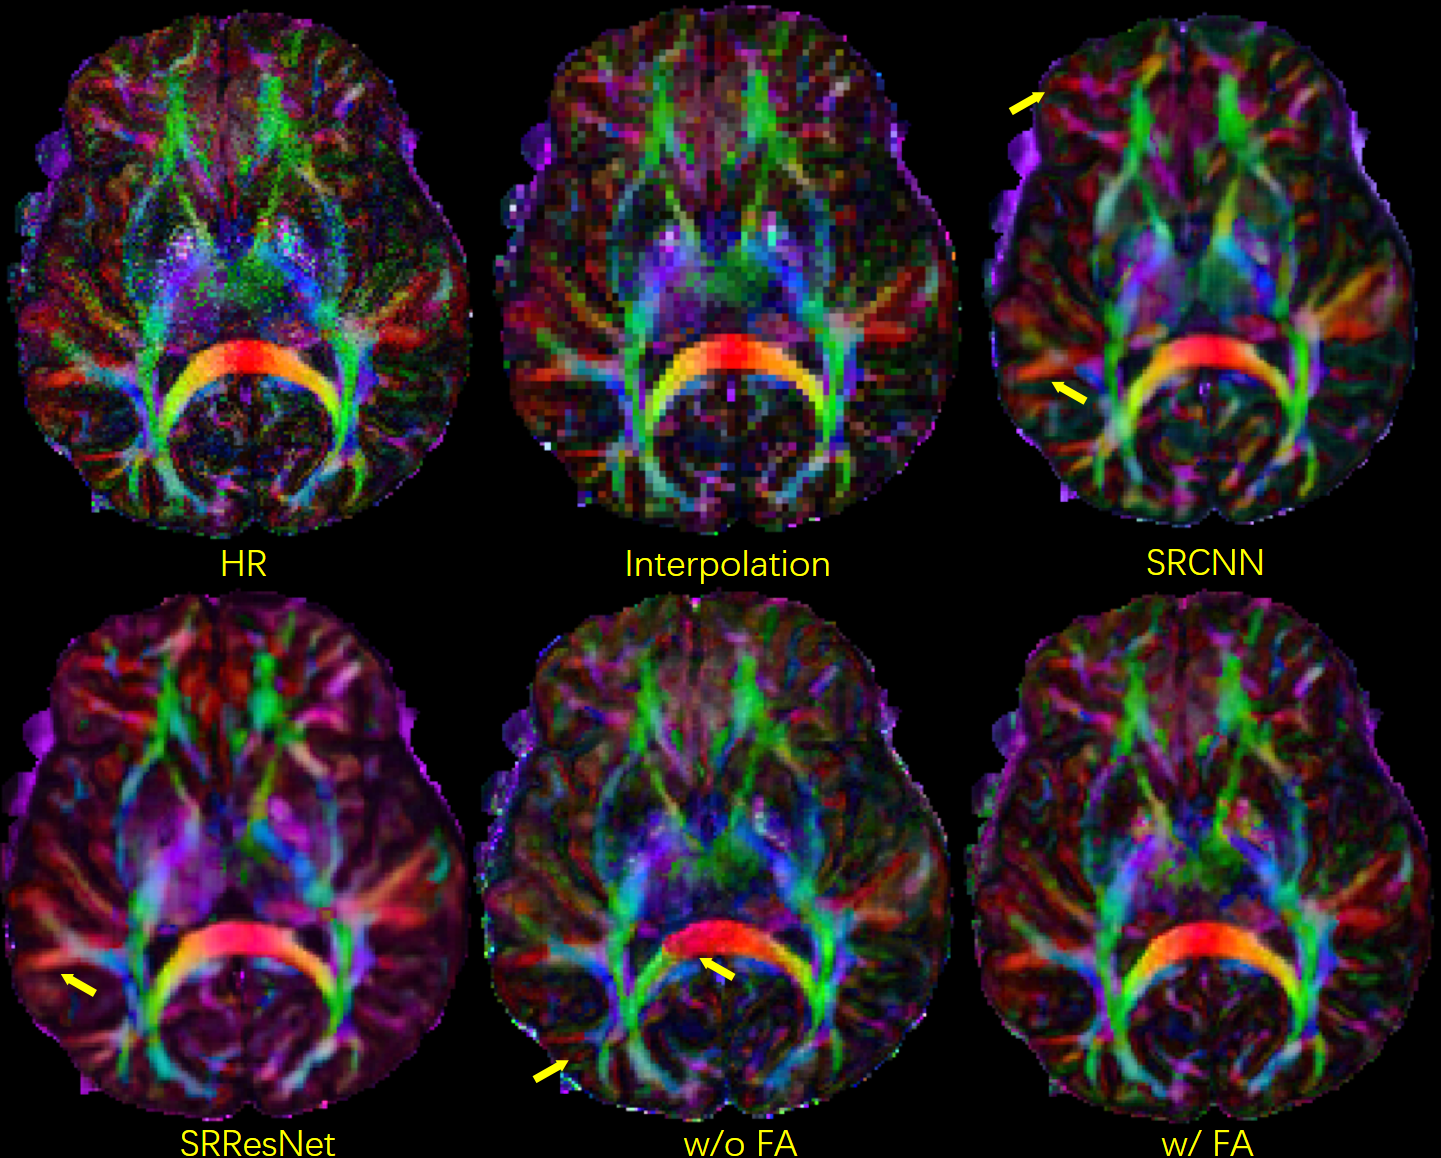
Colored FA maps calculated from PSF-EPI data are shown in Fig. 5. The proposed method with FA loss preserves fine fiber structures and the color distributions are more accurate. Compared to the network without FA loss, the introduction of FA loss can reduce contrast contamination between diffusion directions.
Conclusion
We propose a multi-contrast gradient-guided multi-level super resolution network with FA loss. The proposed method further explored the relationship between different diffusion directions and improved the image quality. The results show improved performance compared to SRCNN and SRResNet.Acknowledgements
No acknowledgement found.References
1.Bammer R. Basic principles of diffusion-weighted imaging. Eur J Radiol 2003;45(3):169-184.
2.Chen NK, Guidon A, Chang HC, Song AW. A robust multi-shot scan strategy for high-resolution diffusion weighted MRI enabled by multiplexed sensitivity-encoding (MUSE). Neuroimage 2013;72:41-47.
3.Dong ZJ, Wang FYX, Reese TG, et al. Tilted-CAIPI for highly accelerated distortion-free EPI with point spread function (PSF) encoding. Magnetic Resonance in Medicine 2019;81(1):377-392.
4.Dong C, Loy CC, He KM, Tang XO. Image Super-Resolution Using Deep Convolutional Networks. Ieee T Pattern Anal 2016;38(2):295-307.
5.Lyu Q, Shan HM, Steber C, et al. Multi-Contrast Super-Resolution MRI Through a Progressive Network. Ieee T Med Imaging 2020;39(9):2738-2749.
6.Ma C, Rao Y, Cheng Y, et al. Structure-Preserving Super Resolution with Gradient Guidance. Proceedings of the IEEE/CVF Conference on Computer Vision and Pattern Recognition 2020; 7769-7778.
7.Chen YH, Shi F, Christodoulou AG, Xie YB, Zhou ZW, Li DB. Efficient and Accurate MRI Super-Resolution Using a Generative Adversarial Network and 3D Multi-level Densely Connected Network. Lect Notes Comput Sc 2018;11070:91-99.
8.Jenkinson M, Beckmann CF, Behrens TE, Woolrich MW, Smith SM. Fsl. Neuroimage 2012;62(2):782-790.
9.Ledig C, Theis L, Huszar F, et al. Photo-Realistic Single Image Super-Resolution Using a Generative Adversarial Network. Proc Cvpr Ieee 2017:105-114.
Figures
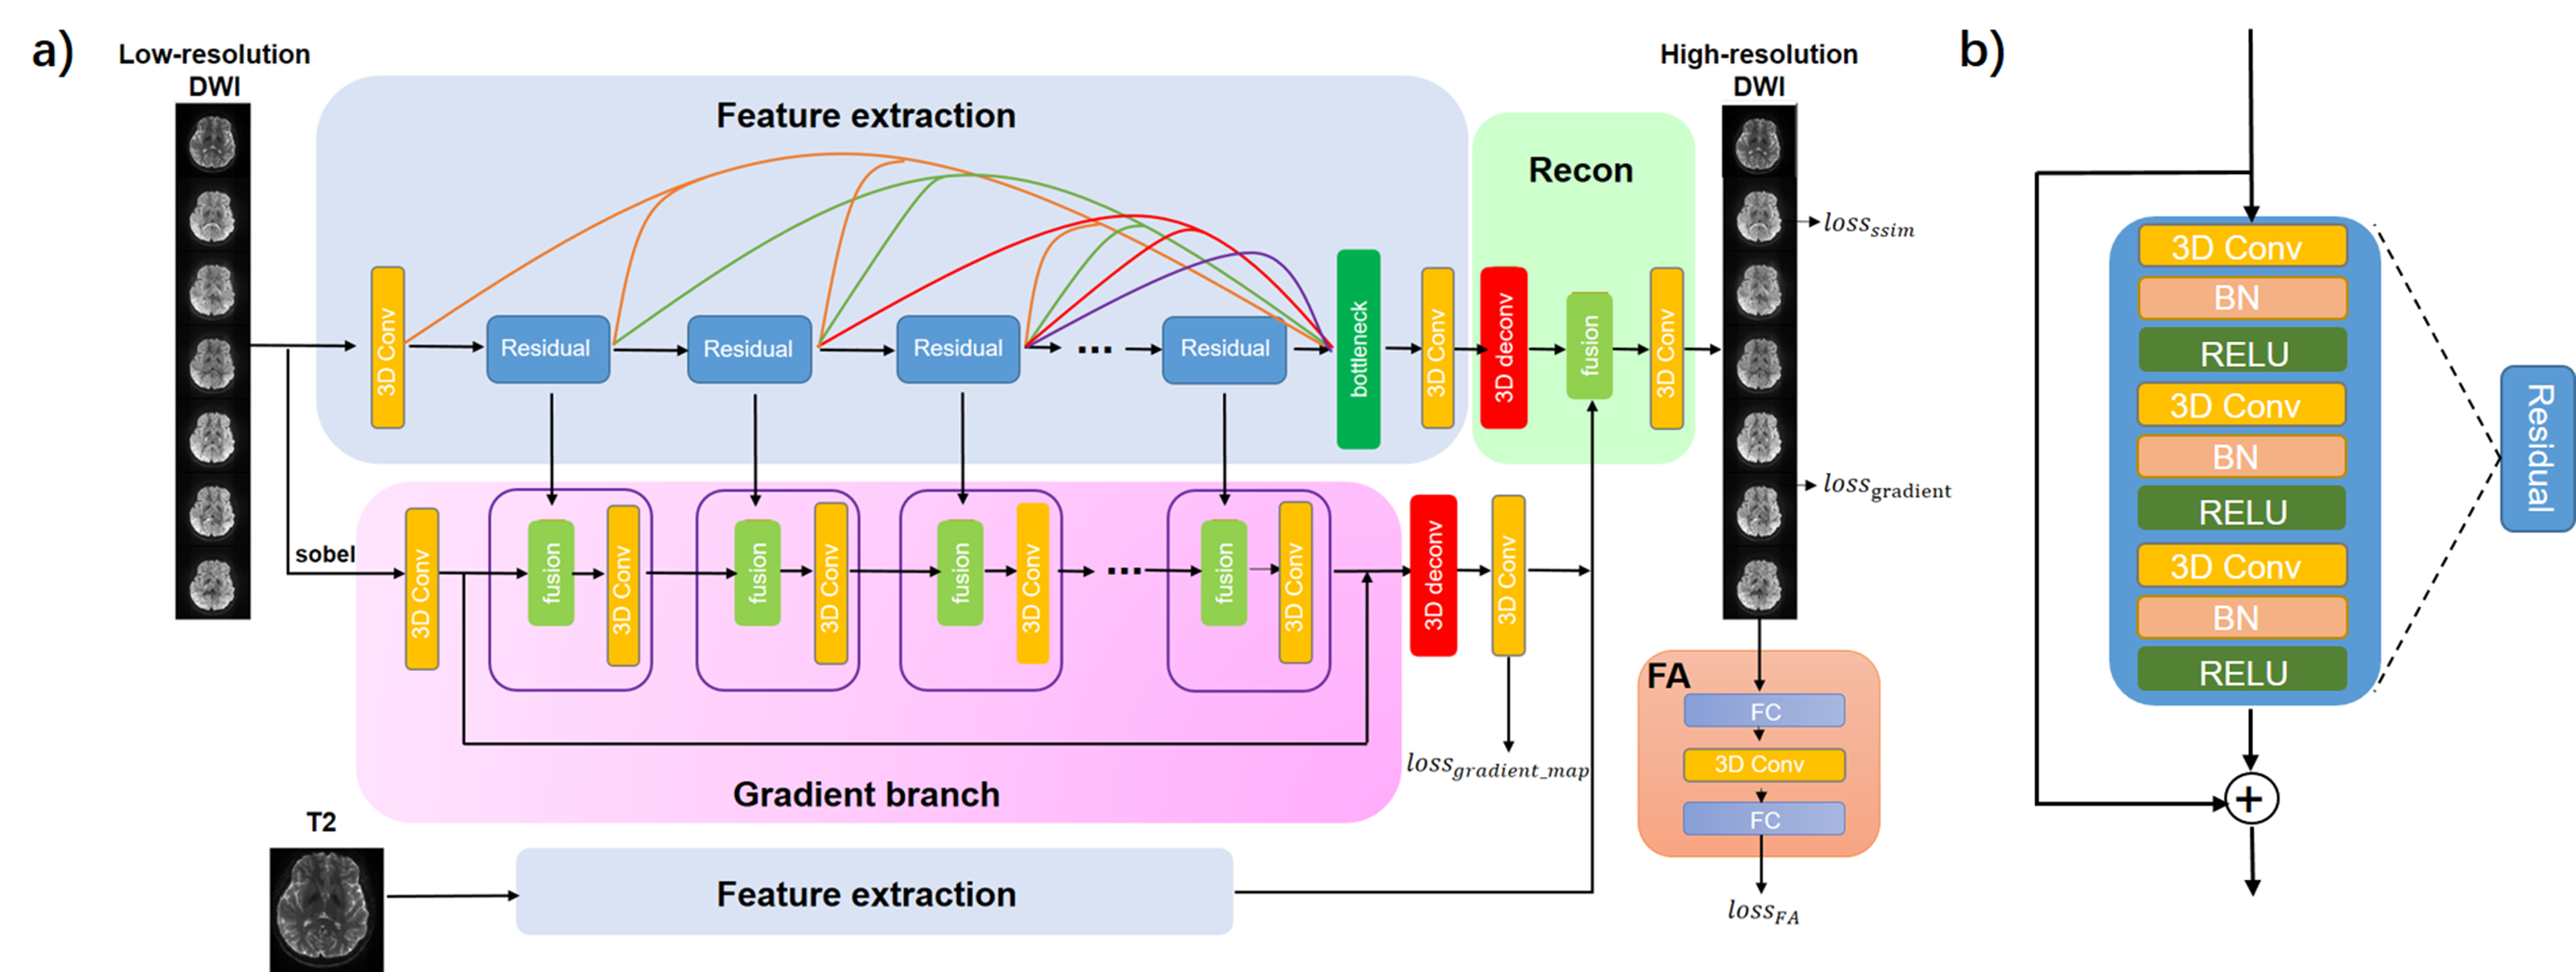
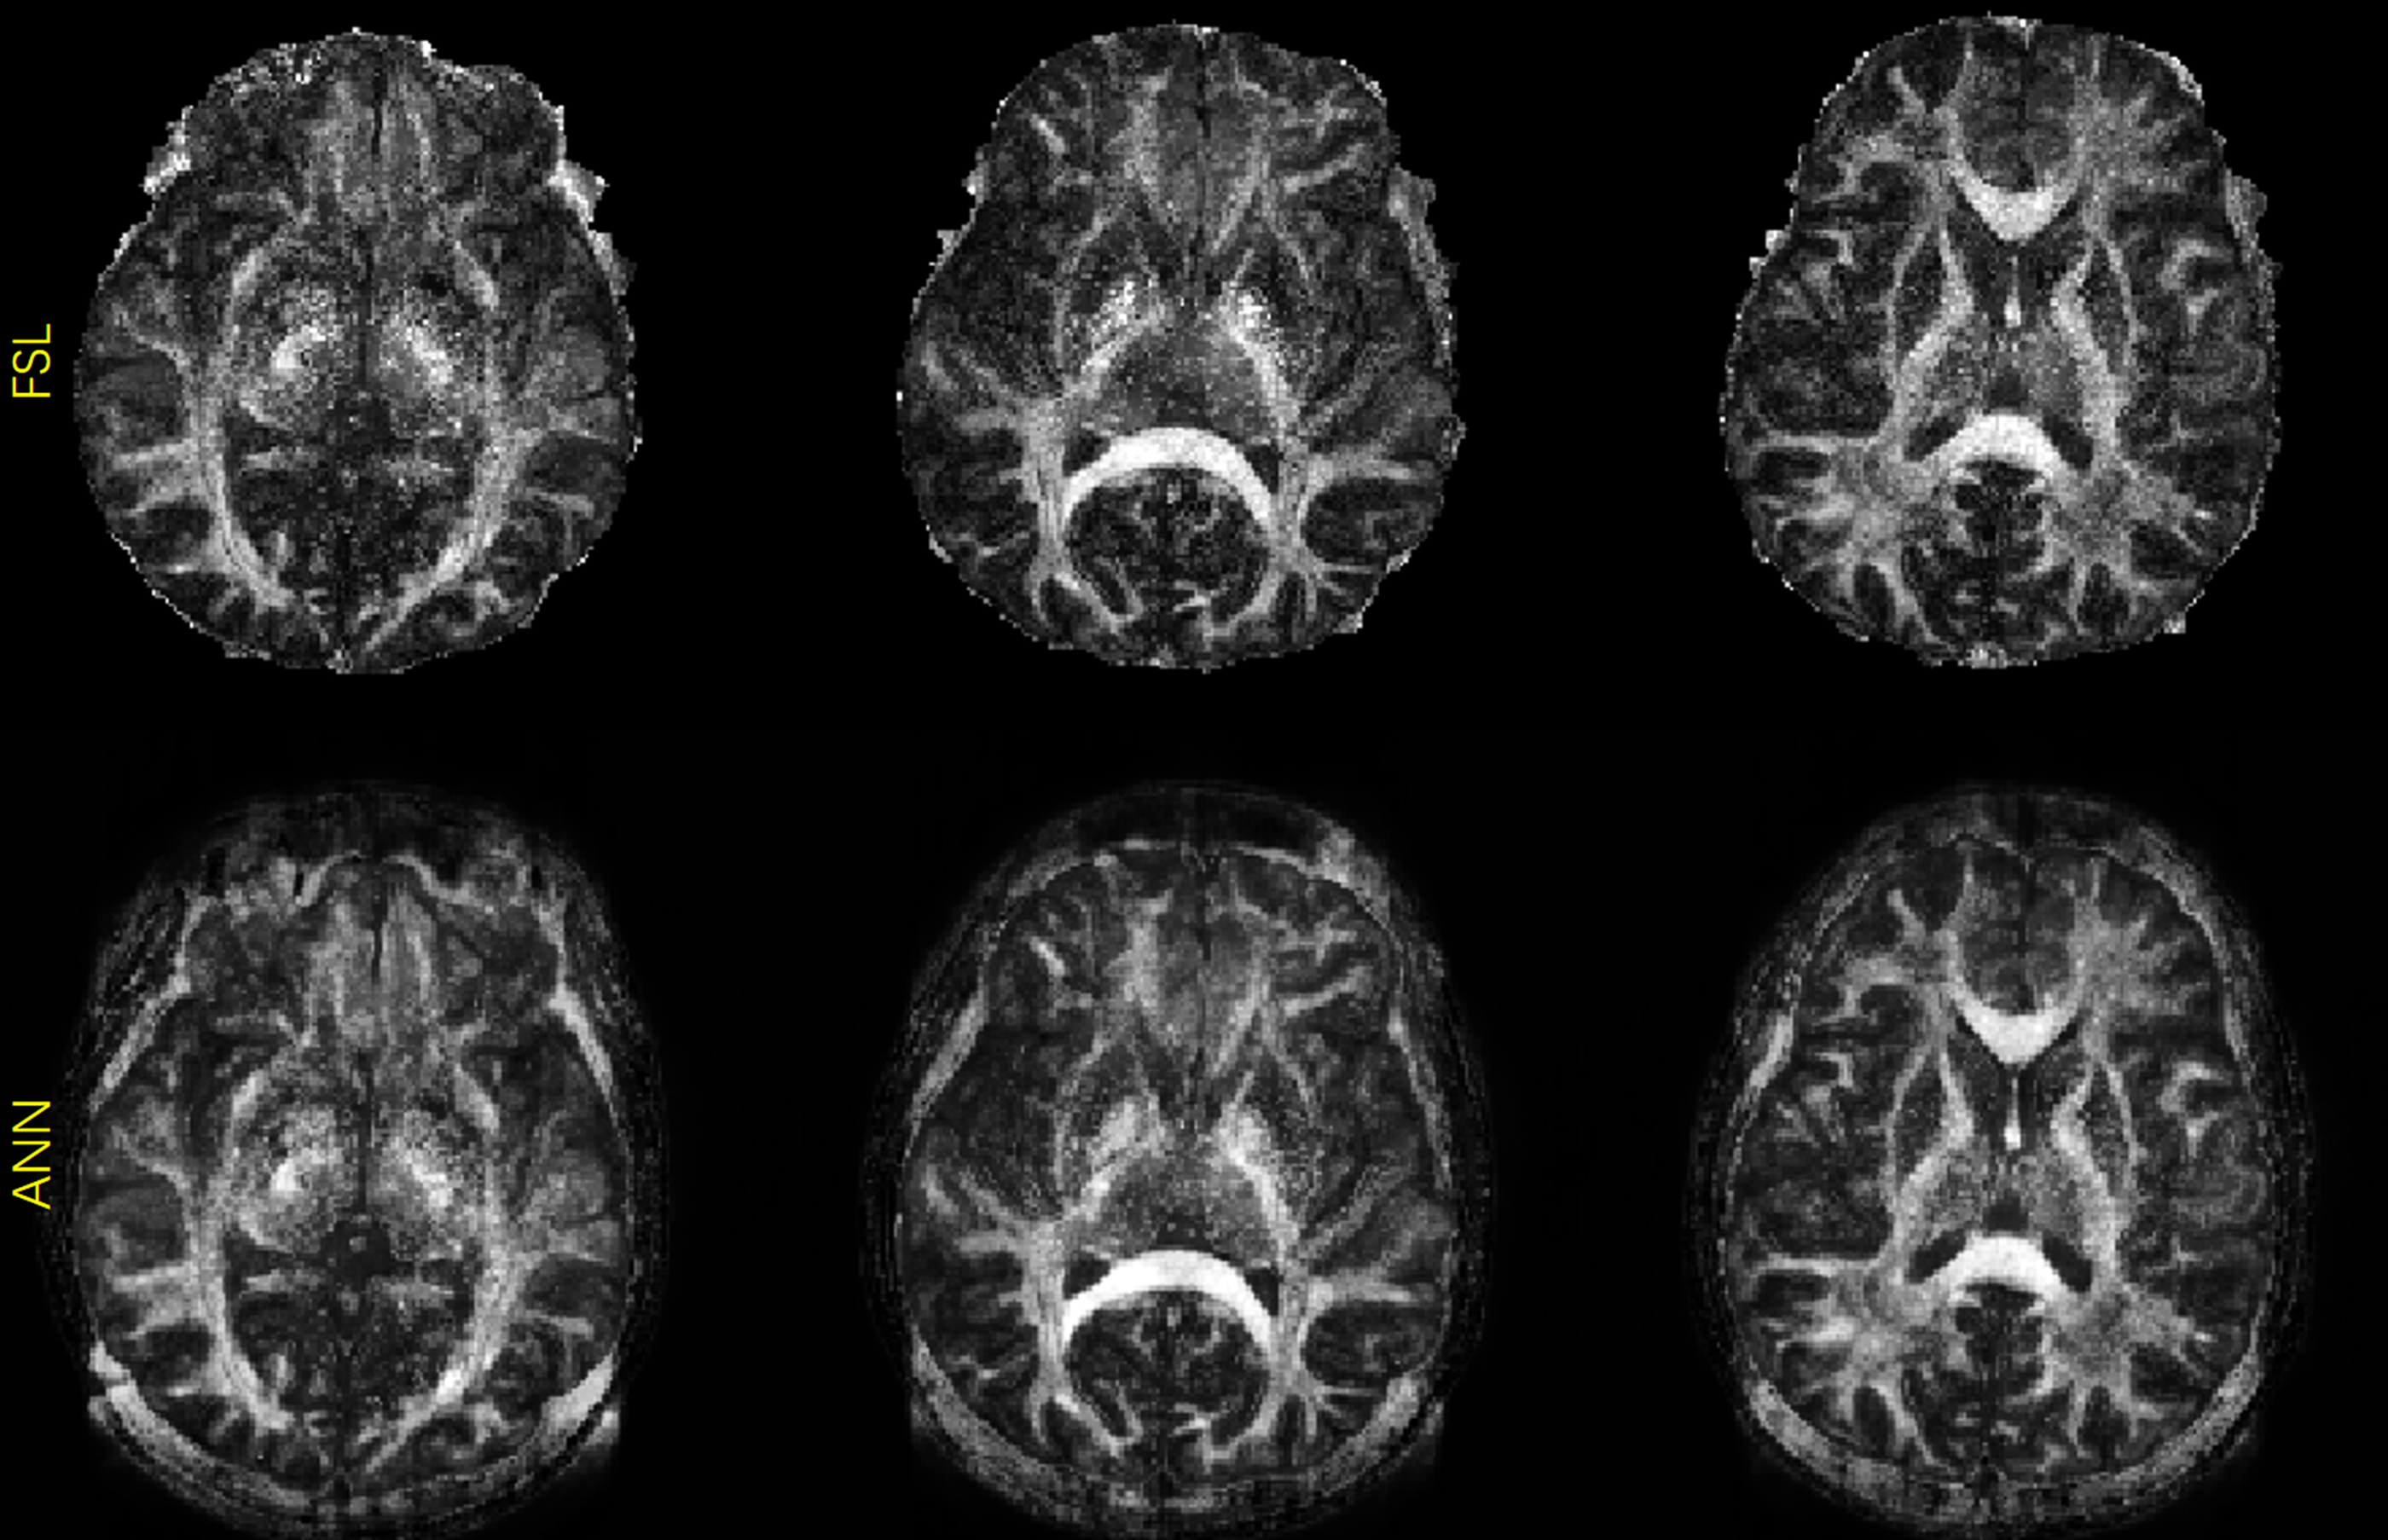
Fig. 2. FA maps calculated from high-resolution images using the proposed FA calculation model and reference FSL.
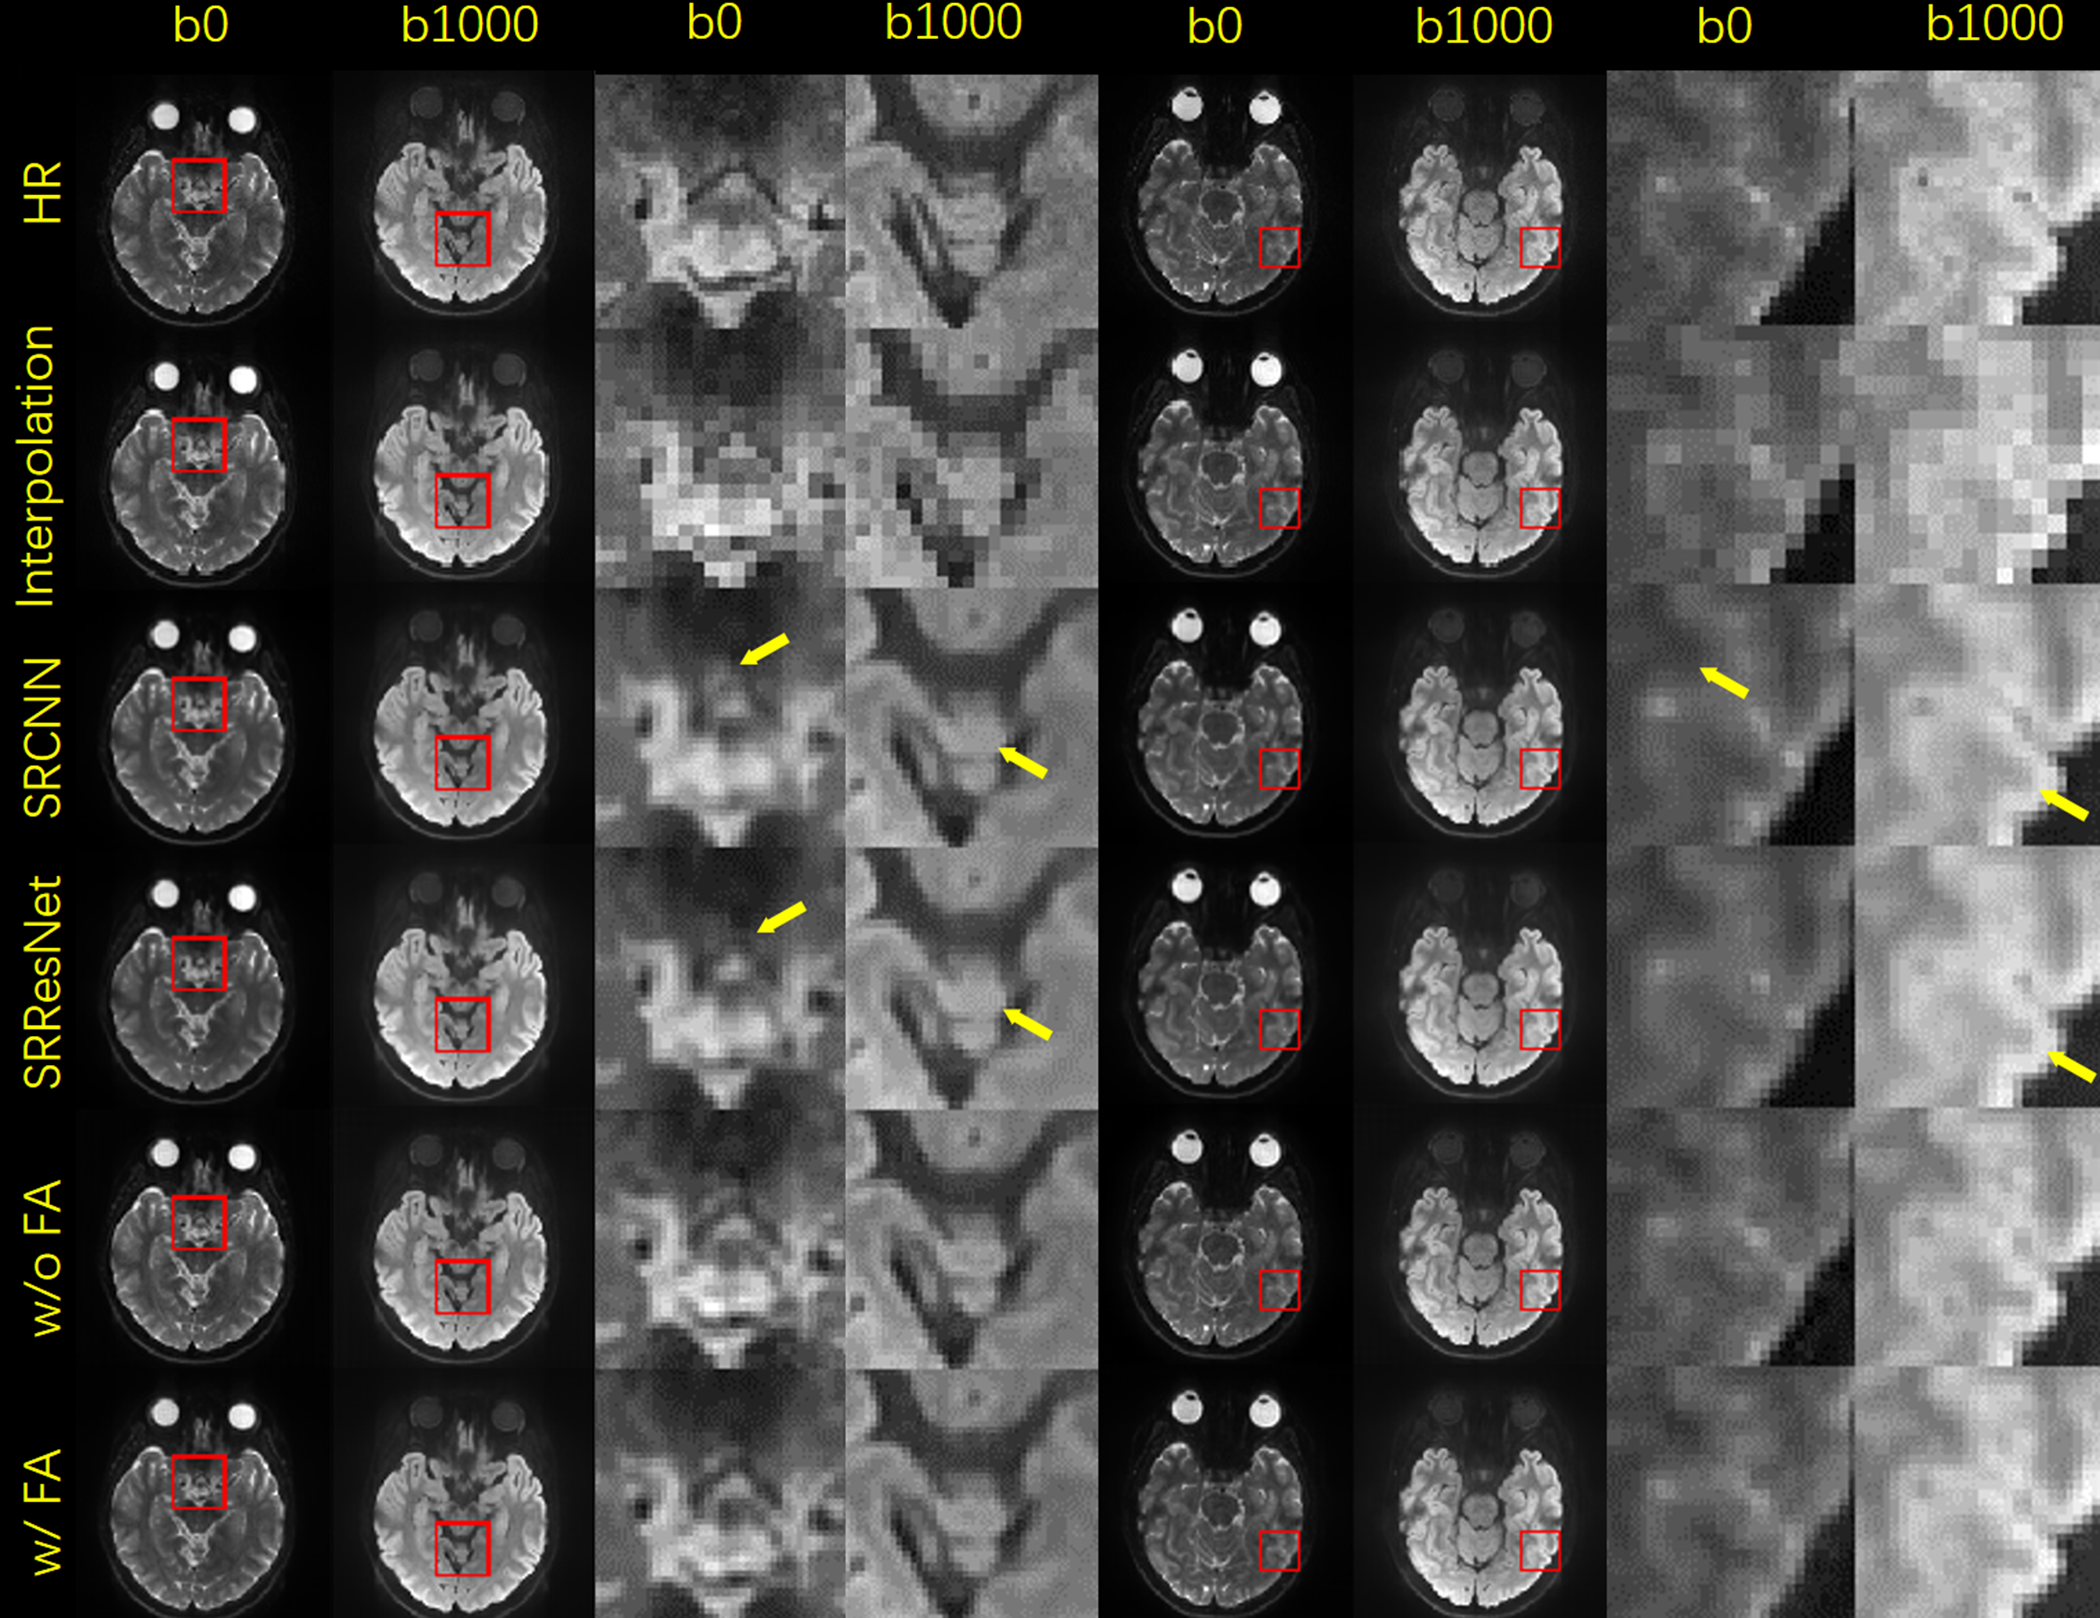
Fig. 3. Selected comparison results and zoomed-in images of in-vivo DWI data. b0 and mean DWI results from 2 representative slices are shown. In the zoomed-in images, the arrows point to the structures that SRCNN and SRResNet fail to recover.
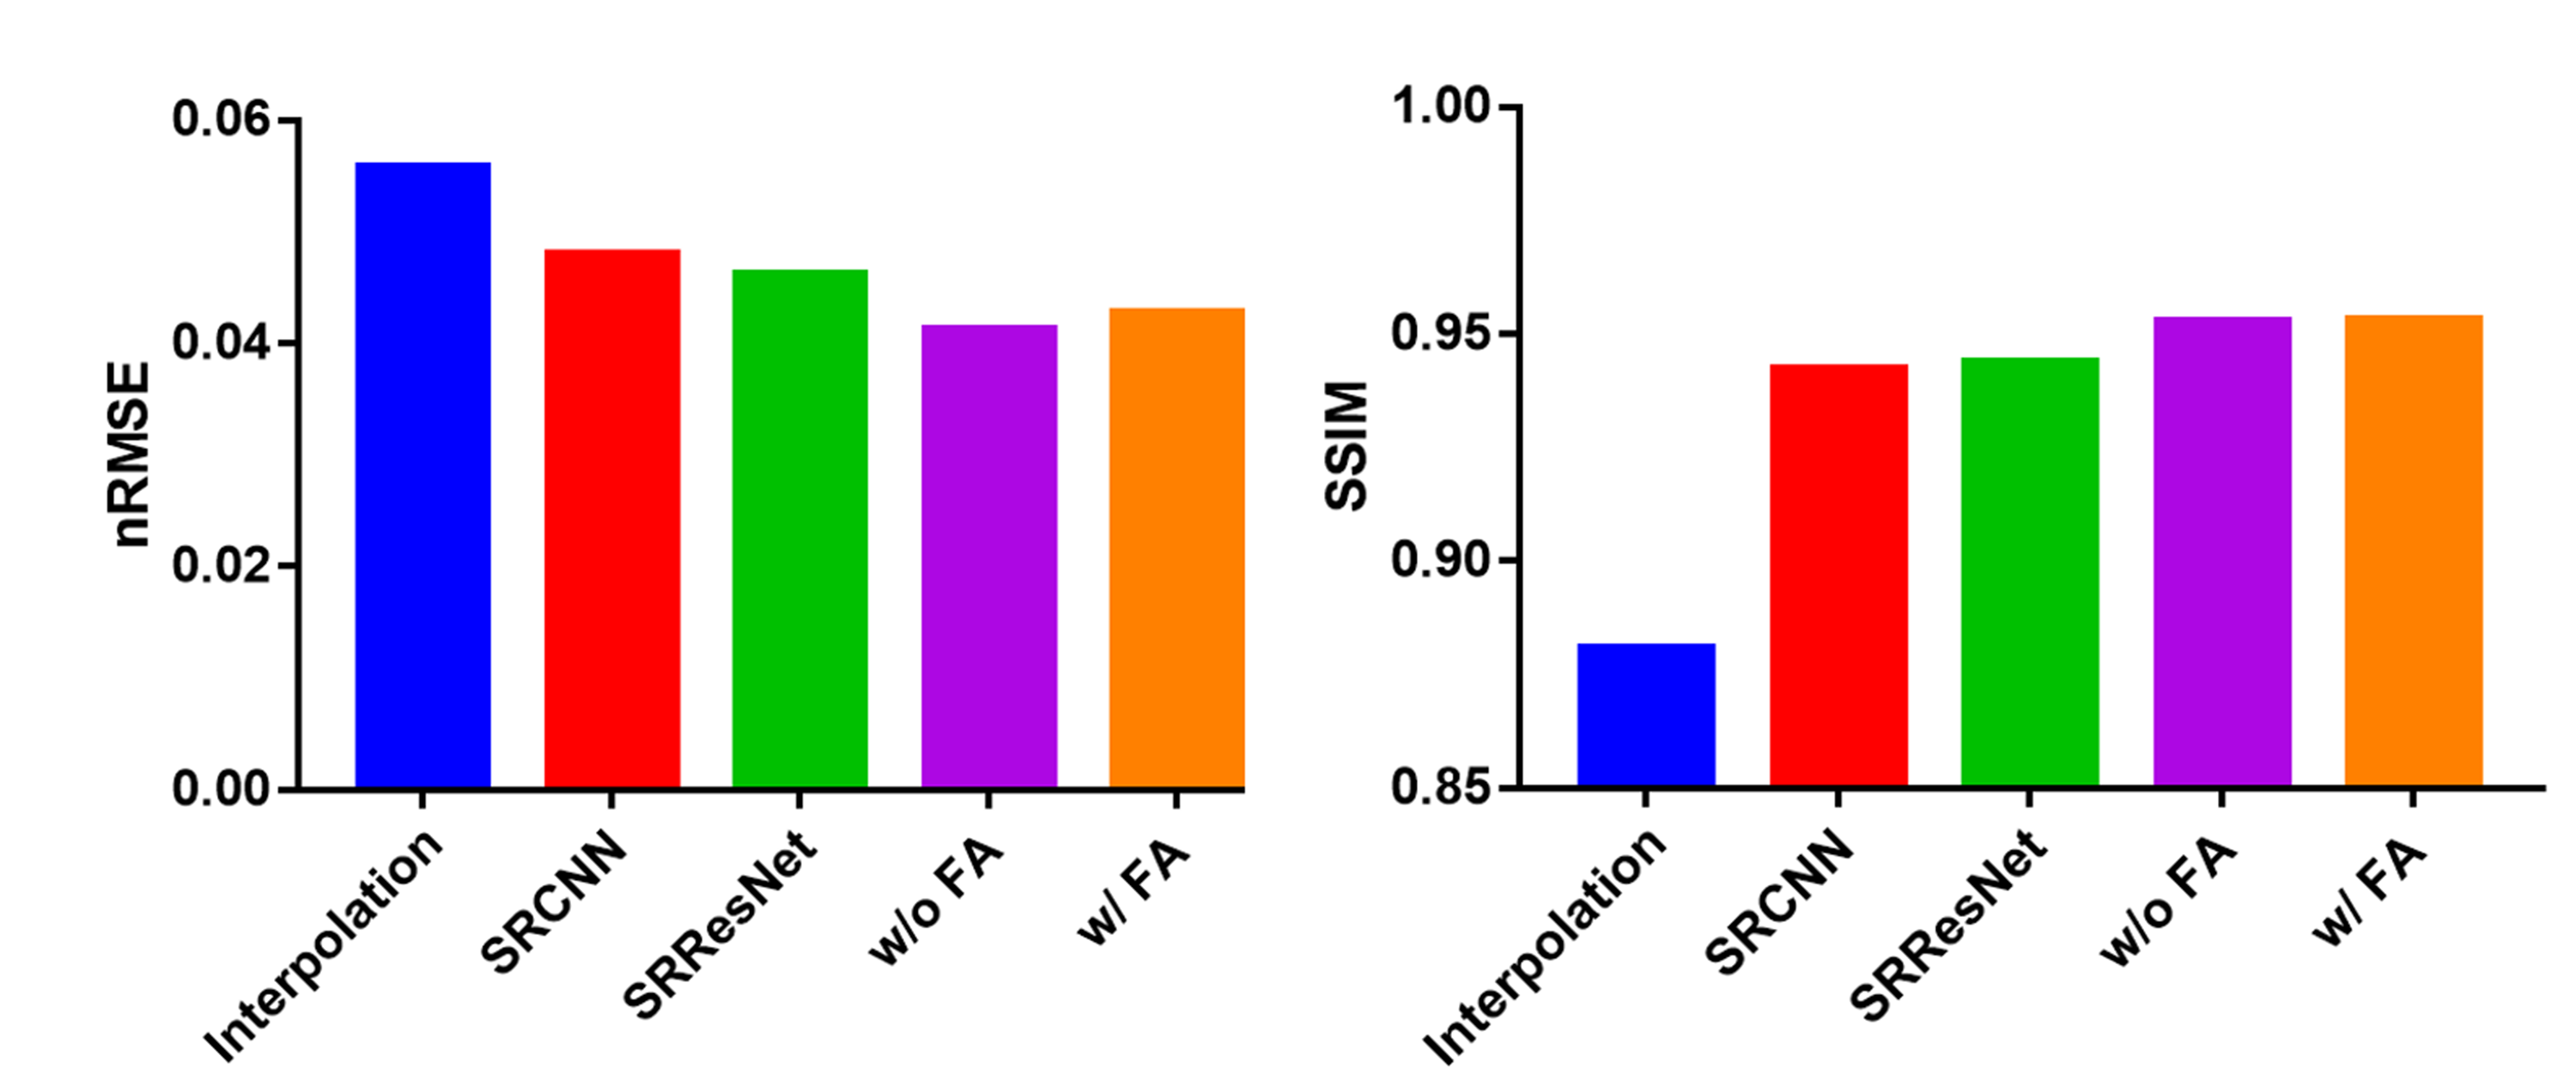
Fig. 4. Quantitative evaluations of different methods. As regard to RMSE and SSIM, the proposed methods with and without FA loss both show better performance.