1330
Evaluation of Saturation Effects in Simultaneous Multi-Contrast (SMC) Imaging1Imaging Physics, Fraunhofer MEVIS, Bremen, Germany, 2Faculty 01 (Physics/Electrical Engineering), University Bremen, Bremen, Germany, 3Imaging Centre of Excellence (ICE), University of Glasgow, Glasgow, Scotland
Synopsis
Simultaneous multi-contrast imaging (SMC) can be used to combine acquisition of diffusion-weighted (DW) and T2*-weighted (T2*W) images into a single scan. Compared to conventional single-contrast imaging, SMC reduces the total scan time and improves image registration. However, saturation effects can reduce SNR and alter contrast. In this study, these effects are investigated in simulations, in phantoms, and in vivo. By using the results of this study to control saturation effects in SMC, the method enables rapid acquisition of distortion-matched, high-quality, well-registered DW and T2*W imaging, which could support rapid diagnosis and treatment of acute stroke.
Introduction
Simultaneous multi-contrast (SMC) imaging1 can be used to combine the acquisition of diffusion-weighted (DW) and T2*-weighted (T2*W) images into a single scan. This contrast combination is of particular interest for the diagnosis of acute stroke, where T2*W images can be used to detect bleeding2-4 and DW scans are sensitive to acute infarcts in brain tissue5. Compared to conventional single-contrast imaging, the overall scan time with SMC is reduced, and image registration is improved, but saturation effects can reduce SNR and modify contrast. In this study, these effects are investigated in simulations, in phantoms, and in vivo.Methods
The modified readout-segmented EPI sequence for SMC acquires DW and T2*W contrast from two slice positions at the same time. The signals are separated using an in-house reconstruction at the scanner based on the split slice-GRAPPA algorithm6,7.Computer Simulations:
The mutual saturation effects of the two slices were simulated for a range of excitation flip angles for the T2*W slice. To allow comparison with experimental data, T1 and B1 values determined from phantom scans and images in vivo were used for the simulations.
Data Acquisition:
Data were acquired at 3T (MAGNETOM Skyra, Siemens Healthineers AG) using a standard 20-channel head coil.
For saturation comparison with computer simulations, measurements were performed on a spherical water-based phantom and a healthy subject at two slice positions in each case. One slice was positioned outside the phantom or subject to prevent the effects of potential cross-talk between slices. Acquisitions were performed with both SMC and the corresponding single-contrast sequences. T1 maps were generated using a gradient-echo, slice-selective, inversion-recovery sequence. B1 field maps were determined with a 2D EPI sequence using the double-angle method (DAM) (α = 60°, 2α = 120°).
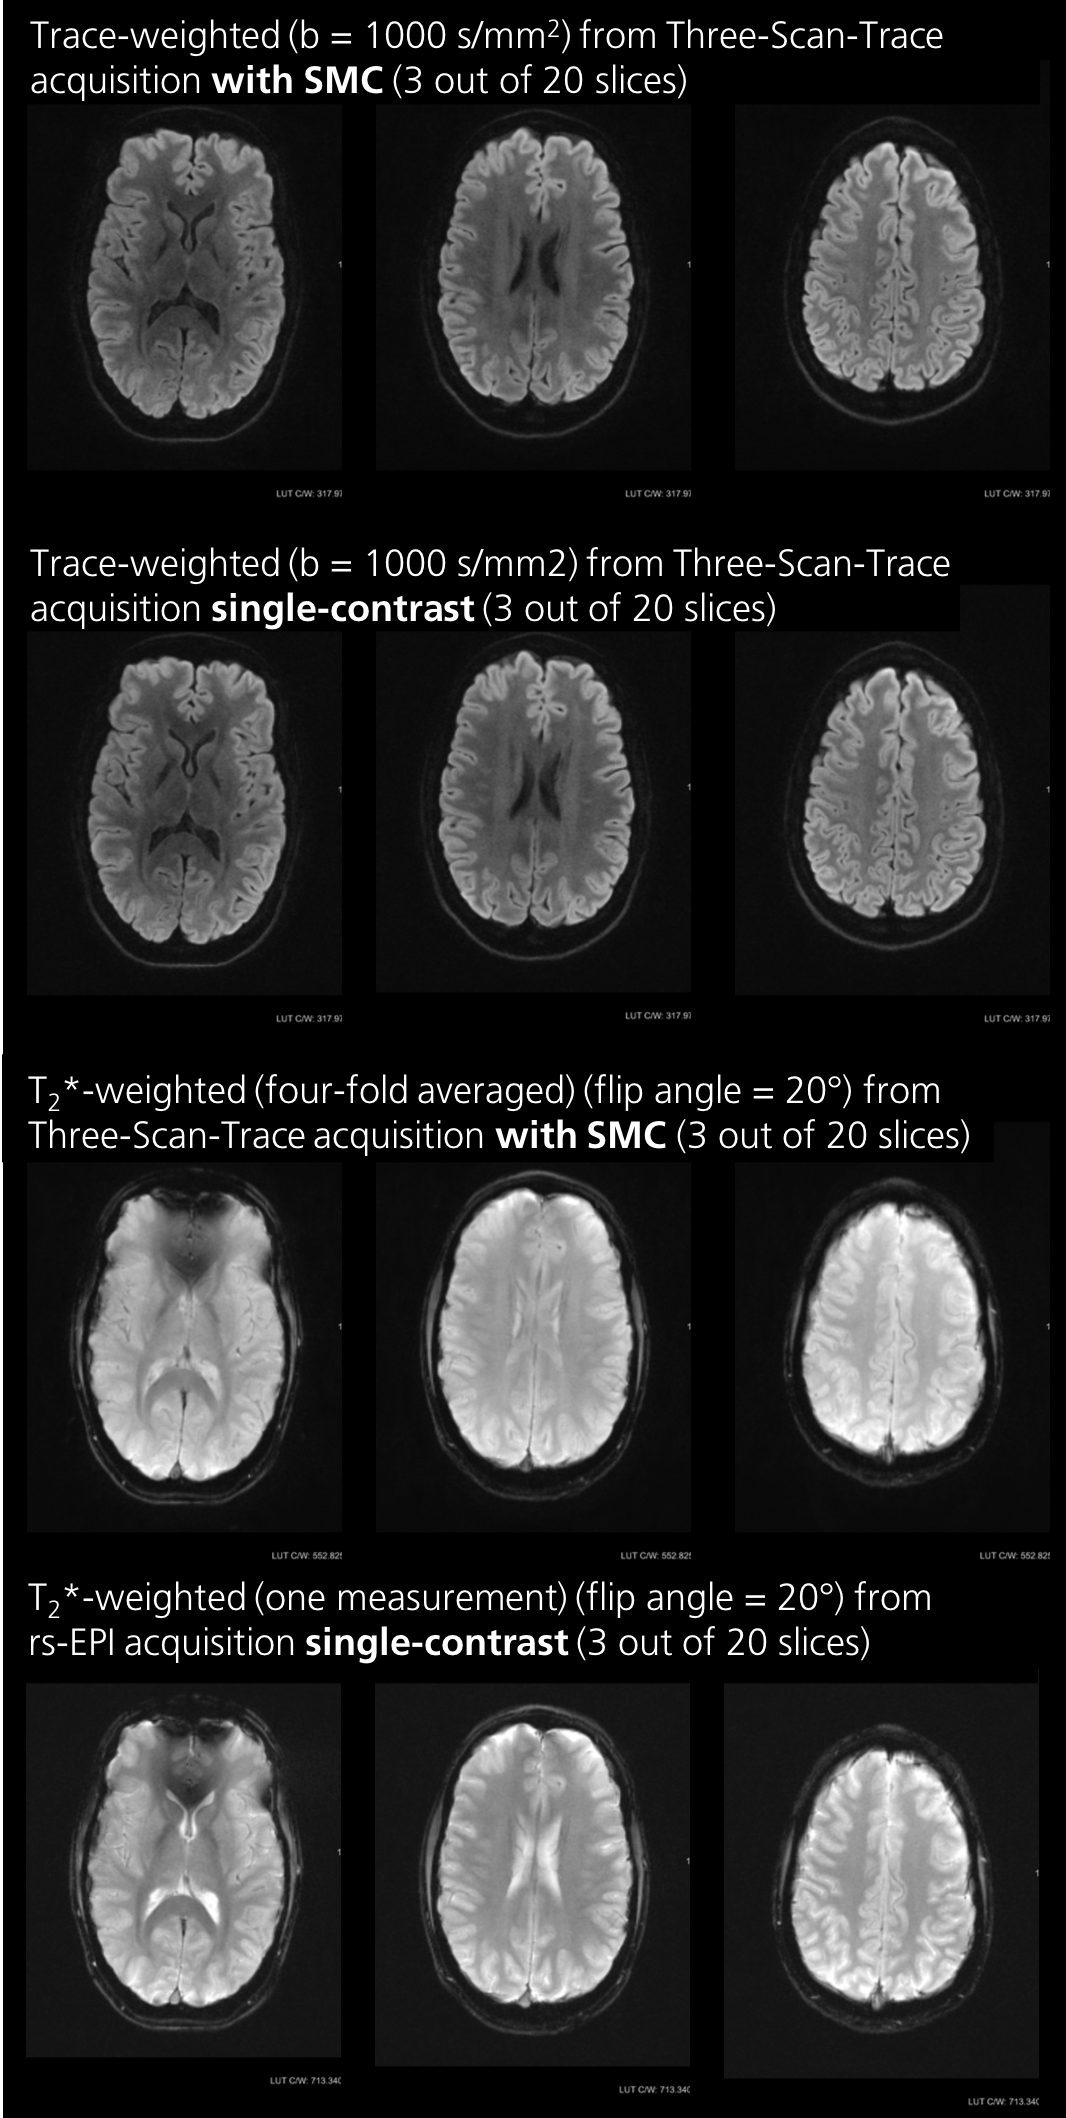
For the second subject, a potential clinical protocol was used to acquire trace-weighted and T2*W images simultaneously with the following parameters: TR/TEDW/TET2*W= 4500/81.5/24.8 ms, voxel size 1.0x1.0x3.0mm3, in-plane acceleration factor of 2, and acquisition time 3:09 min. For the DW scans, there were two b-values (0 and 1000 s/mm2). For the T2*W contrast the flip angle was 20°.
Data Analysis:
The saturation differences between scans with SMC and those using the equivalent single-contrast sequences were compared. Data from the first healthy subject were used to evaluate SMC saturation effects on grey and white matter separately. Non-synchronous in vivo scans were registered with an in-house registration library in MeVisLab8 with a 2D rigid transformation.
Results
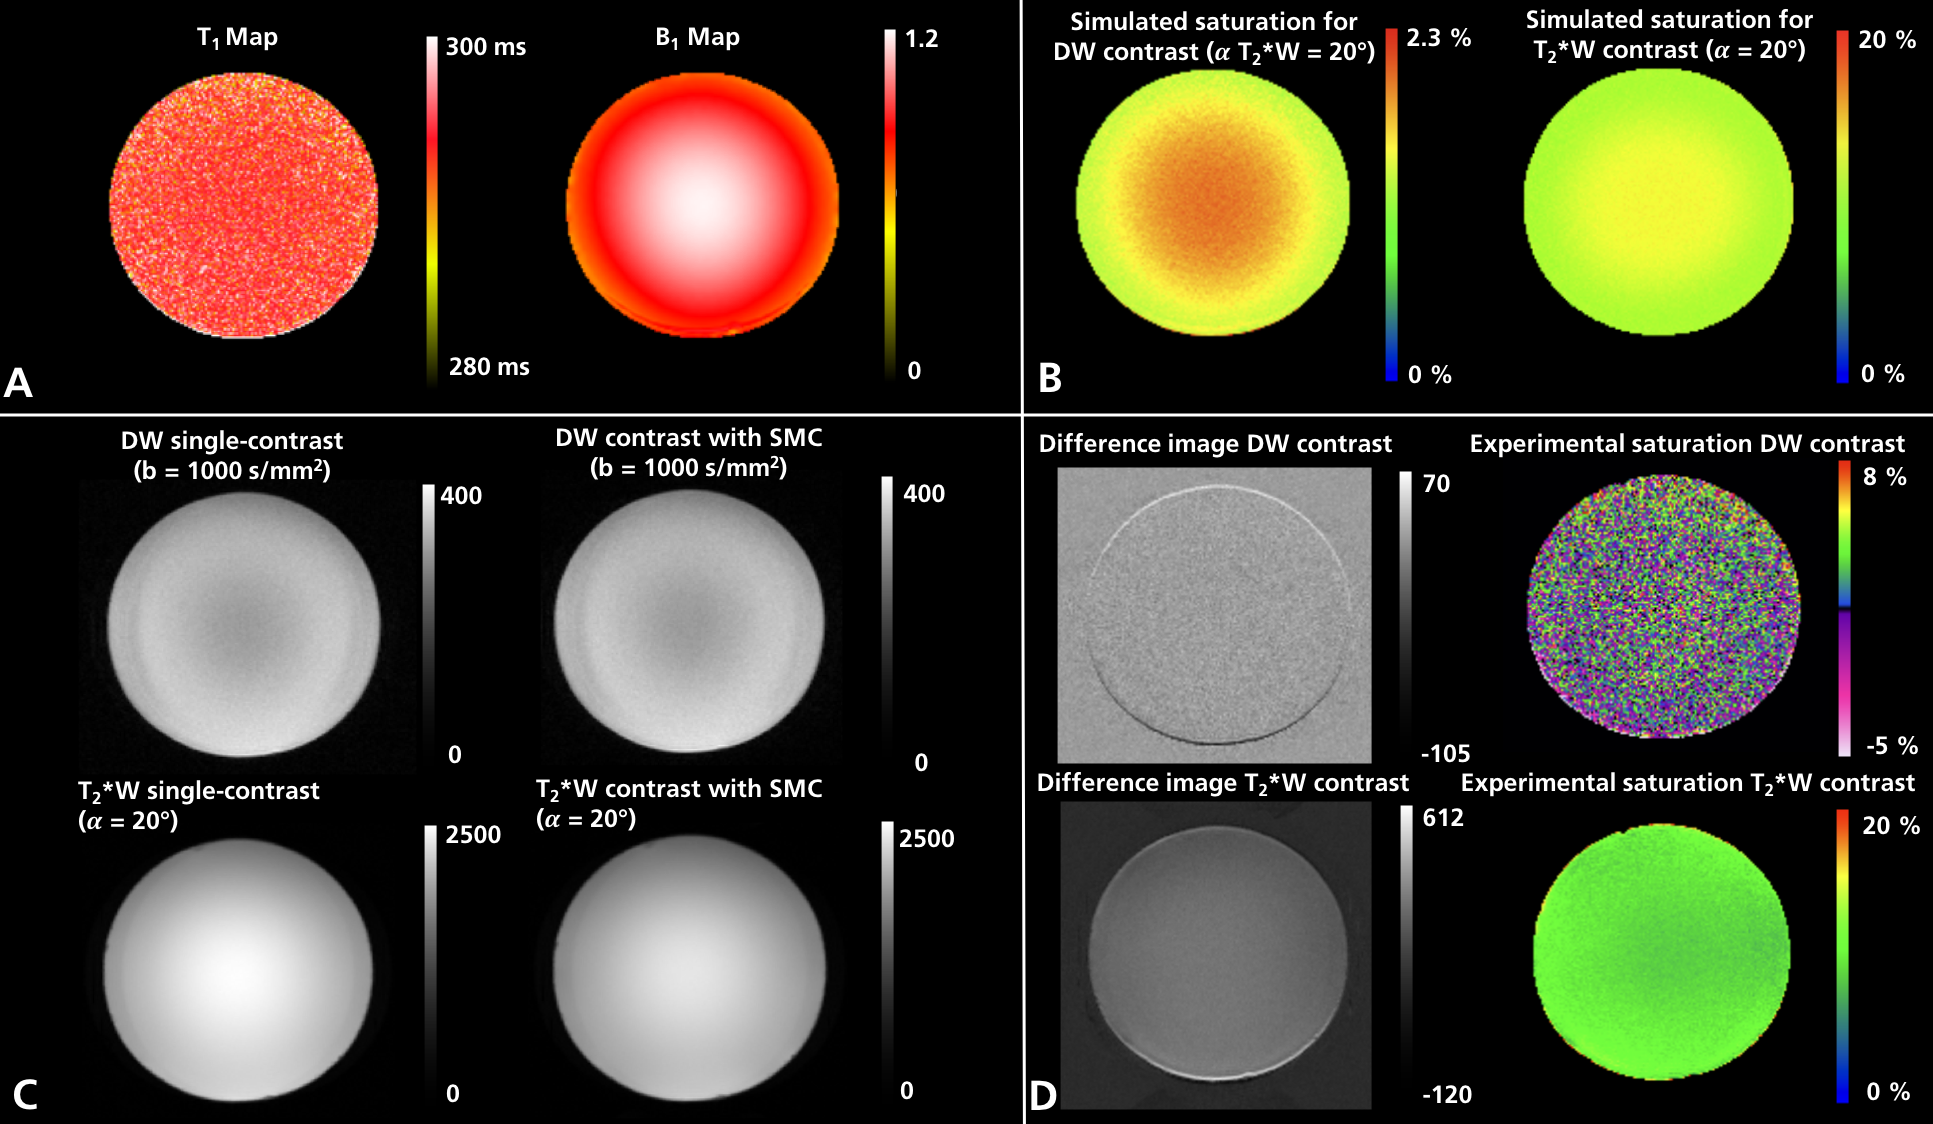
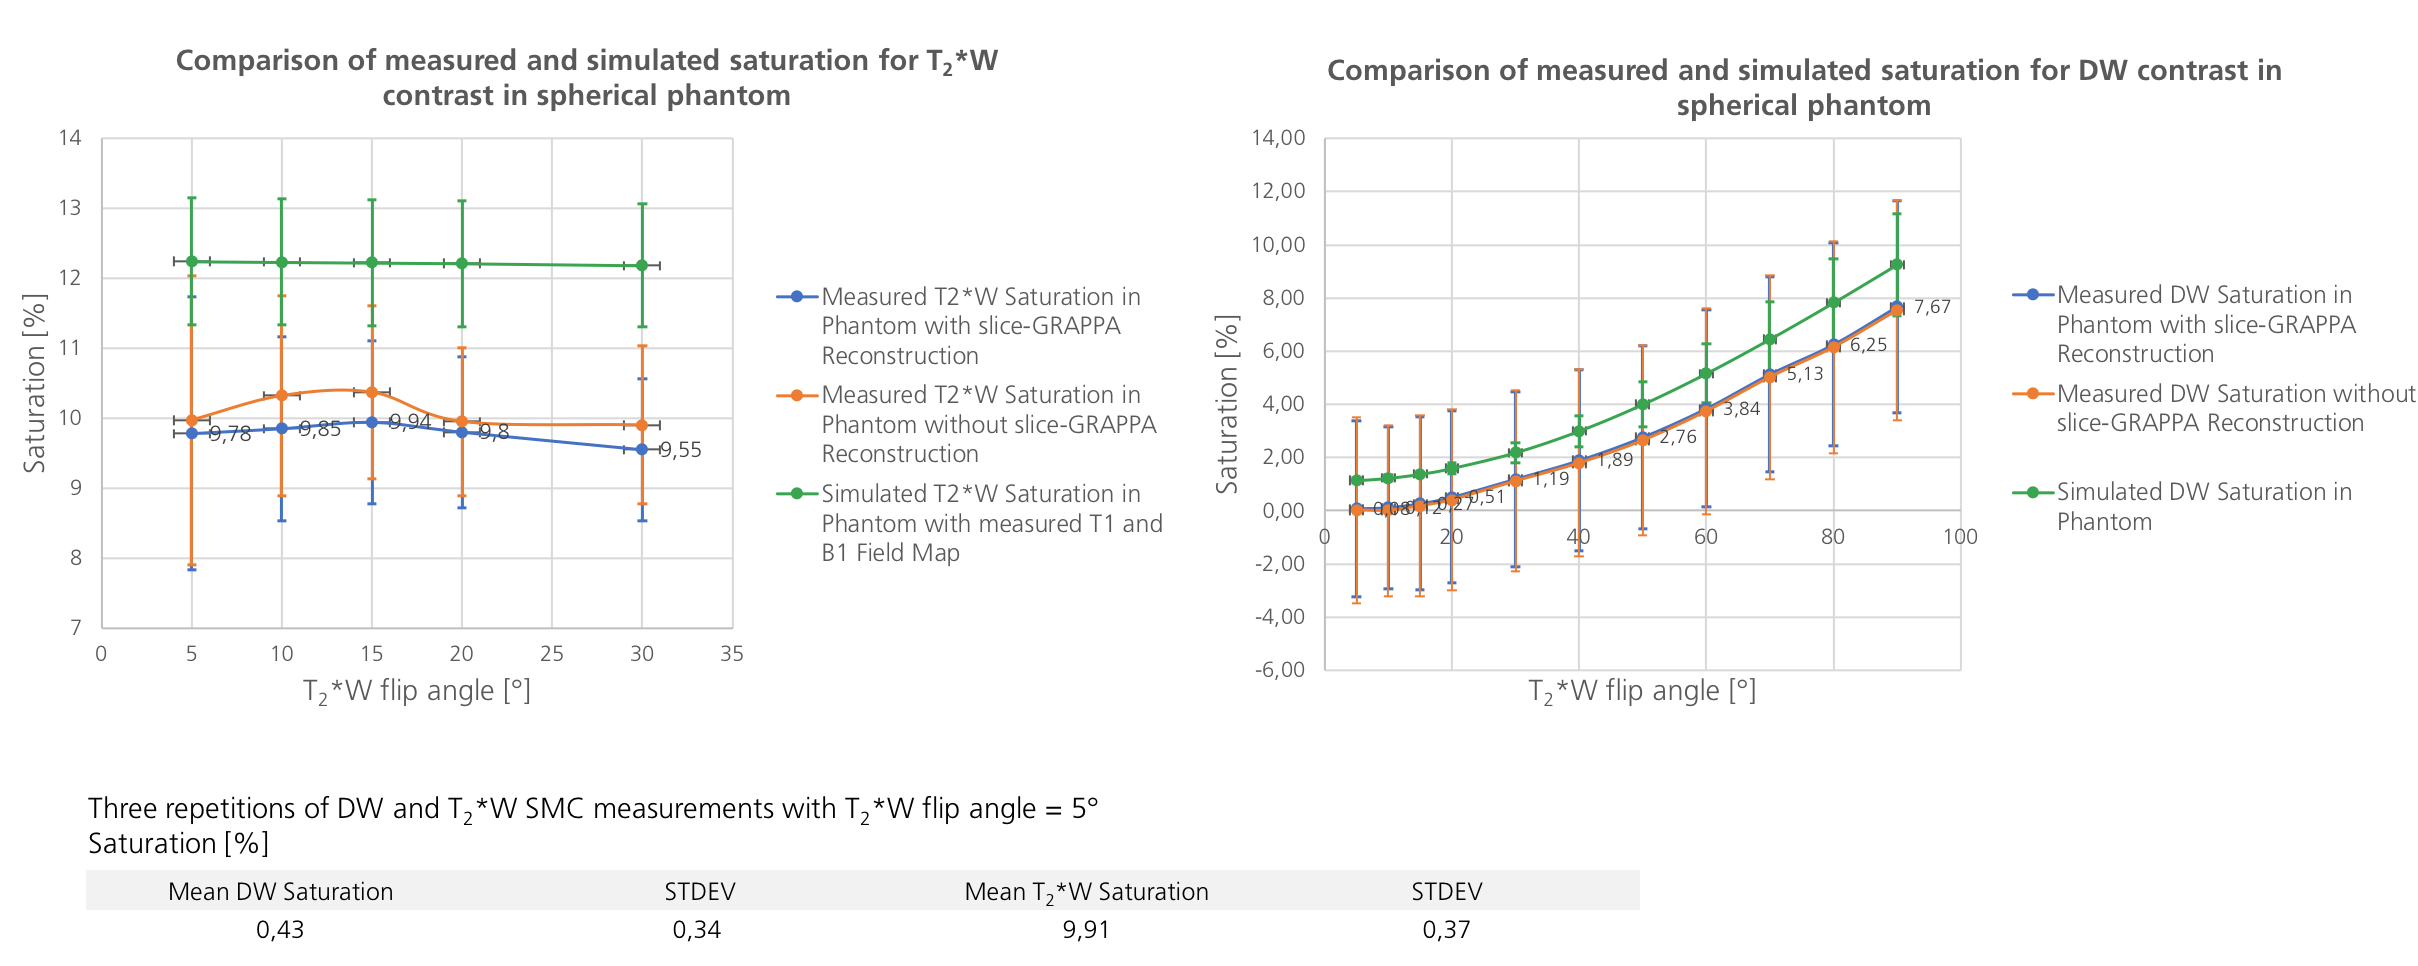
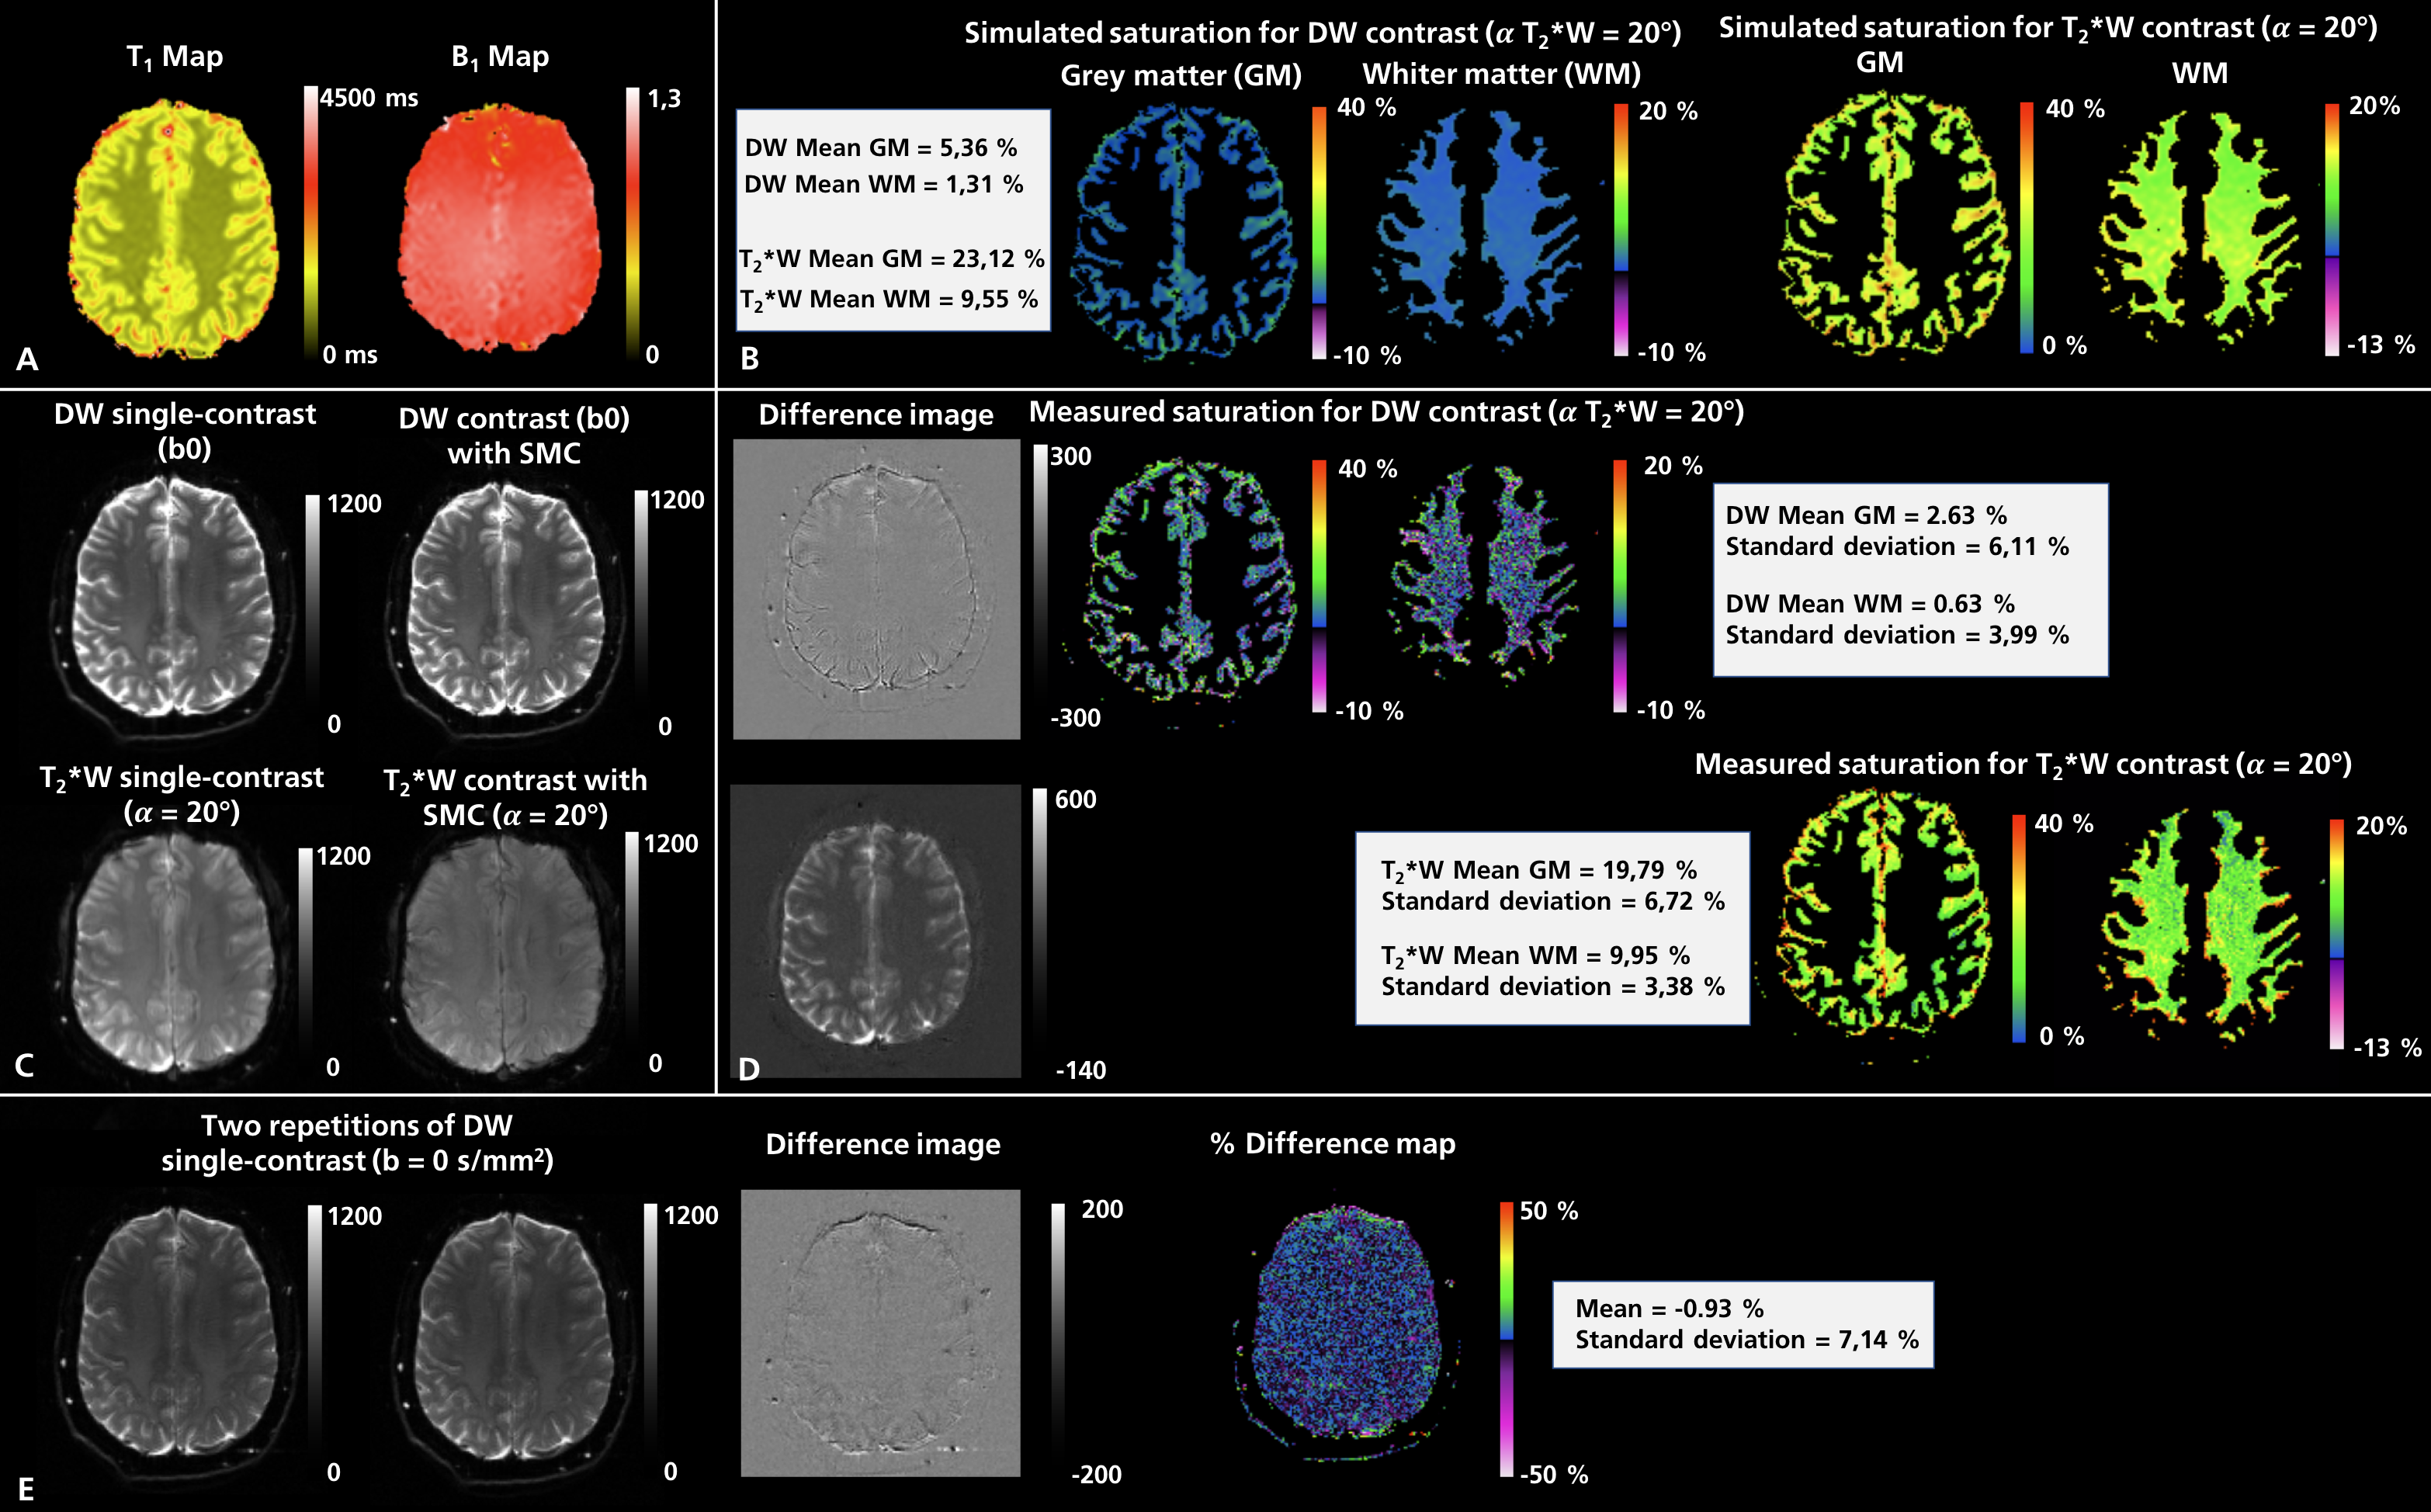
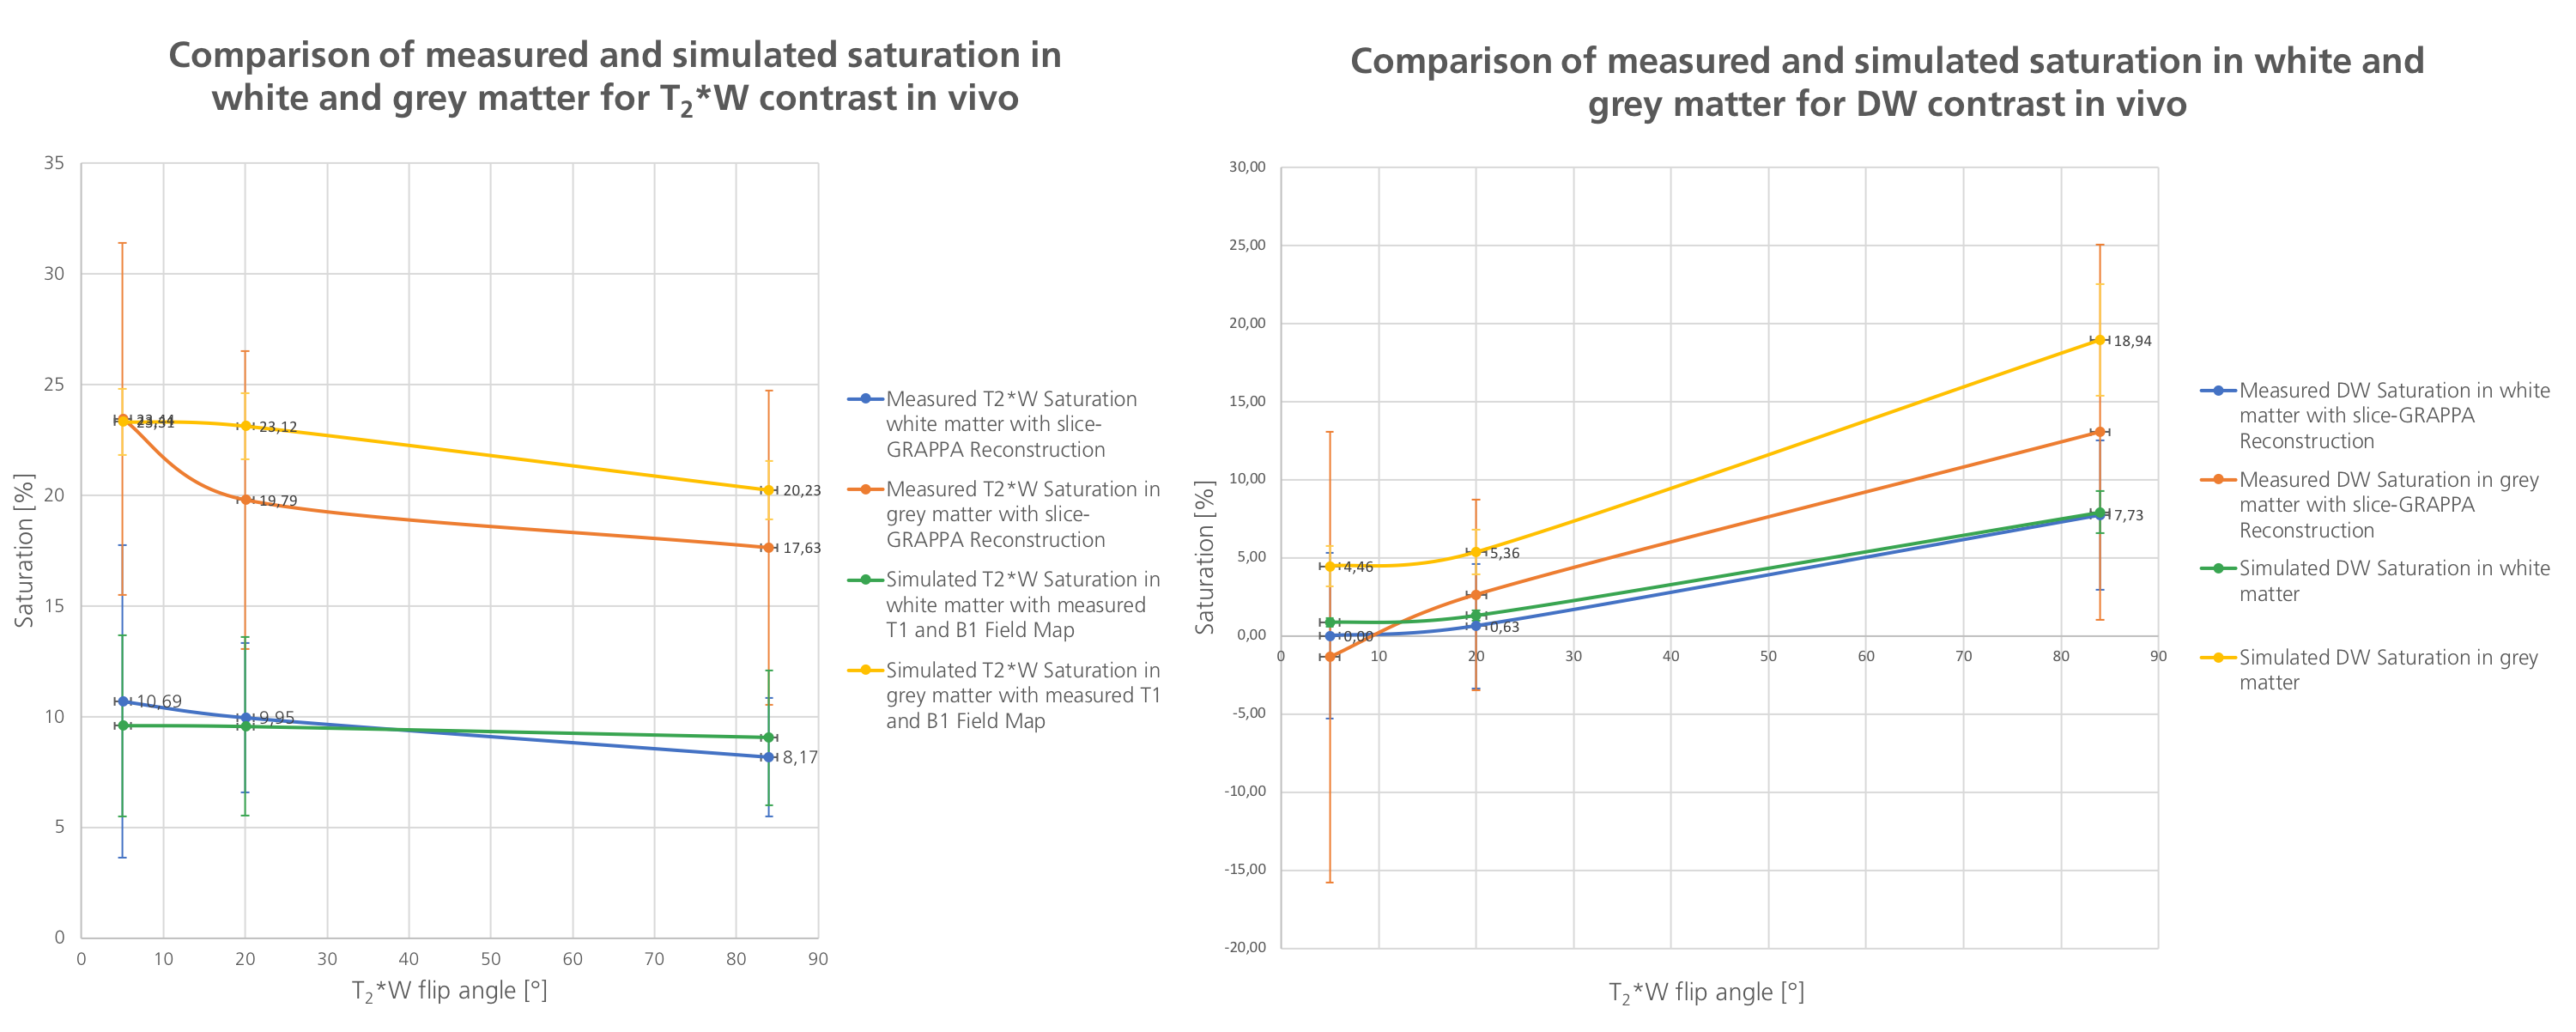
Figure 1 compares the measured and simulated saturation for DW and T2*W contrast in the phantom with corresponding T1 and B1-field maps. A detailed analysis of the measured and simulated saturation for both contrast types in the phantom as a function of the T2*W excitation flip angle is shown in figure 2. Experimental data are shown both with and without the use of split-slice GRAPPA during image reconstruction. The image data in figure 3 demonstrates the saturation effects seen with SMC in grey and white matter compared to the single-contrast acquisitions. The figure also compares these results with simulated values using measured T1 and B1-field maps. Figure 4 shows the quantitative analysis for saturation effects in vivo. Finally, figure 5 shows the results from a high-resolution, trace-weighted acquisition with and without SMC.Discussion & Conclusion
SMC imaging can provide inherently registered ADC maps and T2*W images in around three minutes. There are however additional saturation effects, which have been investigated in this study.The signal changes introduced by the SMC method depend on a number of factors, including the time between DW and T2*W excitation of the same slice, the repetition time (TR), and the flip angle of the T2*W excitation. It has been demonstrated that the slice-GRAPPA reconstruction allows good separation of the SMC data (fig. 5) and does not have a major influence on signal level compared to a standard reconstruction (fig. 2). Simulated data predict higher saturation effects than the measured case. One potential reason for this is that slice-profile effects were not considered during the simulation. Despite image registration, the results from the measured data may also have been affected by an uncorrected frequency drift during data acquisition, and motion during the scans in vivo. Frequency drift can be corrected in future work.
As shown in figure 4 and figure 5, an appropriate choice of T2*W excitation pulse minimizes SNR loss and contrast changes in the DW images. SNR loss in the T2*W case is higher, but this is more than offset by four-fold averaging of T2*W data during the acquisition of data for multiple diffusion-gradient directions and b-values. The main effect on the T2*W images is the change in contrast due to suppression of CSF signals. However, this is unlikely to affect the diagnostic capability of the sequence to detect hemorrhage.
By using the results from this study to control saturation effects in SMC, the method allows the rapid acquisition of distortion-matched, high-quality, well-registered DW and T2*W images, which could support the prompt diagnosis and treatment of acute stroke. In future work, SMC could be combined with SMS for reduced scan time or increased slice coverage. The multiple T2*W images during the acquisition might also be useful for motion-correction purposes.
Acknowledgements
No acknowledgement found.References
1. Breutigam NJ, Frost R, Eickel K, Porter D. Simultaneous Multi-Contrast Imaging with Readout-Segmented EPI. Proceedings of the 25th Annual Meeting of ISMRM. 0520. 2017.
2. M. Köhrmann, P.D. Schellinger. Acute stroke triage to intravenous thrombolysis and other therapies with advanced CT or MR imaging: pro MR imaging. Radiology, 2009; 251, pp. 627-633, 10.1148/radiol.2513081074
3. C.S. Kidwell, J.A. Chalela, J.L. Saver, S. Starkman, M.D. Hill, A.M. Demchuk, et al. Comparison of MRI and CT for detection of acute intracerebral hemorrhage. JAMA 2004;292, pp. 1823-1830, 10.1001/jama.292.15.1823
4. J.B. Fiebach. Stroke magnetic resonance imaging is accurate in hyperacute intracerebral hemorrhage: a multicenter study on the validity of stroke imaging. Stroke 2004; 35, pp. 502-506, 10.1161/01.STR.0000114203.75678.88
5. P.D. Schellinger, R.N. Bryan, L.R. Caplan, J.A. Detre, R.R. Edelman, C. Jaigobin, et al. Evidence-based guideline: the role of diffusion and perfusion MRI for the diagnosis of acute ischemic stroke: report of the Therapeutics and Technology Assessment Subcommittee of the American Academy of Neurology. Neurology 2010; 75, pp. 177-185, 10.1212/WNL.0b013e3181e7c9dd
6. Setsompop K, Gagoski BA, Polimeni JR, Witzel T, Wedeen VJ, Wald LL. Blipped-controlled aliasing in parallel imaging for simultaneous multislice echo planar imaging with reduced g-factor penalty. Magn Reson Med 2012;67:1210-1224.
7. Cauley SF, Polimeni JR, Bhat H, Wald LL, Setsompop K. Interslice leakage artifact reduction technique for simultaneous multislice acquisitions. 2014;72(1):93-102.
8. Ritter F, Boskamp T, Homeyer A, Laue H, Schwier M, Link F, Peitgen H-O. Medical image analysis. IEEE Pulse 2011;2:60–70.
Figures