1315
Inversion-recovery prepared 3D oscillating gradient sequence (IR-OGprep-GRASE) improves time-dependency measurements in the human brain1Key Laboratory for Biomedical Engineering of Ministry of Education, Department of Biomedical Engineering, College of Biomedical Engineering & Instrument Science, Zhejiang University, Hangzhou, China, 2MR Collaboration, Siemens Healthcare China, Shanghai, China
Synopsis
Oscillating gradient diffusion MRI enables diffusion measurement at short diffusion-time (td), but it is challenging on the clinical system. Here we proposed an inversion-recovery prepared 3D oscillating gradient (IR-OGprep-GRASE) sequence to improve td–dependency measurements in the human brain. The result indicated that in brain regions that are possibly contaminated by CSF signals, such as the hippocampus, td-dependent ADC changes were not evident with OGprep-GRASE but can be recovered by adding the IR module. With IR-OGprep-GRASE, we identified different td-dependent patterns between the gray and white matter, as well as between the head, body, and tail of hippocampus.
Introduction
Oscillating gradient (OG)1 has been used to assess diffusion at short diffusion-time (td), and to infer about the tissue microstructures2-5. This technique is limited in the clinical application due to the low gradient strength on the human MRI system, which results in a long echo time (TE) and repetition time (TR) to reach a reasonable oscillating frequency and b-value. We recently proposed a 3D oscillating gradient-prepared gradient spin-echo (OGprep-GRASE) sequence to target these two problems6. Moreover, we found that the td-dependency could be affected by CSF signals due to partial volume and point-spread-function effects, for tissues close to the ventricle and sulci, such as the hippocampus and cortical gray matter (GM).The present study aimed to investigate the effect of CSF contamination by examining the td-dependency measured with or without an inversion recovery (IR) module in the OGprep-GRASE sequence. Moreover, we accelerated the OGprep-GRASE sequence with parallel imaging using the Generalized auto-calibrating Partial Parallel Acquisition (GRAPPA)7 method to further shorten the TE and readout duration. We tested the proposed 3D IR-OGprep-GRASE sequence with GRAPPA acceleration in measuring td-dependency in several GM and white matter (WM) regions of the human brain on a 3T system.
Methods
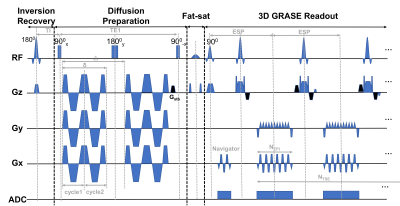
Pulse sequence: Figure 1 shows the 3D IR-OGprep-GRASE sequence, which consisted of four modules: the inversion recovery module, diffusion preparation module, fat saturation module, and GRASE readout module. An inversion recovery module with an inversion time (TI) of 2500 ms was added at the beginning of the sequence to null the CSF signal. GRAPPA acceleration was achieved in the EPI phase-encoding direction but not the turbo-echo direction.Data acquisition: Six healthy volunteers were enrolled with IRB approval. All scans were performed on a 3T MAGNETOM Prisma scanner with a 64-channel head coil. dMRI data were acquired using the 3D OGprep-GRASE sequence with or without the IR module with a PG-encoding (Δeff = 40ms, 0Hz) and OG-encodings at frequencies of 20 Hz (1 cycle), 40 Hz (2 cycles), and 60 Hz (3cycles) (effective td = 25, 12.5, and 8.3 ms). The other parameters were kept the same: FOV = 220 × 200 mm2, voxel size = 2 × 2 × 4 mm3, TR/TI/TE1 (TE of the diffusion module)/TE2 (TE of the GRASE module) = 9000/2500/103.46/31.94 ms, NEPI = 39, NTSE = 12, b = 420 s/mm2 with 6 directions and two averages, b = 0 with 4 averages, GRAPPA accelerated factor = 2.
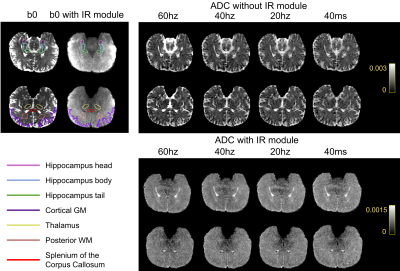
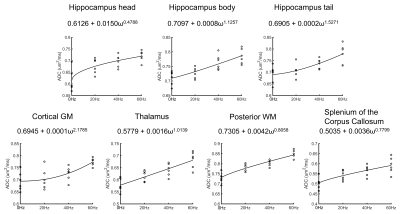
Data analysis: The acquired K-space data were reconstructed by GRAPPA reconstruction8 with Tikhonov Regularization9. Regions of interest (ROIs) including the hippocampal subfields (head, body, and tail), cortical GM, thalamus, posterior WM, and splenium of the corpus callosum (CC) were manually delineated on b0 images (Figure 2). The differences in ADC between the multi-frequency OG-dMRI and PG-dMRI data were assessed by ANOVA followed by post-hoc t-tests with Bonferroni correction. Besides, we estimated the apparent diffusion dispersion rate (Λ) and exponent (θ) based on the diffusion dispersion model: Dω =Λωθ +Dω03,10.
Results
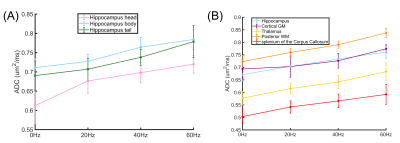
Figure 2 shows the b0 and ADC images acquired with PG- and OG-dMRI at different frequencies. Pairwise comparisons of ADC at different tds are summarized in Figure 3, which demonstrated td-dependent changes in the thalamus and posterior WM regions (p< 0.001) using both IR-OGprep-GRASE and OGprep-GRASE sequences. However, in the hippocampus, cortical GM, and splenium of CC that are close to the CSF, td-dependent ADC changes were only clear with the IR module. Also, ADCs measured with the IR sequence was significantly lower than that of the non-IR sequence (p< 0.001).Comparing the ADC values from different ROIs, we found ADCs in the hippocampal head were lower than that in the body or tail, and its td–dependent change was faster (from PG to OG-20Hz) than the other two sub-regions (Figure 4A). For the other ROIs (Figure 4B), we found the td–dependency pattern of cortical GM was distinct compared to other GM and WM regions, with a slower change from PG to OG-20Hz.
The diffusion dispersion parameters Λ and θ are displayed in Figure 5. We found θ>1 in most GM ROIs except for the hippocampal head, and θ < 1 in all WM ROIs. Λ was considerably higher in the hippocampal head than that in the hippocampus body/tail and cortical GM. The other GM and WM regions showed an intermediate Λ.
Discussion and Conclusion
In this work, we proposed a 3D IR-OGprep-GRASE sequence to investigate td-dependent diffusivity in the human brain. Compared with the previously developed OGprep-GRASE sequence, the proposed sequence with IR preparation can effectively suppress the CSF signal, and therefore improve the td-dependency measurements in the hippocampus, cortical GM, and CC. Besides, the current sequence is equipped with parallel acceleration to reduce the TE and improve the PSF profile.Based on IR-OGprep-GRASE measurements, we identified distinct td-dependency profiles in the human brain; moreover, sub-regions (head, body, and tail) of the hippocampus exhibited different td-dependency, possibly related to the different structural-functional organization of the sub-regions. The diffusion dispersion model showed the estimated θ < 1 in the splenium of CC, which was consistent with the recent report10,11. Interestingly, θ of the GM was larger than in the WM regions, indicating different structural disorder between GM and WM.
Acknowledgements
This work is supported by the Ministry of Science and Technology of the People’s Republic of China (2018YFE0114600), National Natural Science Foundation of China (61801424 and 81971606).References
1. Does MD, Parsons EC, Gore JC. Oscillating gradient measurements of water diffusion in normal and globally ischemic rat brain. Magnetic Resonance in Medicine: An Official Journal of the International Society for Magnetic Resonance in Medicine 2003;49(2):206-215.
2. Drobnjak I, Zhang H, Ianuş A, et al. PGSE, OGSE, and sensitivity to axon diameter in diffusion MRI: insight from a simulation study. Magnetic resonance in medicine 2016;75(2):688-700.
3. Novikov DS, Jensen JH, Helpern JA, et al. Revealing mesoscopic structural universality with diffusion. Proceedings of the National Academy of Sciences 2014;111(14):5088-5093.
4. Novikov DS, Kiselev VG. Surface-to-volume ratio with oscillating gradients. Journal of magnetic resonance 2011;210(1):141-145.
5. Xu J, Li H, Harkins KD, et al. Mapping mean axon diameter and axonal volume fraction by MRI using temporal diffusion spectroscopy. NeuroImage 2014;103:10-19.
6. Wu D, Liu D, Hsu YC, et al. Diffusion‐prepared 3D gradient spin‐echo sequence for improved oscillating gradient diffusion MRI. Magnetic resonance in medicine 2020;85(1):78-88.
7. Griswold MA, Jakob PM, Heidemann RM, et al. Generalized autocalibrating partially parallel acquisitions (GRAPPA). Magnetic Resonance in Medicine: An Official Journal of the International Society for Magnetic Resonance in Medicine 2002;47(6):1202-1210.
8. Qu P, Wang C, Shen GX. Discrepancy‐based adaptive regularization for GRAPPA reconstruction. Journal of Magnetic Resonance Imaging: An Official Journal of the International Society for Magnetic Resonance in Medicine 2006;24(1):248-255.
9. Fuhry M, Reichel L. A new Tikhonov regularization method. Numerical Algorithms 2012;59(3):433-445.
10. Arbabi A, Kai J, Khan AR, et al. Diffusion dispersion imaging: Mapping oscillating gradient spin‐echo frequency dependence in the human brain. Magnetic Resonance in Medicine 2020;83(6):2197-2208.
11. Baron CA, Beaulieu C. Oscillating gradient spin‐echo (OGSE) diffusion tensor imaging of the human brain. Magnetic resonance in medicine 2014;72(3):726-736.
Figures


