1310
Imaging intracortical structure using navigator-based, motion and B0-corrected T2*-weighted MRI at 7 T1AMRI, LFMI, NINDS, National Institutes of Health, Bethesda, MD, United States
Synopsis
High-resolution T2*-weighted 7 T MRI can be used to delineate intracortical structure owning to its high signal-to-noise and contrast-to-noise ratio. However, subject motion remains a major challenge to obtain reliable high-resolution data; the long scan time and increased sensitivity of T2*-weighted signal at 7 T to motion and motion-induced B0 fluctuation make high-resolution T2*-weighted MRI particularly motion sensitive. In this study, the performance of a previously developed navigator-based motion and B0 correction approach was evaluated for intracortical imaging.
Introduction
The susceptibility-induced contrast in both magnitude and phase of T2*-weighted (T2*w) MR signal increases with the field strength. At 7 T, it has been proved useful to detect the intracortical features of the brain in both healthy1 and pathological2 tissue. At very high resolution and with long scan time, involuntary patient motion impedes obtaining reliable high-quality T2*w data. This is due to not only the displacement directly, but also the spatially variant B0 field fluctuation induced by motion, an effect that is proportional to the scanner’s field strength. The goal of this study is to evaluate the strategy of sensor-free navigator-based motion and B0 correction in T2*w MRI for imaging intracortical structure at 7 T.Methods
MRI acquisition and reconstructionExperiments were performed on a 7 T MRI scanner (Magnetom, Siemens) with a 32-channel head RF receiver array (Nova Medical). Four healthy subjects were recruited and signed consent under an approved IRB protocol. High-resolution dual-echo T2*w data was acquired using a previously developed 3D gradient echo sequence with simultaneous acquisition of a volumetric navigator3. Two echoes were acquired to estimate the local susceptibility-induced off-resonance frequency without bias due to the RF phase. Parameters of the T2*w acquisition include: resolution=0.3x0.3x0.4 mm3, TE1/TE2/TR=18/39/74 ms, flip angle=14°, bandwidth=54 Hz/pixel, FOV=240x180x32 mm3, SENSE rate=2x1 and scan time=35.5 mins. The navigator was acquired using segmented 3D EPI immediately before T2*w data in each TR. The spatial and temporal resolution of the navigator were 5x5.625x3.2 mm3 and 0.4 s, respectively. Two scans were performed for each subject. Subjects were instructed to stay relaxed during the scans.
T2*w images were reconstructed in corrected and uncorrected modes, respectively. In the corrected mode, motion and linear B0 changes in the navigator measurement were used to correct the T2*w data retrospectively3,4. In the uncorrected mode, only a global average B0 change from the navigator signal was compensated for.
Data analysis
T2*w magnitude images were calculated as the average magnitude at the two echo times. After removal of the RF phase, tissue susceptibility-induced local frequency maps were approximated by background field removal5. The RF phase was estimated by first voxel-wise linear fitting of the dual-echo phase data and secondly spatial fitting using third-order polynomials to reduce noise. Test-retest reliability of the T2*w images was evaluated using the normalized root mean square error (NRMSE) between the aligned magnitude images from the two acquisitions for each subject.
Results
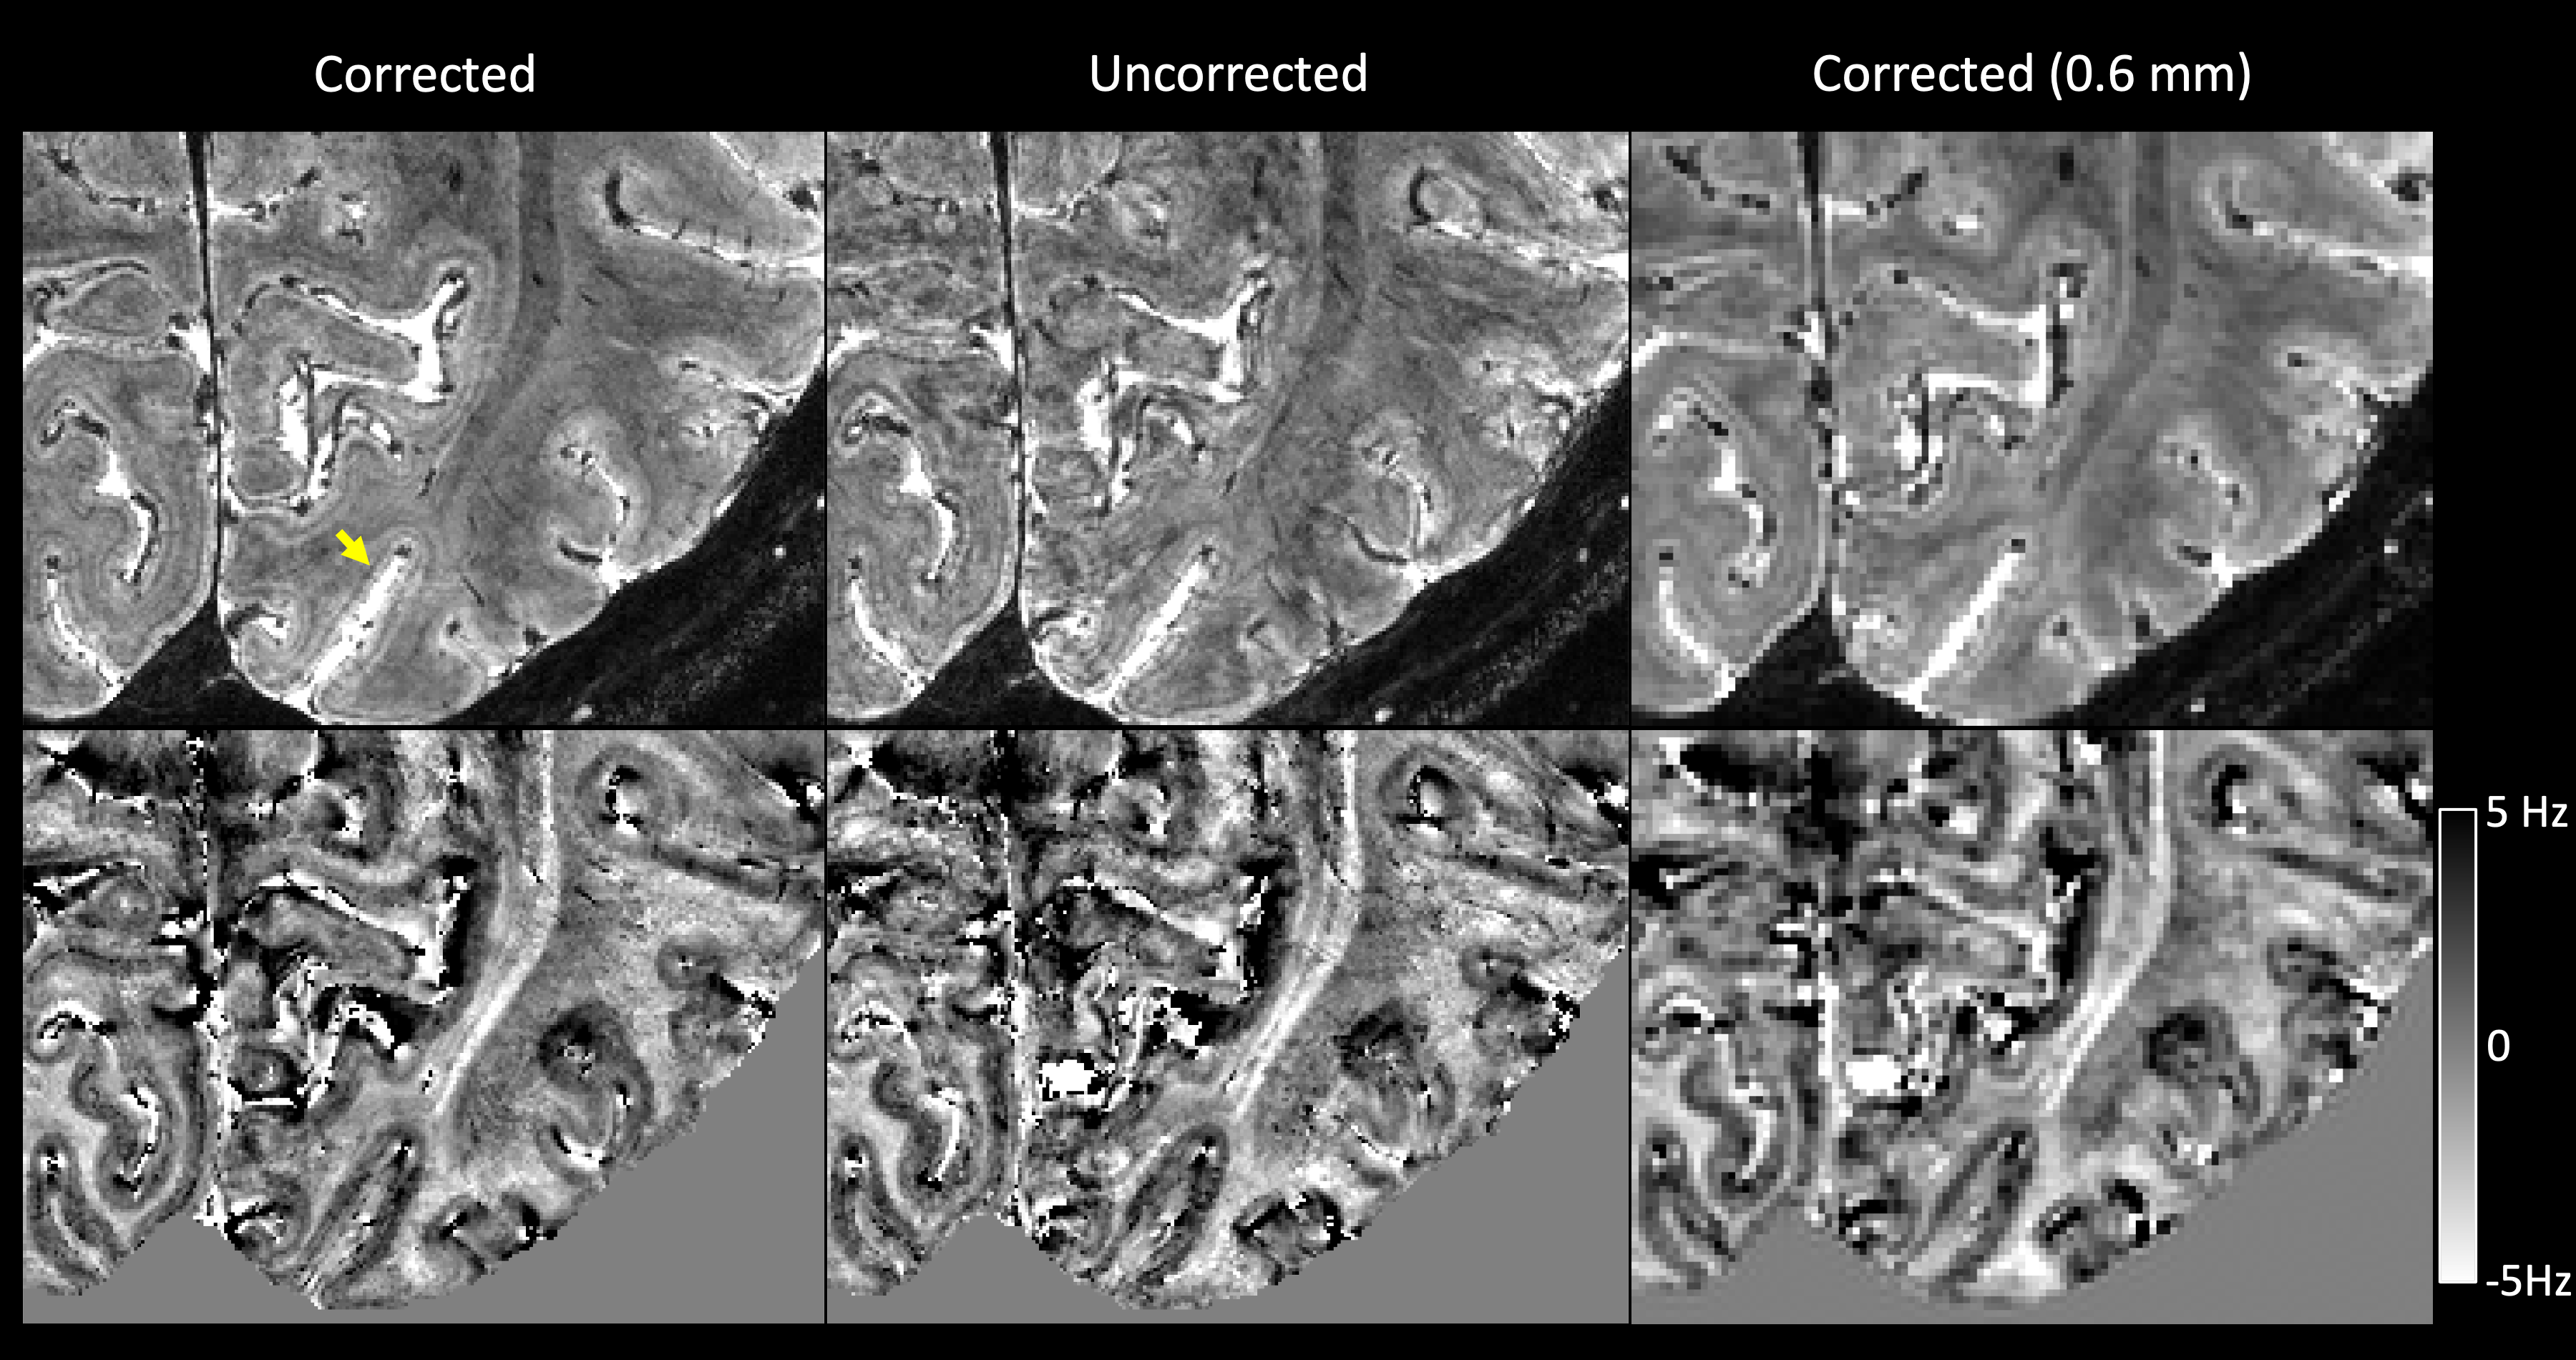
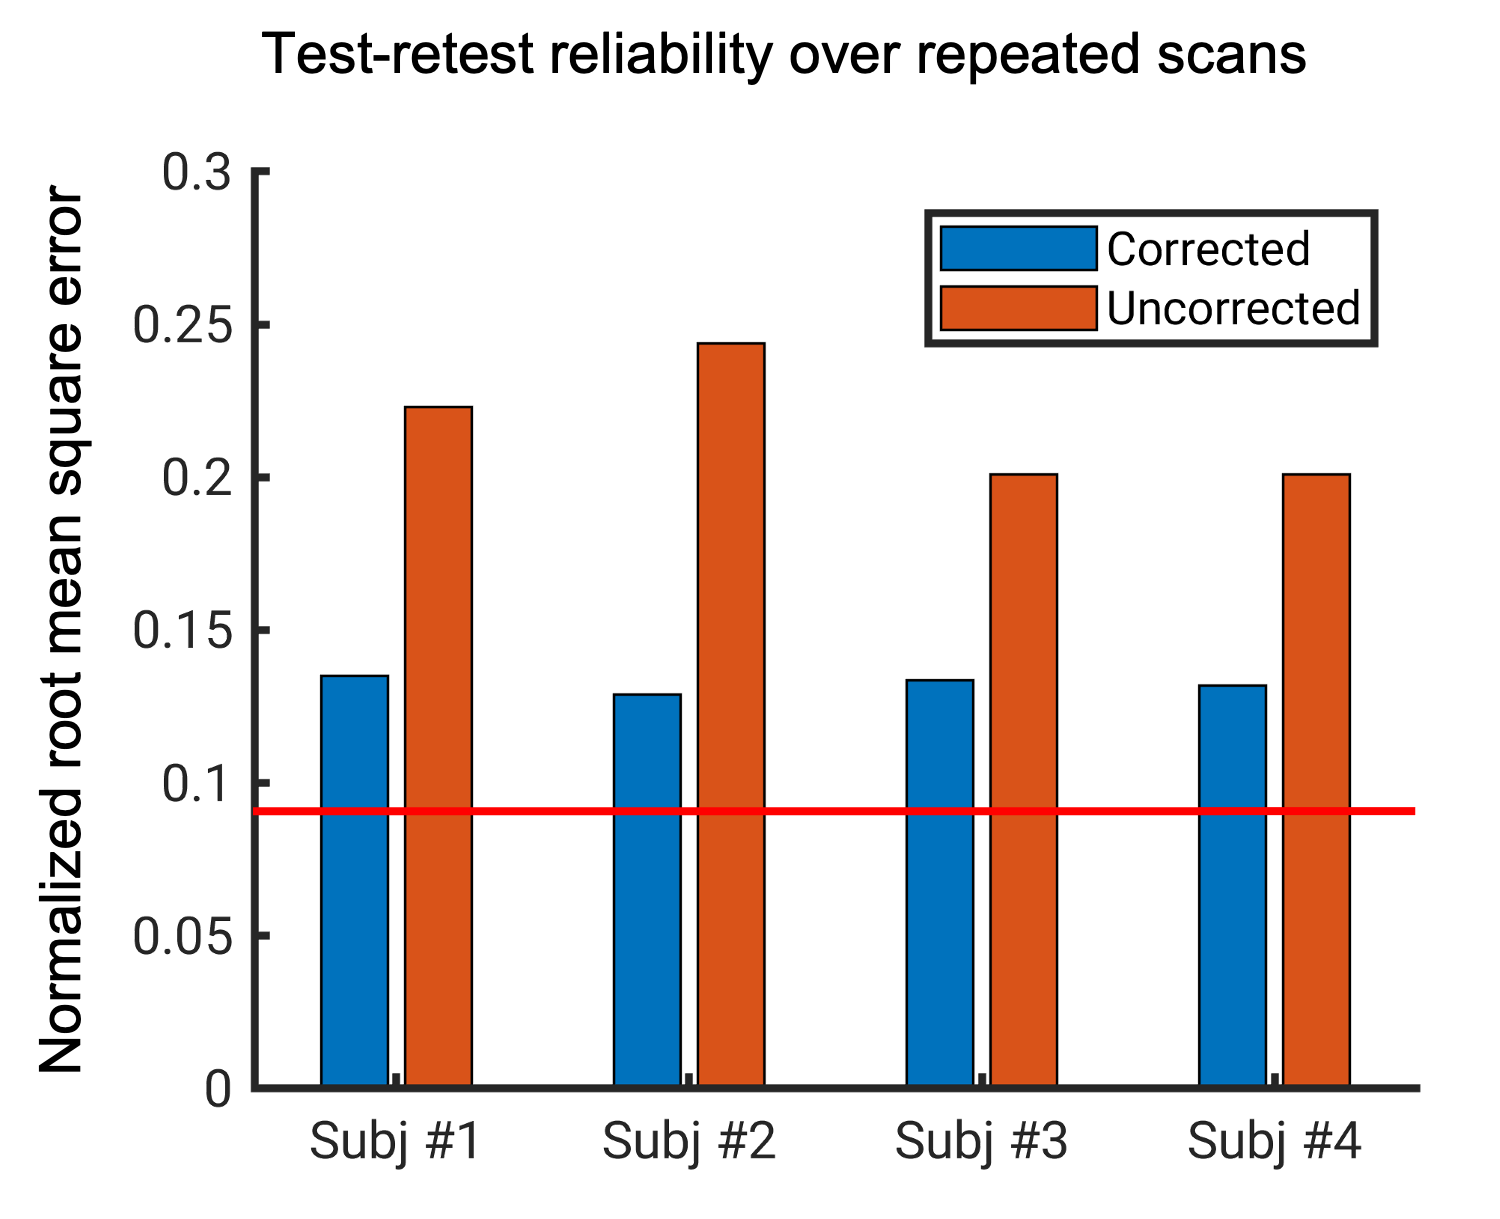
Fig.1 shows an example in the visual region of one subject. Overall, the artifact level was noticeably reduced, and the tissue boundary was better defined in the corrected magnitude and frequency maps. The correction significantly improved the delineation of the Line of Gennari in the middle layer of the primary visual cortex. Similar improvement was visually confirmed in all subjects. The frequency maps generally demonstrated superior gray-to-white matter contrast. Even with correction, the Line of Gennari did not appear consistently in the frequency map, which we attribute to effects of tissue orientation in the magnetic field6. Reducing the resolution to isotropic 0.6 mm in the corrected image, a substantial segment of the Line of Gennari became invisible.With correction, image quality from such high-resolution, long scans was improved consistently across all subjects. This was evident in Fig. 2 where NRMSE of two independent scans was reduced to an average of 0.13, slightly above the thermal noise floor at 0.09, compared to more than 0.2 in the uncorrected images.
Discussion and Conclusion
In this study, a navigator-based motion and B0 correction approach showed high robustness when applied to correct very high resolution (0.3 mm) T2*-weighted MRI at 7 T. The long scan time (35.5 minutes) and high resolution in this study renders the data quality sensitive to involuntary subject motion. Detailed structures at the intracortical scale were successfully recovered with correction. Without using additional device or introducing additional scan time, this navigator-based approach is desirable for applications of very high resolution.Acknowledgements
This study was supported by the intramural research program of National Institute of Neurological Disorders and Stroke.References
1. Duyn, J. H. et al. High-field MRI of brain cortical substructure based on signal phase. Proc. Natl. Acad. Sci. U. S. A. 104, 11796–11801 (2007).
2. Kenkhuis, B. et al. 7T MRI allows detection of disturbed cortical lamination of the medial temporal lobe in patients with Alzheimer’s disease. NeuroImage Clin. 21, 101665 (2019).
3. Liu, J., van Gelderen, P., de Zwart, J. A. & Duyn, J. H. Reducing motion sensitivity in 3D high-resolution T2*-weighted MRI by navigator-based motion and nonlinear magnetic field correction. Neuroimage 206, 116332 (2020).
4. Gretsch, F., Marques, J. P. & Gallichan, D. Investigating the accuracy of FatNav-derived estimates of temporal B0 changes and their application to retrospective correction of high-resolution 3D GRE of the human brain at 7T. Magn. Reson. Med. 80, 585–597 (2018).
5. Li, W., Wu, B. & Liu, C. Quantitative susceptibility mapping of human brain reflects spatial variation in tissue composition. NeuroImage 55, 1645–1656 (2011).
6. Duyn, J. MR Susceptibility Imaging. J. Magn. Reson. 229, 198–207 (2013).
Figures