1309
Associations of Musical Aptitude with High Angular Resolution Diffusion Imaging (HARDI) derived structural connectivity1Symbiosis Centre for Medical Image Analysis, Symbiosis International(Deemed) University, Pune, India, 2Language,Literacy and Music Lab, National Brain Research Centre, Gurgaon, India
Synopsis
Pre-existing structural connectivity could well explain predisposition to musical aptitude. The study aimed to associate Individual differences in High Angular Resolution Diffusion Imaging (HARDI) derived structural connectivity to music perception abilities as assessed by the performance in a music perception test. An increased whole brain connectivity was found to be associated with increased performance especially in the sequential music perception measures that comprised of Standard Rhythm, Embedded Rhythm, Accent and Melody. A prevalence of interhemispheric connectivity over intrahemispheric connectivity was also observed. Distinct structural connectivity patterns could thus be a determinant of sequential processing aptitude in music.
Introduction
While research has shown that musical competence can be achieved by extended musical training and deliberate practice1, the role of innate abilities like musical aptitude, namely, the raw untutored ability to process music, cannot be ignored2. Predisposition in the form of inter-individual differences in musical abilities as reflected in the brain can be discerned using structural and functional neuroimaging methods. Recent advances in diffusion imaging has given rise to more bio physiologically meaningful models that better delineate the white matter microstructure and connectivity3. The objective of this study was to associate the whole brain structural connectivity derived from High Angular Resolution Diffusion Imaging (HARDI) data with innate abilities in distinct modules of music perception, in a heterogeneous cohort with different degrees of musical training.Methods
A musically heterogeneous group of 27 subjects (Age 24.3 ± 2.7 years, 14 M) ranging from non-musicians to professional musicians were used. Music perception abilities were assessed by the performance in Profile of Music Perception Skills – short version (PROMS-S4), which gauges skill level in different aspects of music using eight subtests comprised of sequential (Standard Rhythm, Embedded Rhythm, Accent and Melody sub-scores) and sensory (Tempo, Pitch, Timbre, and Tuning sub-scores) processing domains4,5. Performance on the PROMS-S was measured using d-prime (d’) scores. HARDI data (64 directions with b=2000s/mm2 and one b=0 image) was acquired on a 3T Philips Achieva scanner with an 8-channel head coil. T1 weighted 3D-MPRAGE images were also acquired. Diffusion images were preprocessed using MRtrix3 software6 and pre-processing involved denoising7, Gibbs ringing artefact removal8, bias field correction6 and eddy current induced distortion correction9. The pre-processed images were skull stripped10 and the signal response functions for grey matter(GM), white matter (WM) and Cerebrospinal fluid(CSF) were estimated using an unsupervised algorithm11. The fiber orientation dispersion functions (FODs) were generated for the three tissue types from these response functions using the single shell 3-tissue constrained spherical deconvolution (SS3T-CSD12). A probabilistic streamlines tractography13 was performed by dynamically seeding from the normalized white matter FODs to generate 20 million streamlines (step length= 0.1mm, FOD cutoff = 0.1 and was further filtered down to 2M streamlines14. Finally, the T1 weighted images were parcellated15 into 87 distinct regions16 and registered to the diffusion weighted images. Structural connectomes were constructed using the 87 regions as nodes and the 2M tractogram streamlines as edges, yielding an 87x87 network. Network based statistics(NBS17) was conducted wherein linear associations between performance in PROMS-S and structural connectivity were compared. Mass univariate statistics within a General Linear Model (GLM) framework was carried out on each edge. Age, Gender and Self-reported years of musical training were used as nuisance covariates (Resulting GLM: Number of Streamlines of the edge = ß0 + ß1 x d`score + ß2 x Age + ß3 x Gender + ß4 x Years of Training). Permutation based statistics with 5000 random permutations was used to alleviate familywise errors due to multiple comparisons and statistical significance was set at p<0.05. Similar analyses were also performed by computing d`s separately for sequential and sensory sub-scores.Results
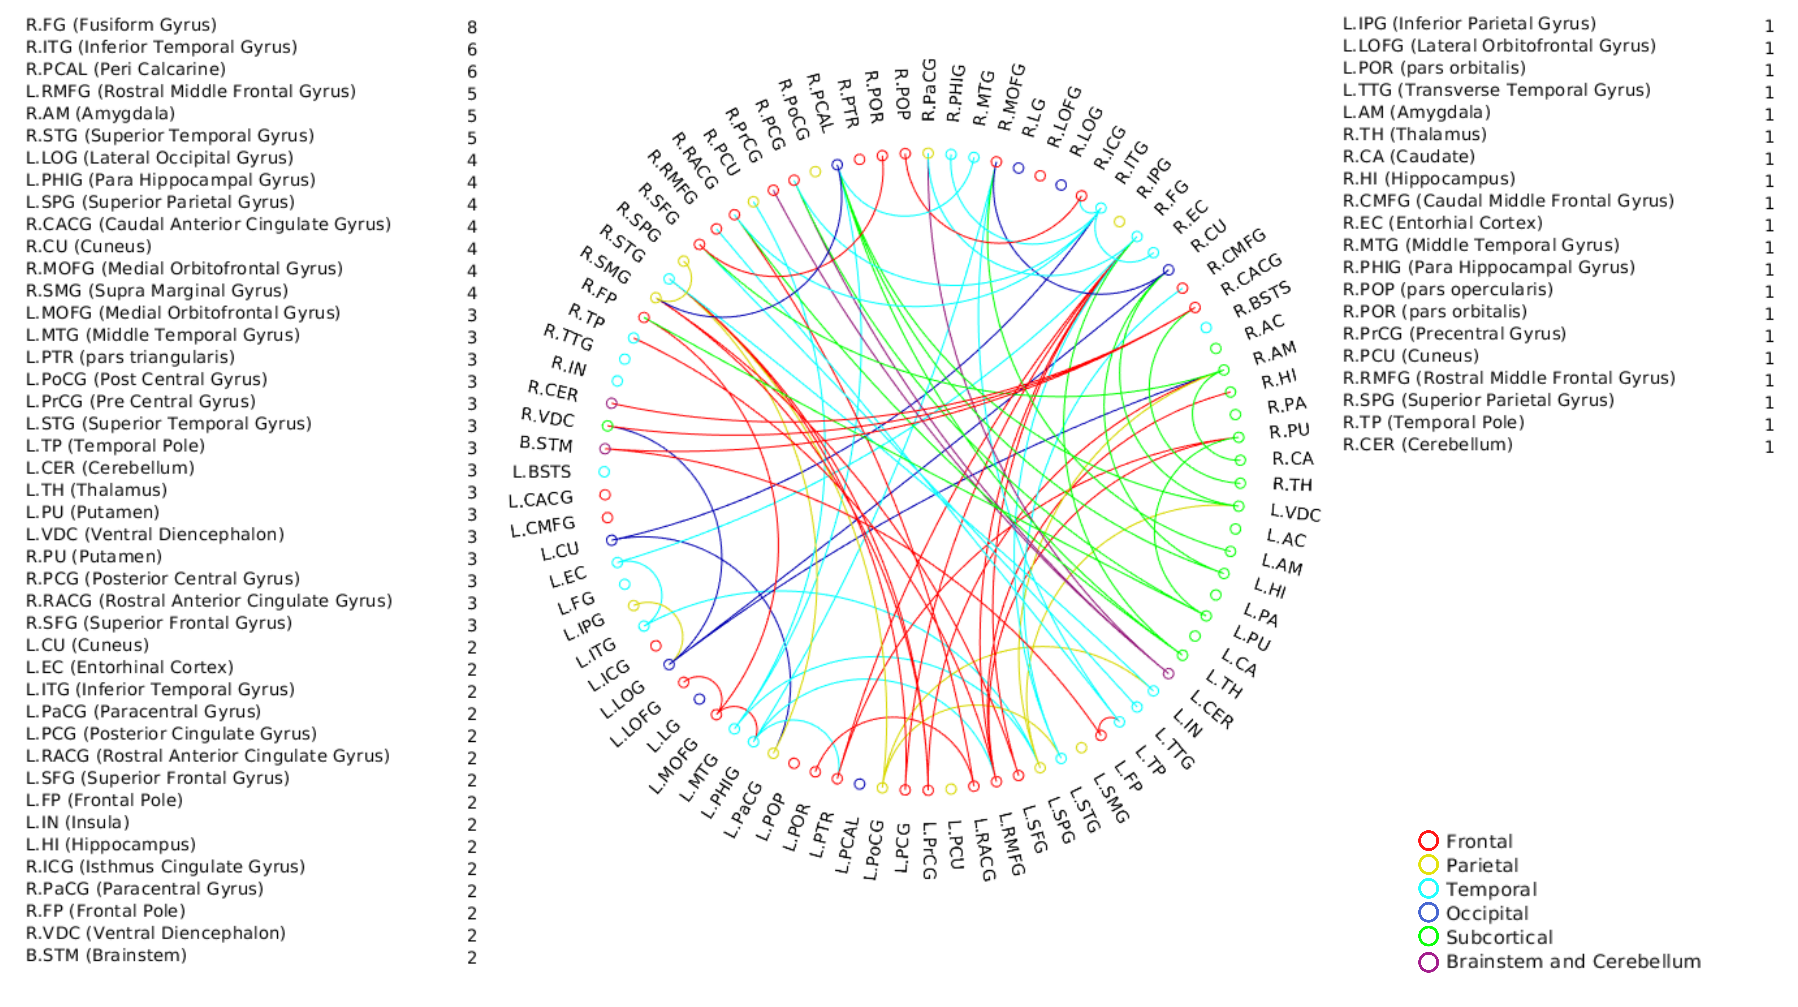
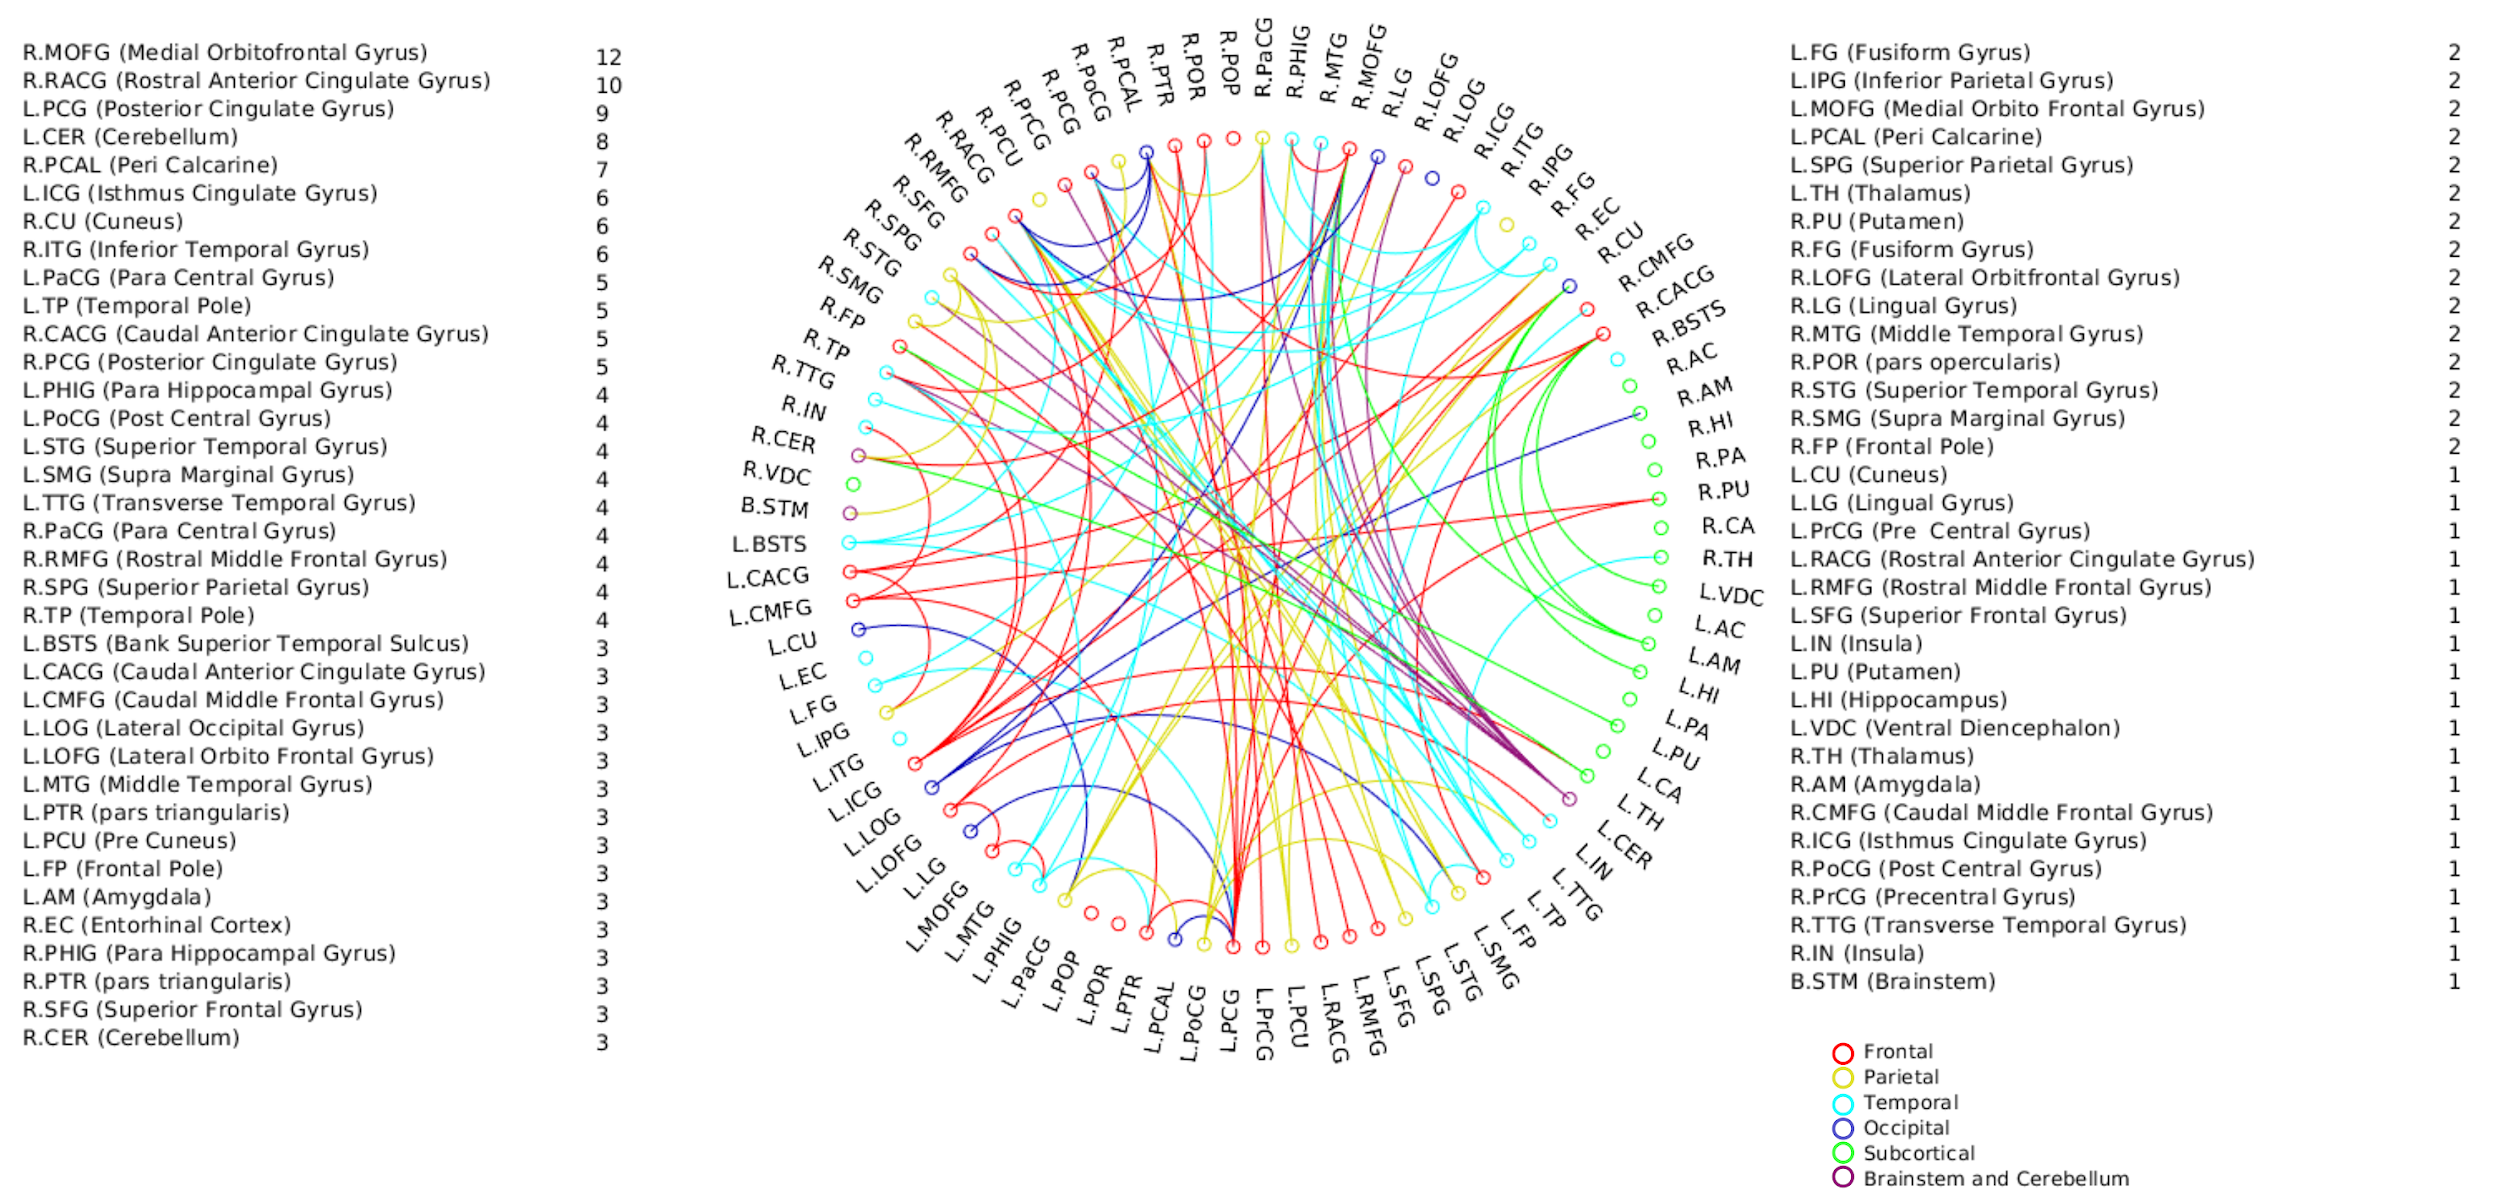
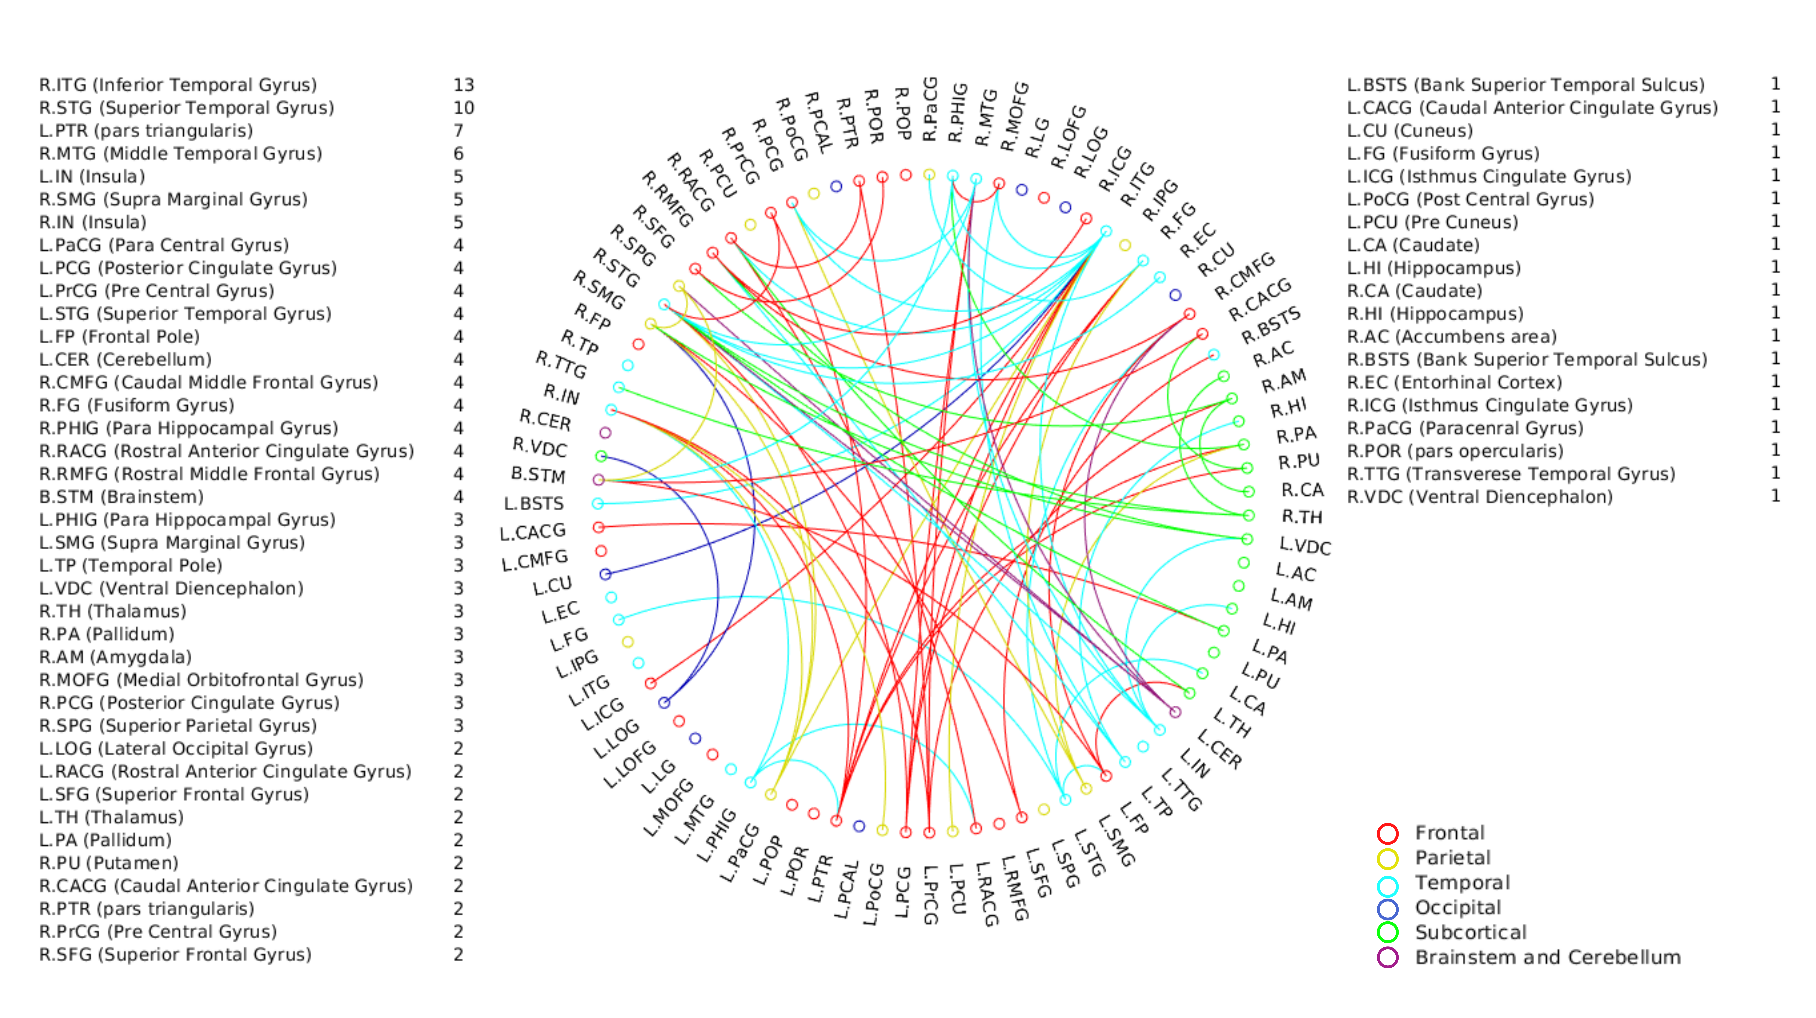
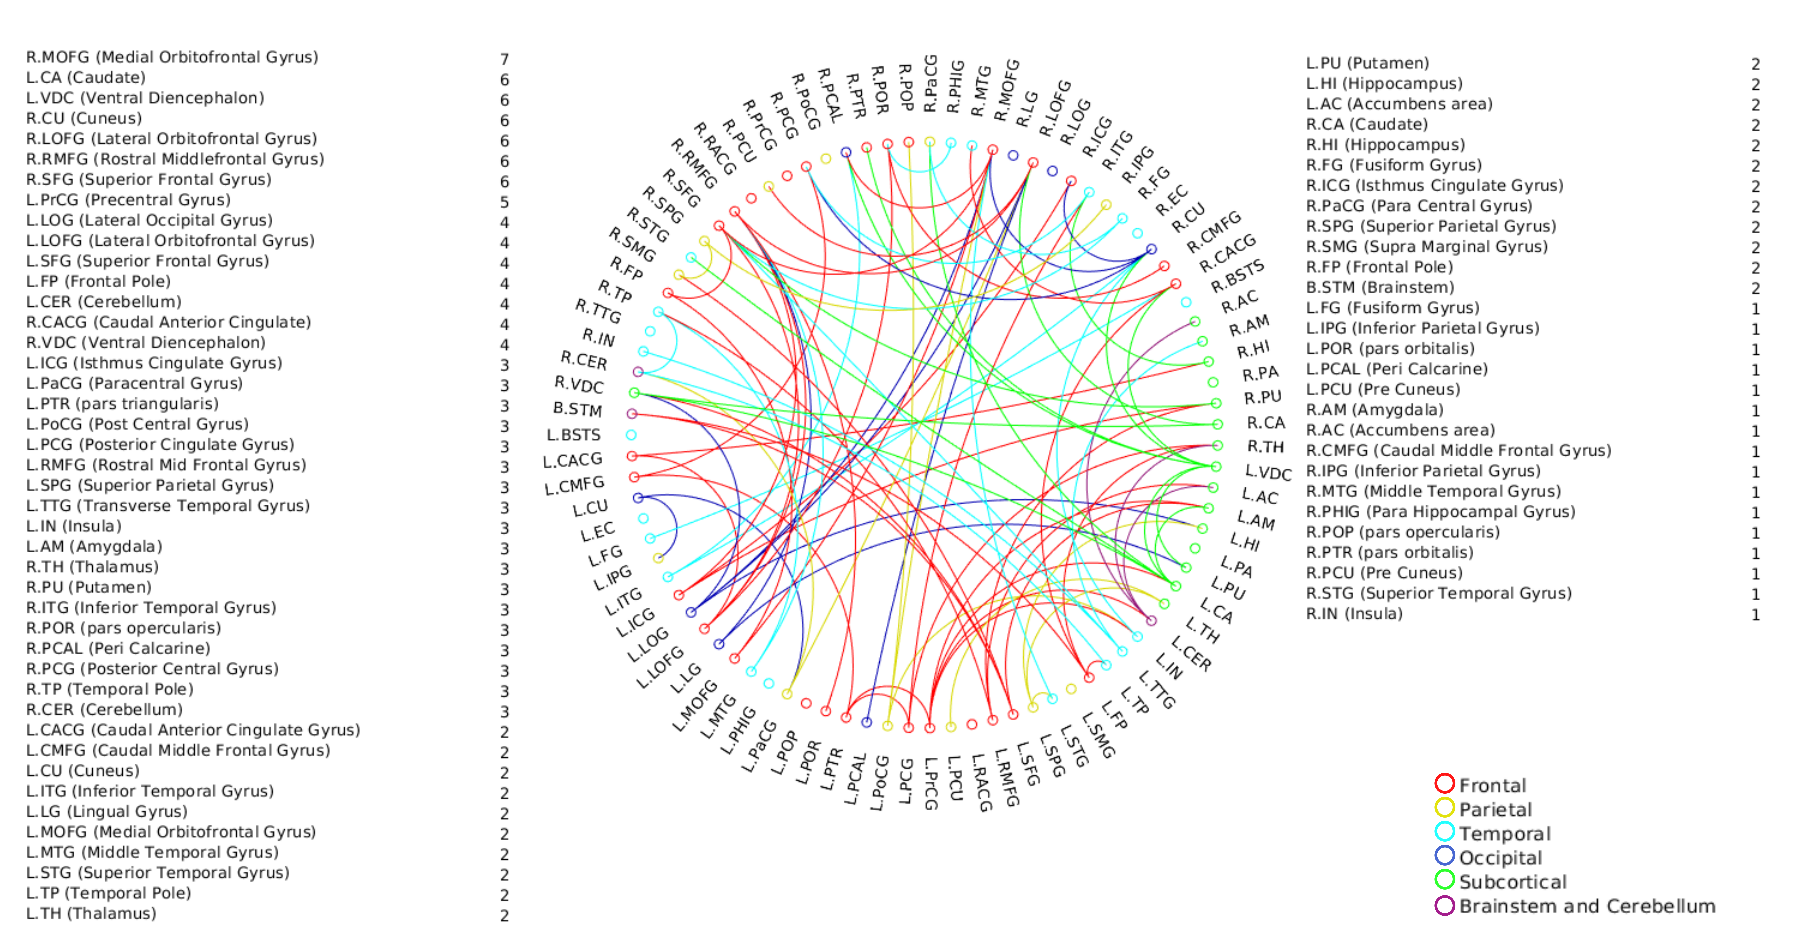
A positive linear association was found between the overall music perception abilities as assessed by the d`total scores and a network comprising of 63 nodes and 79 edges (of which 47 were interhemispheric) consisting primarily of fronto-temporal and parieto-frontal connections, with also some subcortical, cerebellar and brainstem connections (Fig.1). Network based statistics on sequential and sensory perceptual subscores also revealed a positive linear association with structural connectivity networks primarily composed of fronto-temporal, fronto-parietal, cerebellar and subcortical connections, for the sequential subscores comprising of Standard Rhythm, Embedded Rhythm, Accent and Melody(Fig.2). Such associations were absent for sensory subscores comprising Tuning, Timbre, Tempo and Pitch. Standard Rhythm and Embedded Rhythm subscores also showed such positive linear associations, when individual sub-scores were analysed (Fig.3 and Fig.4).Discussion
This study used for the first time, a whole brain structural connectivity analysis, to investigate individual differences in music perception abilities using a heterogeneous group of individuals with varying degrees of musical training. Key novel findings of the study were: (i) a prevalence of inter-hemispheric than intra-hemispheric connectivity that showed positive linear associations with better music perception abilities. (ii) sequential and not sensory sub-scores showed associations with whole brain structural connectivity suggesting an involvement of better sequential processing related attributes like working memory that could have been influenced by the brain structure. We thus hypothesize that the regions that showed enhanced structural connectivity with performance in the sequential sub-scores reflected enhanced domain general ability such as auditory sensory memory.Conclusion
This study demonstrates that distinct interhemispheric brain connectivity in fronto-temporal, cerebellar and cerebro-subcortical connections could be a determinant of sequential processing aptitude in music. Enhanced connectivity in these networks may predispose individuals towards temporal perceptual abilities. Non-overlapping patterns of connectivity observed for individual subscore level for subscores like Rhythm and Embedded Rhythm also suggest the existence of different modules to process different sub-domains in musical stimuli.Acknowledgements
NoneReferences
[1] Ericsson A, Pool R. 2016. Peak: Secrets from the New Science of Expertise. Houghton Mifflin Harcourt
[2] Gingras B, Honing H, Peretz I, Trainor LJ, Fisher SE. 2015. Defining the biological bases of individual differences in musicality. Philos Trans R Soc Lond B Biol Sci. 370:20140092.
[3] Tardif CL, Gauthier CJ, Steele CJ, Bazin PL, Schäfer A, Schaefer A, Villringer A. (2016). Advanced MRI techniques to improve our understanding of experience-induced neuroplasticity. Neuroimage, 131, 55-72
[4] Zentner M, Strauss H. 2017. Assessing musical ability quickly and objectively: development and validation of the Short-PROMS and the Mini-PROMS. Ann N Y Acad Sci. 1400:33–45.
[5] Law LNC, Zentner M. 2012. Assessing musical abilities objectively: construction and validation of the profile of music perception skills. PLoS One. 7:e52508
[6] Tournier J-D, Smith R, Raffelt D, Tabbara R, Dhollander T, Pietsch M, Christiaens D, Jeurissen B, Yeh C-H, Connelly A. 2019. MRtrix3: A fast, flexible and open software framework for medical image processing and visualisation. Neuroimage. 202:116137
[7] Veraart J, Novikov DS, Christiaens D, Ades-Aron B, Sijbers J, Fieremans E. 2016. Denoising of diffusion MRI using random matrix theory. Neuroimage. 142:394–406.
[8] Kellner E, Dhital B, Kiselev VG, Reisert M. 2016. Gibbs-ringing artifact removal based on local subvoxel-shifts. Magn Reson Med. 76:1574–1581
[9] Andersson JLR, Sotiropoulos SN. 2016. An integrated approach to correction for off-resonance effects and subject movement in diffusion MR imaging. Neuroimage. 125:1063–1078.
[10] Smith SM. 2002. Fast robust automated brain extraction. Hum Brain Mapp. 17:143–155.
[11] Dhollander T, Raffelt D, Connelly A.2016. Unsupervised 3-tissue response function estimation from single-shell or multi-shell diffusion MR data without a co-registered T1 image. ISMRM Workshop on Breaking the Barriers of Diffusion MRI, 2016, 5
[12] Dhollander T, Connelly A.2016. A novel iterative approach to reap the benefits of multi-tissue CSD from just single-shell (+ b= 0) diffusion MRI data. In Proc ISMRM (Vol. 24, p. 3010).
[13] Tournier JD, Calamante F, Connelly A. 2010. Improved probabilistic streamlines tractography by 2nd order integration over fibre orientation distributions. In Proc. ISMRM (Vol. 1670). ISMRM.
[14] Smith RE, Tournier J-D, Calamante F, Connelly A. 2015. SIFT2: Enabling dense quantitative assessment of brain white matter connectivity using streamlines tractography. Neuroimage. 119:338–351.
[15] Fischl B. 2012. FreeSurfer. NeuroImage.
[16] Desikan RS, Ségonne F, Fischl B, Quinn BT, Dickerson BC, Blacker D, Buckner RL, Dale AM, Maguire RP, Hyman BT, Albert MS, Killiany RJ. 2006. An automated labeling system for subdividing the human cerebral cortex on MRI scans into gyral based regions of interest. Neuroimage. 31:968–980.
[17] Zalesky A, Fornito A, Bullmore ET. 2010. Network-based statistic: Identifying differences in brain networks. NeuroImage.
Figures