1307
Clinical Whole-Brain R2* and Quantitative Susceptibility Maps at 3T – Reproducibility and Parameter Optimization Towards Millimetric 5min Scan1Siemens Healthcare SAS, Saint-Denis, France, 2CRMBM UMR7339 CNRS Aix-Marseille Université, Marseille, France
Synopsis
Advanced quantitative susceptibility mapping techniques allow to jointly estimate R2* and QSM in the brain. This work aims at comparing several multi gradient-recalled echo sequences in terms of coil setup and acceleration factors using available product sequences and modern hardware. In addition, an automatic and standardized post-processing pipeline is proposed for clinical studies. We show that quantitative values do not differ from the head coil and acceleration factor that were used, thus allowing for a millimetric whole brain coverage within 5 minutes scan time.
Introduction
Quantitative susceptibility mapping1 (QSM) and R2* mapping techniques are now considered as quantitative biomarkers of iron, calcium and myelin2,3 brain tissue content, with previously reported alterations in several neurological pathologies involving neurodegeneration, inflammation, oncology or trauma1,4-14.To facilitate clinical translation of QSM and to improve scan time efficiency, this study aims at comparing several protocols in terms of head coils, acceleration factors and repetition times. Reproducibility of the QSM data obtained on different MR scanners was also investigated. In a “travelling subject” setup, all the results were obtained from the same volunteer, with an automatic processing pipeline providing quantitative values in various brain regions.
Methods
Experiments were performed over 3.5 years on a healthy volunteer (37-y.o. at first pass) on different clinical 3T systems (MAGNETOM Verio, and MAGNETOM Vida, Siemens Healthcare, Erlangen, Germany) with body coil transmission and different coil-density receive head coils (32-channel head, 20-channel and 64-channel head/neck). The protocol included a 3D T1w anatomical reference (MPRAGE, ADNI) repeated on each scanner and for each coil used.R2*/QSM acquisitions were all based on a millimetric spoiled multi-echo gradient-recalled echo (GRE) sequence with fixed echo times ranging from 4.22ms to 30.50ms. The original 10min protocol was taken from a clinical multi-centric whole-brain T2* mapping protocol at 3T15, standardized across hardware from several manufacturers, and consisting of the acquisition of six successive monopolar gradient echoes with a net GRAPPA acceleration factor of 3.
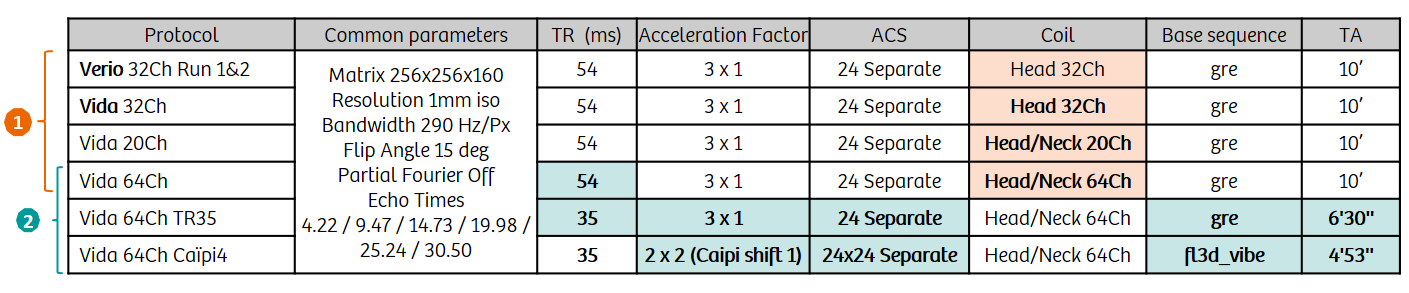
Relevant protocol parameters are reported in Table 1. Briefly, the original 10min protocol was repeated twice on the Verio system with three years interval between scans. Four months later, the same protocol was repeated on Vida system using the same 32Ch head coil, as well as the 20Ch and 64Ch head/neck coils. Next, the protocol was acquired with a reduced repetition time of 35ms instead of 54ms. The acceleration factor was then increased to 4 using a Caipirinha pattern in both phase encoding directions to finally achieve a 5min scan time compatible with clinical routine.
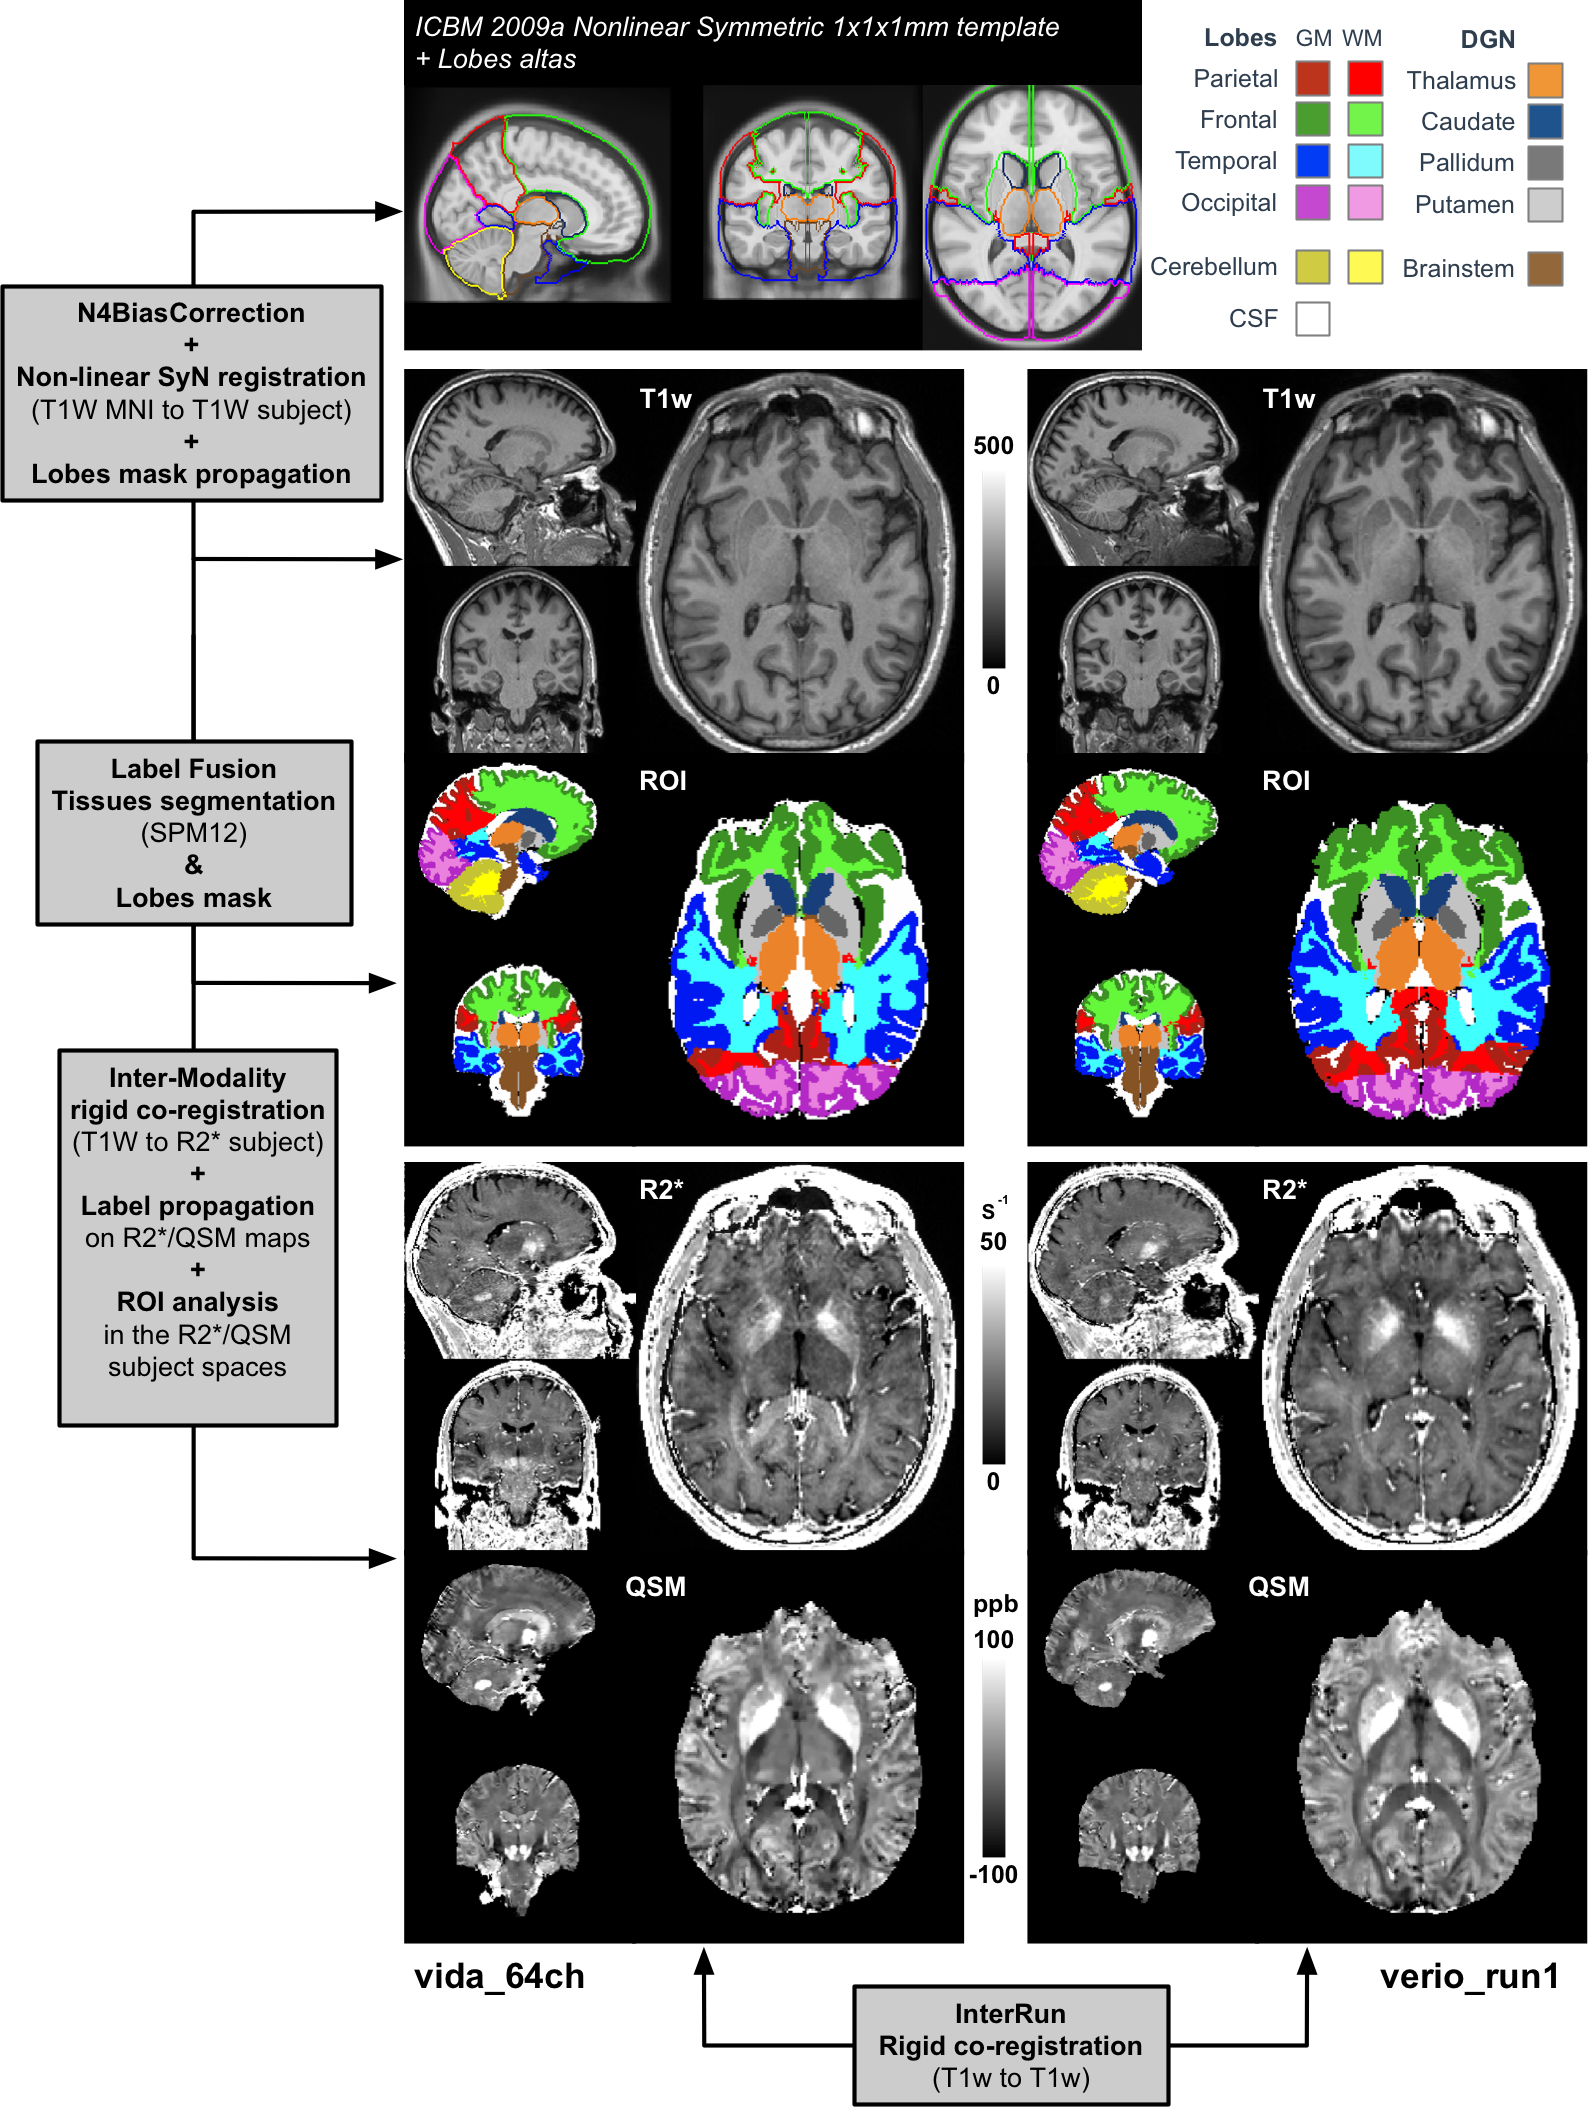
The reconstruction of R2* and QSM maps was done as in referencses16,17 using automatic Morphology Enabled Dipole Inversion18,19. On the Verio system, coil combination was performed using a specific reconstruction program using the first echo phase as a reference. On the Vida, the default phase reconstruction was used in the adaptive combined mode20. The automatic post-processing pipeline is reported in Figure 1 and consisted in several co-registration steps, label propagation from the MNI template and tissue segmentation using SPM12. The entire pipeline is described in the figure’s legend.
Results
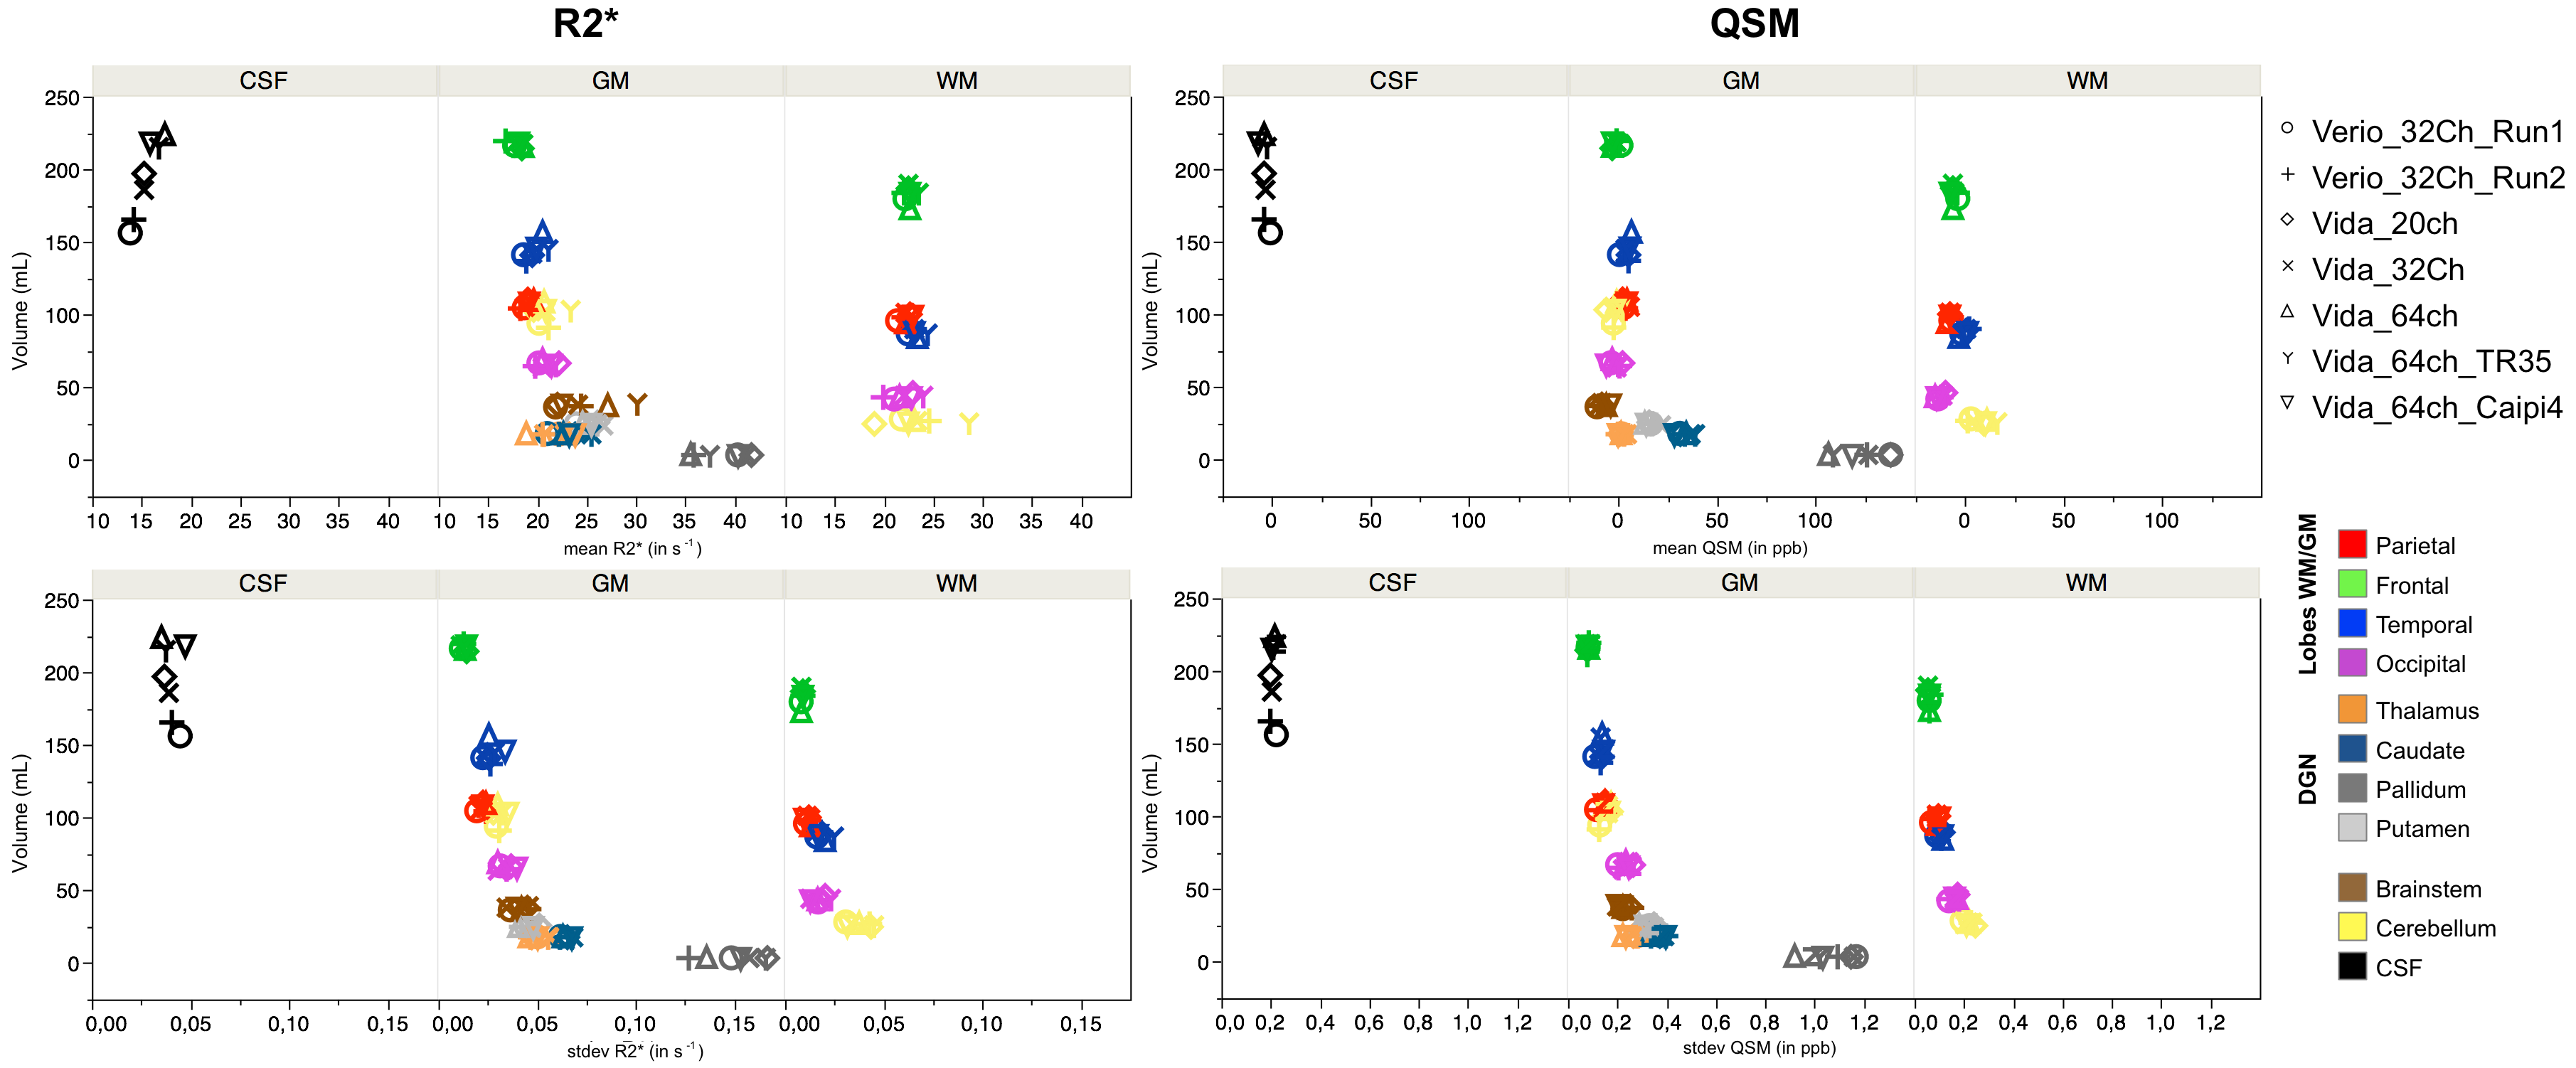
Representative R2* and QSM maps are shown in Figure 1. Contrast and image quality were qualitatively similar between all scans.Regional values (mean and standard error of mean) of all extracted regions are reported in Figure 2 for the different protocols. Overall, both R2* and QSM values were in agreement between all scanners, coils and protocols, with an excepted higher R2* and QSM values in deep grey nuclei and especially in the pallidum21.
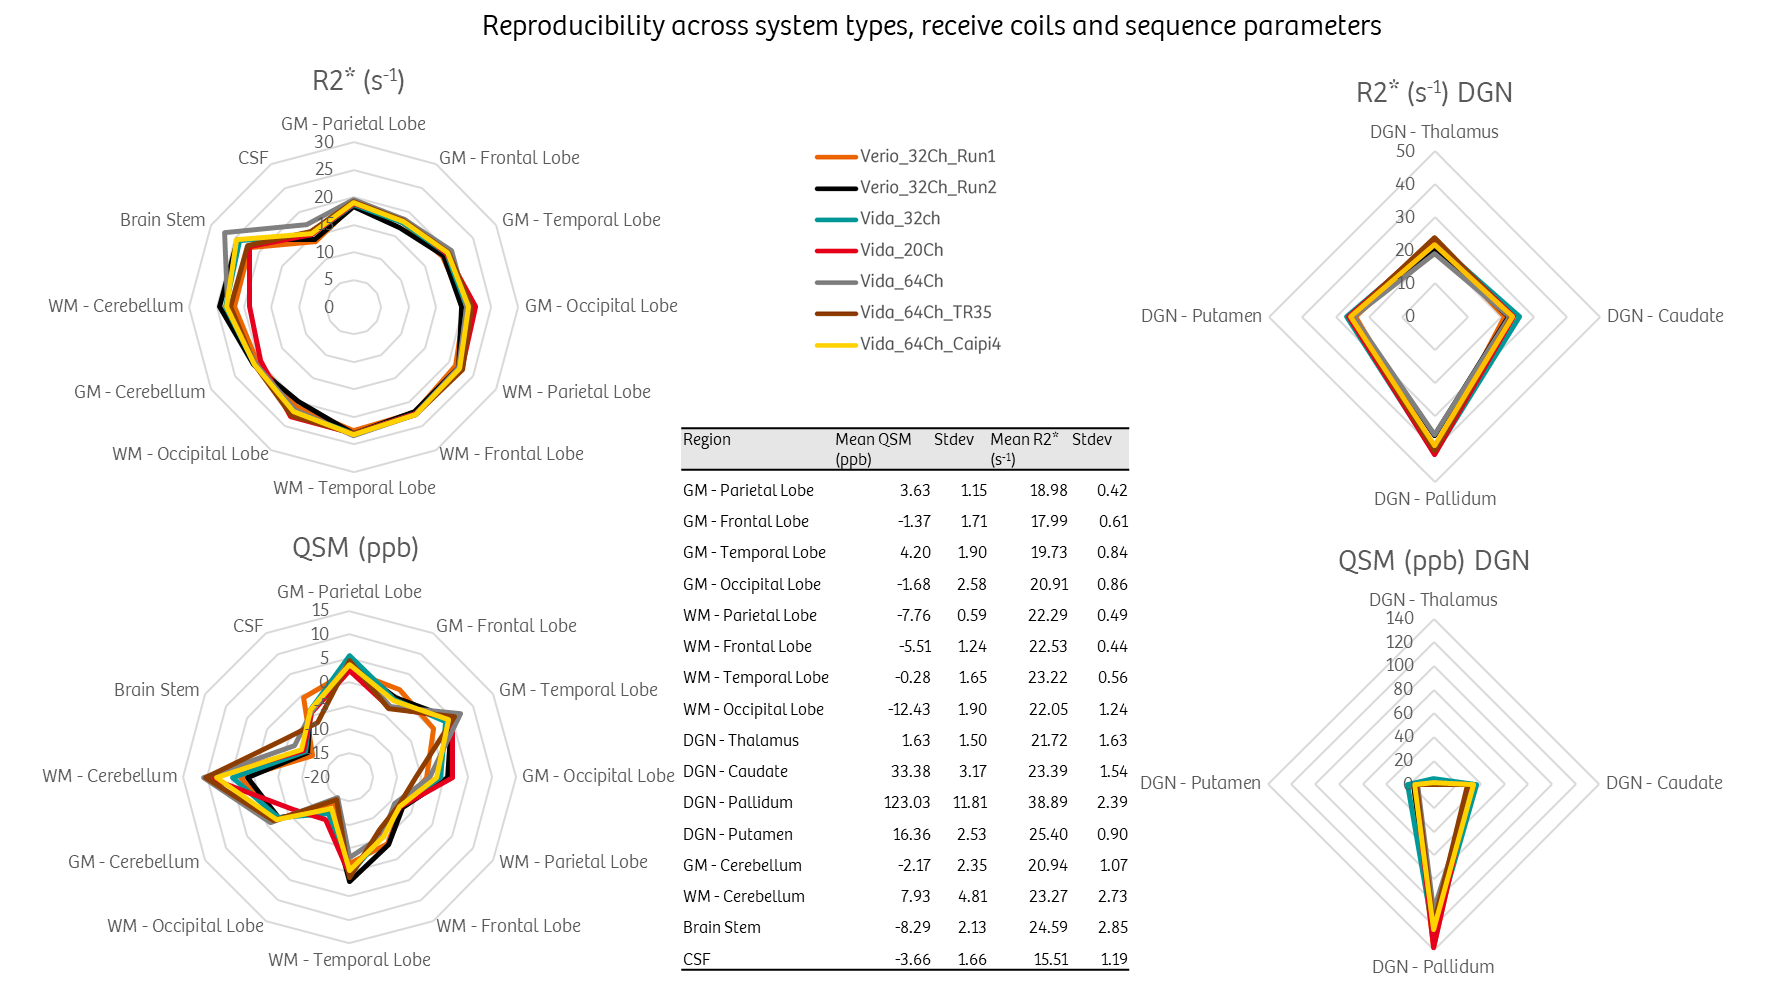
Figure 3 highlights the reproducibility of the measurement across scanners, coils and sequence parameters. Apart from deep grey nuclei that are known to be heterogenous, the highest variations were found in the brain stem for R2* and between grey and white matters in the cerebellum for QSM.
Discussion
Extracted R2* and QSM values for the region of interest analysis are all in agreement between protocols and no difference could be observed.As compared to the initial protocol optimized for Verio systems, we could reduce scan time below 5 minutes for a full brain 1-mm isotropic coverage with a 64-channel coil, by shortening TR, and by using standard parallel imaging strategies. Although the multi-GRE sequence could be further accelerated by using compressed-sensing k-space trajectories and associated reconstructions algorithms, here the data acquisition needed for QSM is using product sequences that are available in standard clinical environments.
In the most recent system (Vida), we did not notice coil combination issues in the phase image generation suggesting that it is handled correctly using the default reconstruction program implemented by the manufacturer. Using a different coil setup did not affect the standard error of mean in the various regions suggesting that the variation might come from other sources (e.g. intrinsic error propagation in the R2* fitting and QSM inverse problem, or reproducibility of the segmentation).
We demonstrate insignificant temporal evolution in a volunteer for a period of more than three years, and yet on two different 3T systems providing confidence that on-going longitudinal clinical studies involving R2*/QSM can safely rely on these quantitative biomarkers. We have introduced here an analysis pipeline based on automatic brain region segmentation useful for quality analysis of acquisitions and QSM reconstruction pipelines, for protocol optimization and as an automatic diagnostic assistance tool for R2*/QSM.
Conclusion
This work demonstrates that the contrast mechanism in multi-GRE sequences is well preserved upon hardware equipment of the same manufacturer and that joint R2* and QSM measurement time can be reduced by a factor of two while preserving quantitative information using modern MR scanner with high-performance gradient and high-density receive coils. This may facilitate clinical implementation of R2* and QSM quantitative biomarkers protocols for brain characterization.Acknowledgements
France Life Imaging, grant ANR-11-INBS-0006.References
[1] L. de Rochefort et al., « Quantitative susceptibility map reconstruction from MR phase data using bayesian regularization: validation and application to brain imaging », Magn. Reson. Med., vol. 63, no 1, p. 194‑206, janv. 2010, doi: 10.1002/mrm.22187.
[2] Y. Wang et al., « Clinical quantitative susceptibility mapping (QSM): Biometal imaging and its emerging roles in patient care », J. Magn. Reson. Imaging JMRI, vol. 46, no 4, p. 951‑971, 2017, doi: 10.1002/jmri.25693.
[3] S. Ropele et C. Langkammer, « Iron quantification with susceptibility », NMR Biomed., vol. 30, no 4, avr. 2017, doi: 10.1002/nbm.3534.
[4] S. K. Bandt et al., « Clinical Integration of Quantitative Susceptibility Mapping Magnetic Resonance Imaging into Neurosurgical Practice », World Neurosurg., vol. 122, p. e10‑e19, févr. 2019, doi: 10.1016/j.wneu.2018.08.213.
[5] C. Langkammer et al., « Quantitative Susceptibility Mapping in Parkinson’s Disease », PloS One, vol. 11, no 9, p. e0162460, 2016, doi: 10.1371/journal.pone.0162460.
[6] H.-G. Kim et al., « Quantitative susceptibility mapping to evaluate the early stage of Alzheimer’s disease », NeuroImage Clin., vol. 16, p. 429‑438, 2017, doi: 10.1016/j.nicl.2017.08.019.
[7] M. D. Santin et al., « Reproducibility of R2 * and quantitative susceptibility mapping (QSM) reconstruction methods in the basal ganglia of healthy subjects », NMR Biomed., vol. 30, no 4, avr. 2017, doi: 10.1002/nbm.3491.
[8] A. Burgetova et al., « Thalamic Iron Differentiates Primary-Progressive and Relapsing-Remitting Multiple Sclerosis », AJNR Am. J. Neuroradiol., vol. 38, no 6, p. 1079‑1086, juin 2017, doi: 10.3174/ajnr.A5166.
[9] S. Ayton et al., « Cerebral quantitative susceptibility mapping predicts amyloid-β-related cognitive decline », Brain J. Neurol., vol. 140, no 8, p. 2112‑2119, août 2017, doi: 10.1093/brain/awx137.
[10] J. O’Callaghan et al., « Tissue magnetic susceptibility mapping as a marker of tau pathology in Alzheimer’s disease », NeuroImage, vol. 159, p. 334‑345, oct. 2017, doi: 10.1016/j.neuroimage.2017.08.003.
[11] R. Cortese et al., « Value of the central vein sign at 3T to differentiate MS from seropositive NMOSD », Neurology, mars 2018, doi: 10.1212/WNL.0000000000005256.
[12] N. Homayoon et al., « Nigral iron deposition in common tremor disorders », Mov. Disord. Off. J. Mov. Disord. Soc., vol. 34, no 1, p. 129‑132, 2019, doi: 10.1002/mds.27549.
[13] P. Maggi et al., « Paramagnetic Rim Lesions are Specific to Multiple Sclerosis: An International Multicenter 3T MRI Study », Ann. Neurol., vol. 88, no 5, p. 1034‑1042, 2020, doi: https://doi.org/10.1002/ana.25877.
[14] N. Pyatigorskaya et al., « Iron Imaging as a Diagnostic Tool for Parkinson’s Disease: A Systematic Review and Meta-Analysis », Front. Neurol., vol. 11, p. 366, 2020, doi: 10.3389/fneur.2020.00366.
[15] D. Gay et al., « A Standardised Clinical Multicentric Whole Brain T2* Mapping Protocol at 3T », ISMRM Singapore, 2016, p. 3305.
[16] L. de Rochefort et al., « Clinical brain QSM acquisition and automated processing at 3T and 7T for routine use », ESMRMB Barcelona, 2017, p. 446, [En ligne]. Disponible sur: https://hal.archives-ouvertes.fr/hal-02559487.
[17] P. Spincemaille et al., « Clinical Integration of Automated Processing for Brain Quantitative Susceptibility Mapping: Multi-Site Reproducibility and Single-Site Robustness », J. Neuroimaging Off. J. Am. Soc. Neuroimaging, vol. 29, no 6, p. 689‑698, 2019, doi: 10.1111/jon.12658.
[18] T. Liu et al., « Morphology enabled dipole inversion (MEDI) from a single-angle acquisition: comparison with COSMOS in human brain imaging », Magn. Reson. Med., vol. 66, no 3, p. 777‑783, sept. 2011, doi: 10.1002/mrm.22816.
[19] J. Liu et al., « Morphology enabled dipole inversion for quantitative susceptibility mapping using structural consistency between the magnitude image and the susceptibility map », NeuroImage, vol. 59, no 3, p. 2560‑2568, févr. 2012, doi: 10.1016/j.neuroimage.2011.08.082.
[20] V. Jellus et al., « Adaptive Coil Combination Using a Body Coil Scan as Phase Reference », ISMRM Milan, 2014, p. 4406.
[21] W. Li et al., « Differential Developmental Trajectories of Magnetic Susceptibility in Human Brain Gray and White Matter Over the Lifespan », Hum. Brain Mapp., vol. 35, p. 2698-2713, 2014, doi: 10.1002/hbm.22360
Figures