1306
Carbogen-based Cerebrovascular Reserve Using BOLD-based fMRI of Human Brain : tissue, territorial and cortical specificity1Department of Radiology, Taipei Veterans General Hospital, Taipei, Taiwan, 2Institue of Brain Science, National Yang-Ming University, Taipei, Taiwan, 3Department of Medical Research, Taipei Veterans General Hospital, Taipei, Taiwan
Synopsis
Carbogen-based cerebrovascular reserve (CO2-CVR), derived from 90 normal subjects, was constructed for data-based approaches or analysis. Tissue, territorial and cortical specificities of CO2-CVR were evaluated by regions of interest (ROI) approaches. Global ratio of GM/WM CO2-CVR was about 1.57. Territorial and cortical specificities of CO2-CVR demonstrated (1) limited CO2-CVR in territories of posterior circulation which supported the pathophysiology of posterior reversible encephalopathy syndrome and (2) vital function in distal territories of anterior cerebral artery as verified by cortical parcellation with the highest of CO2-CVR at ventral portion of Brodmann area 23 (co-localized with posterior cingulate cortices of default mode network).
Introduction
Carbogen-based cerebrovascular reserve (CO2-CVR), derived from 90 normal subjects, was constructed for data-based approaches or analysis. Tissue, territorial and cortical specificities of CO2-CVR were evaluated by regions of interest (ROI) approaches.Subjects and Methods
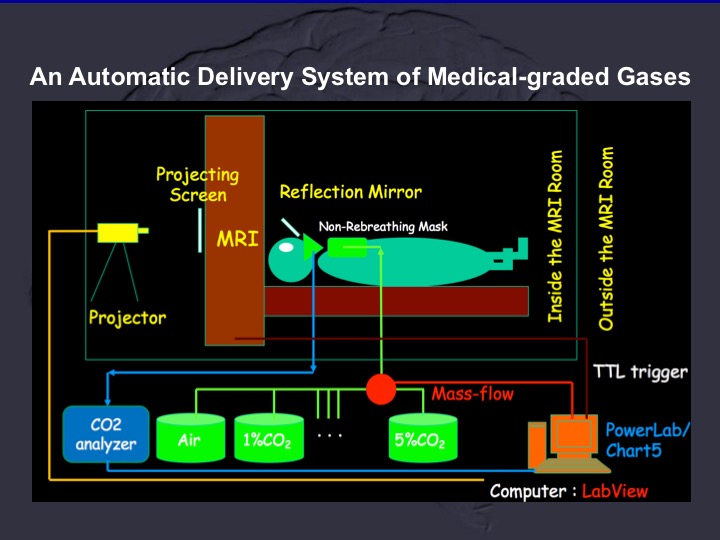
The custom-designed automatic delivery system of CO2-CVR (Figure 1) was constructed for inhalation of various medical-graded gas mixtures (1, 2, 3, 4 and 5% CO2 with 21% O2 and buffer gas of N2) and air (as control). The experiments were conducted in a medical center for clinical supervision with written/signed informed consents and the approval of institute review board. Whole-brain BOLD (blood oxygenation level dependence)-based echo planar images of normal subjects (n=90, age=20-33 years old, 46 males), TE/TR=30/2000 milliseconds, NR=360 and voxel size as 3.6x3.6x4 mm, was performed using a 3T MR system (Discovery MR750, GE, Healthcare, IL, USA) with recordings of end-tidal CO2 (etCO2, ADInstruments, CO, USA) and gas inhalation using a non-rebreathing mask. Realtime monitoring of head motion (less than 1 mm and 1 degree for translation and rotation, respectively) and BOLD response to hypercapnia (Brainwave, Discovery MR750) were applied for justification of study quality. Informax independent component analysis (ICA, GroupICATv4.0c, Center for Translational Research in Neuroimaging and Data Science, Georgia State University, GA, USA) was applied to obtain the CRF (carbogen response function) after standard preprocessing data by SPM12 (The Wellcome Centre for Human Neuroimaging, UCL Queen Square Institute of Neurology, London, UK). Linear regression with the recorded etCO2 was applied to select the independent components derived from ICA, correlation coefficients (CC) > 0.3. And CRF was calculated by summation using weighting of CC for each selected components. The CRF and regressors of head motion were utilized for modeling CO2-CVR of whole brain by one-sample t-test. Tissue specificity of CO2-CVR was addressed by the tissue segmentation of T1-weighted images (0.9 mm isotropic spatial resolution) using SPM12 [batch/SPM/spatial/segment; with top 30% probability of tissue classification of gray matter (GM) or white matter (WM) as ROIs]. Territorial specificities of CO2-CVR was evaluated by nine ROIs, three ROIs as proximal, middle and distal ROIs for ACA (anterior cerebral artery, divisions 1-3), MCA (middle cerebral artery, divisions 4-6) and PCA (posterior cerebral artery, divisions 7-9), respectively, derived from maps of arterial transit time (https://figshare.com/articles/ATT_based_flow_territories/1488674). Cortical specificities of CO2-CVR was estimated using cortical paracellation of the multimodal approach by HCP (180 ROIs for each cerebral hemispheres, https://figshare.com/articles/HCP_MMP1_0_projected_on_MNI2009a_GM_volumetric_in_NIfTI_format/3501911). Grouped analyses using two-sample t test were performed among data of ROIs.Results
Tissue specificity:As compared with the CO2-CVR of WM, GM had higher CO2-CVR (uncorrected p=1.2x10⁻²¹) with 3:2 ratio for CO2-CVR of GM vs. CO2-CVR of WM. No gender difference of CO2-CVR was found within tissue categories.
Territorial specificity:Territorial difference of CO2-CVR showed extraordinarily low CO2-CVR in PCA [uncorrected p down to 7.9x10⁻¹⁹ at distal third PCA (division 9)] when division 3 (distal third portion of ACA) had the globally highest CO2-CVR (averaged t values = 13.9 +/- 3.7; average +/- one standard deviation for one-sample t-test using CRF).
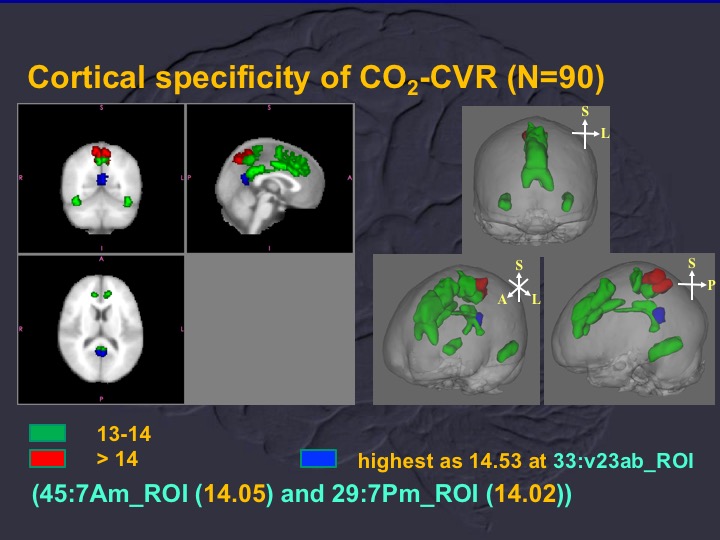
Cortical specificity:
Analyses of cortical parcellation showed the highest of CO2-CVR at v23ab (t value = 14.53 at ventral portion of Brodmann area 23, Figure 2) with spatial distribution of higher CO2-CVR (t values > 13) consistent with default mode network (DMN).
Conclusion and Discussion
Ratio of global CO2-CVR for GM/WM was about 1.57, which was consistent with 1.73 measured by recent hypercapnia BOLD study [1]. Territorial and cortical specificities of CO2-CVR suggested (1) limited CO2-CVR in territories of posterior circulation which supported the pathophysiology of posterior reversible encephalopathy syndrome [2] and (2) vital function in distal territories of ACA as verified by cortical parcellation showing the highest of CO2-CVR at v23ab (ventral portion of Brodmann area 23) which is colocalized with posterior cingulate cortices of DMN.Acknowledgements
Authors appreciate the grant supports from MOST, NHRI and Taipei VGH of Republic of China (Taiwan).References
1. Taneja et al, Front. Neurol., 31 July 2020, https://doi.org/10.3389/fneur.2020.007582.
2. Anderson et al, Front. Neurol., 16 June 2020, https://doi.org/10.3389/fneur.2020.00463
Figures