1305
Quantitative cerebral oxygenation mapping by MRI with whole brain coverage compared to PET1Department of Neuroradiology, School of Medicine, Technical University of Munich (TUM), Munich, Germany, 2Department of Neurology, School of Medicine, Technical University of Munich (TUM), Munich, Germany, 3Department of Radiology & Biomedical Imaging (MRRC), Yale University, New Haven, CT, United States, 4Philips Healthcare, Hamburg, Germany, 5Department of Clinical Medicine, Aarhus University, Aarhus, Denmark
Synopsis
Clinical imaging of the oxygen extraction fraction (OEF) is highly promising to improve stratification of patients with various neurological diseases. Measurement of OEF by multiparametric quantitative blood oxygen level dependent (mqBOLD)-MRI could greatly increase clinical applicability compared to the current gold standard PET. Furthermore, oxygen extraction capacity (OEC) has recently emerged as another MRI-based biomarker of cerebral oxygenation. However, studies comparing both MRI techniques to PET reference data are still lacking. Here, we present data from an MRI study in young healthy volunteers, demonstrating good agreement of both, MRI-based OEF and OEC, with PET data from a similar subject group.
Purpose
The oxygen extraction fraction (OEF) is an important biomarker of cerebral oxygen metabolism. Quantitative OEF mapping is of high clinical interest, as increases have been associated with more malignant disease states of several neurological conditions.1,2 While 15O-positron emission tomography (PET) is considered to be the gold standard, its applicability is restricted by radioactive tracers, required onsite cyclotron and arterial blood sampling.3To enable widespread OEF imaging, various MRI techniques have been proposed in recent years and especially two methods with whole brain coverage seem promising. First, the multiparametric quantitative blood oxygen level dependent (mqBOLD) approach4-6 derives OEF maps based on an analytical model7 with three separate measurements of relative cerebral blood volume (rCBV), as well as quantitative T2* and T2.4,8 To resolve previous systematic OEF overestimations,9,10 improved T2 mapping has been recently proposed.6 Second, a vascular model considering the heterogeneity of capillary flow patterns has been recently proposed to map the maximum OEF, i.e. oxygen extraction capacity (OEC), based on dynamic susceptibility contrast (DSC)-MRI.11,12 While both methods showed promising first results,1,9,10,13-17 neither of them is routinely clinically applied and comparisons with PET are lacking.
The aim of our study was therefore to compare mqBOLD-OEF and DSC-OEC in young healthy participants with previously published PET-OEF reference data.18
Methods
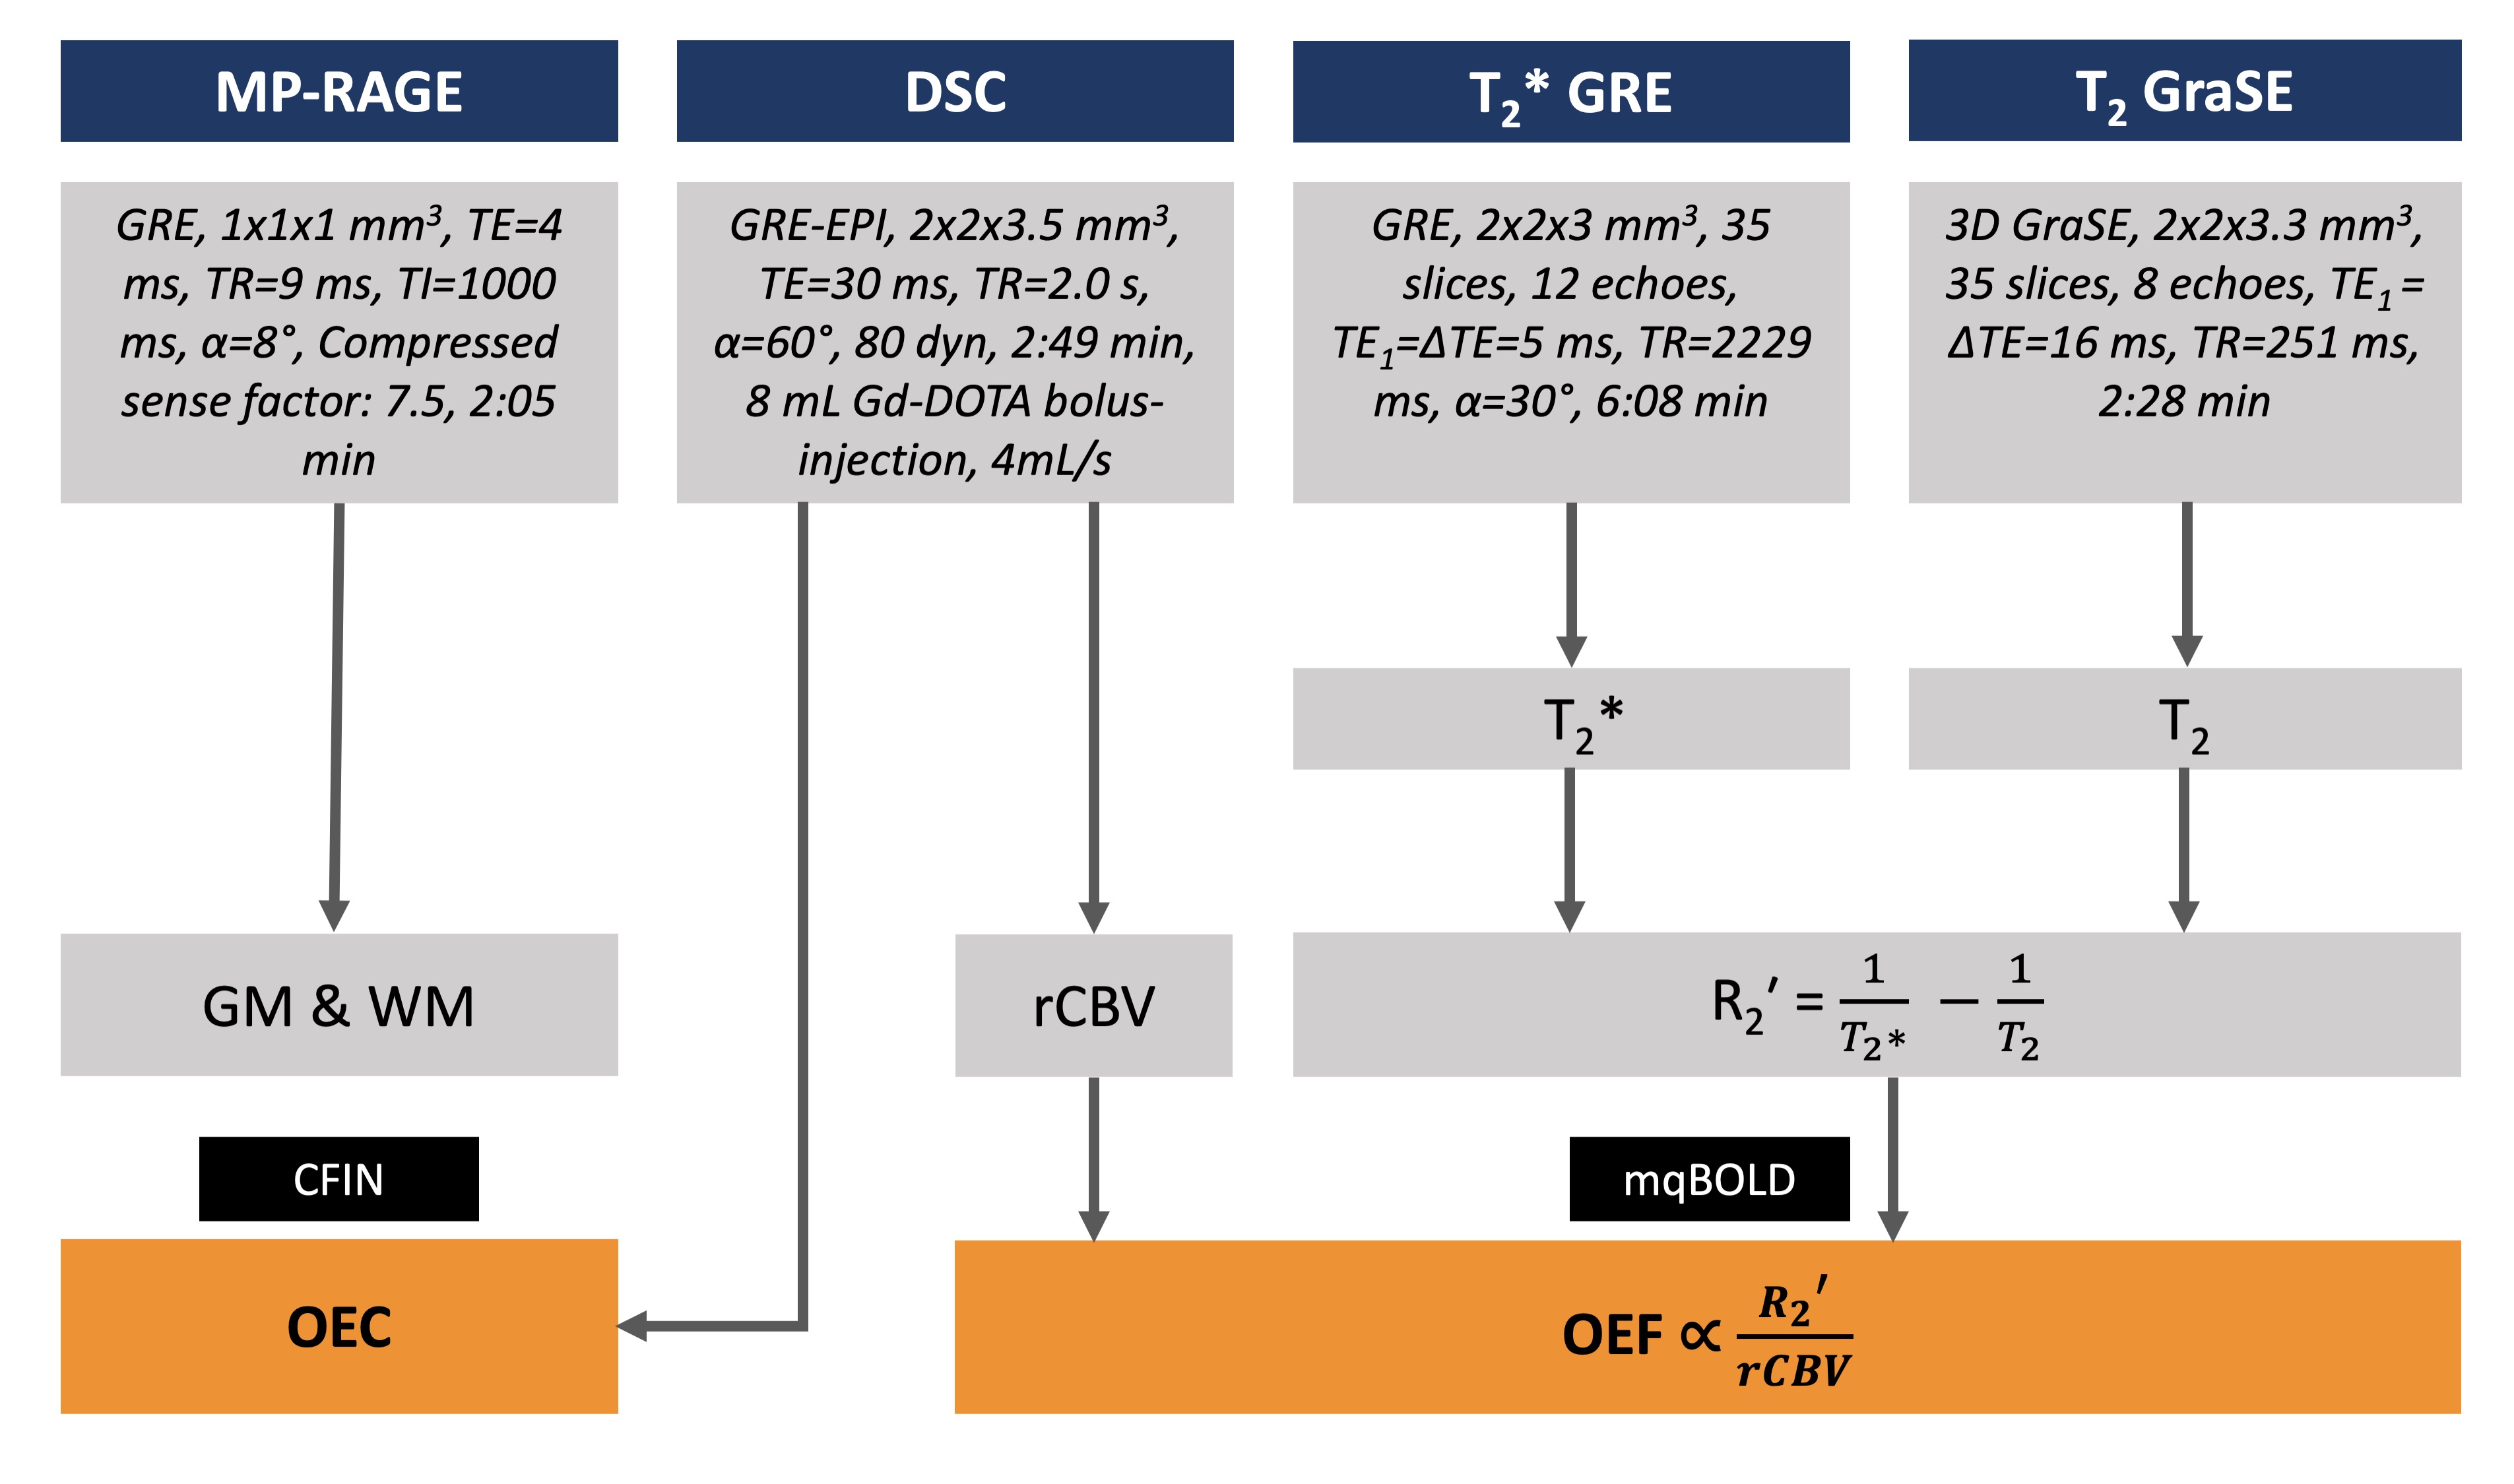
In this prospective study, 12 healthy young volunteers (age=29.0±5.3y, 6 males) underwent MRI on a 3T Ingenia Elition (Philips, Best, The Netherlands) with a 32-channel head-coil. The imaging protocol is summarized in Figure 1. According to the mqBOLD approach,4,6 mqBOLD-OEF was calculated as$$ OEF = \frac{R_{2}’}{c \cdot rCBV} $$
with c=316.8 s-1 at 3T4 and the transverse relaxation rate
$$ R_{2}' = \frac{1}{T_{2}^*}-\frac{1}{T_{2}} $$
Voxels with R2' > 10 1/s or OEF > 1 were excluded to account for susceptibility artifacts and OEF elevations.6
OEC maps were derived from DSC data using the distribution of capillary transit times12 obtained by parametric deconvolution of the tissue contrast agent curve according to the CFIN approach.11
For comparisons, existing 15O-H2O-CBF and 15O-O2-CMRO2 PET data from a previous study18 was used to calculate PET-OEF. This data was acquired in a different, but similar cohort of 13 male subjects (age=26.1±3.8y).
All imaging data was MNI-normalized for group-level comparisons of all three modalities using custom-built MATLAB programs (Mathworks, Natick, USA). Comparisons were based on Pearson correlation across Brodmann areas (BA) and Bland-Altman plots.
Results
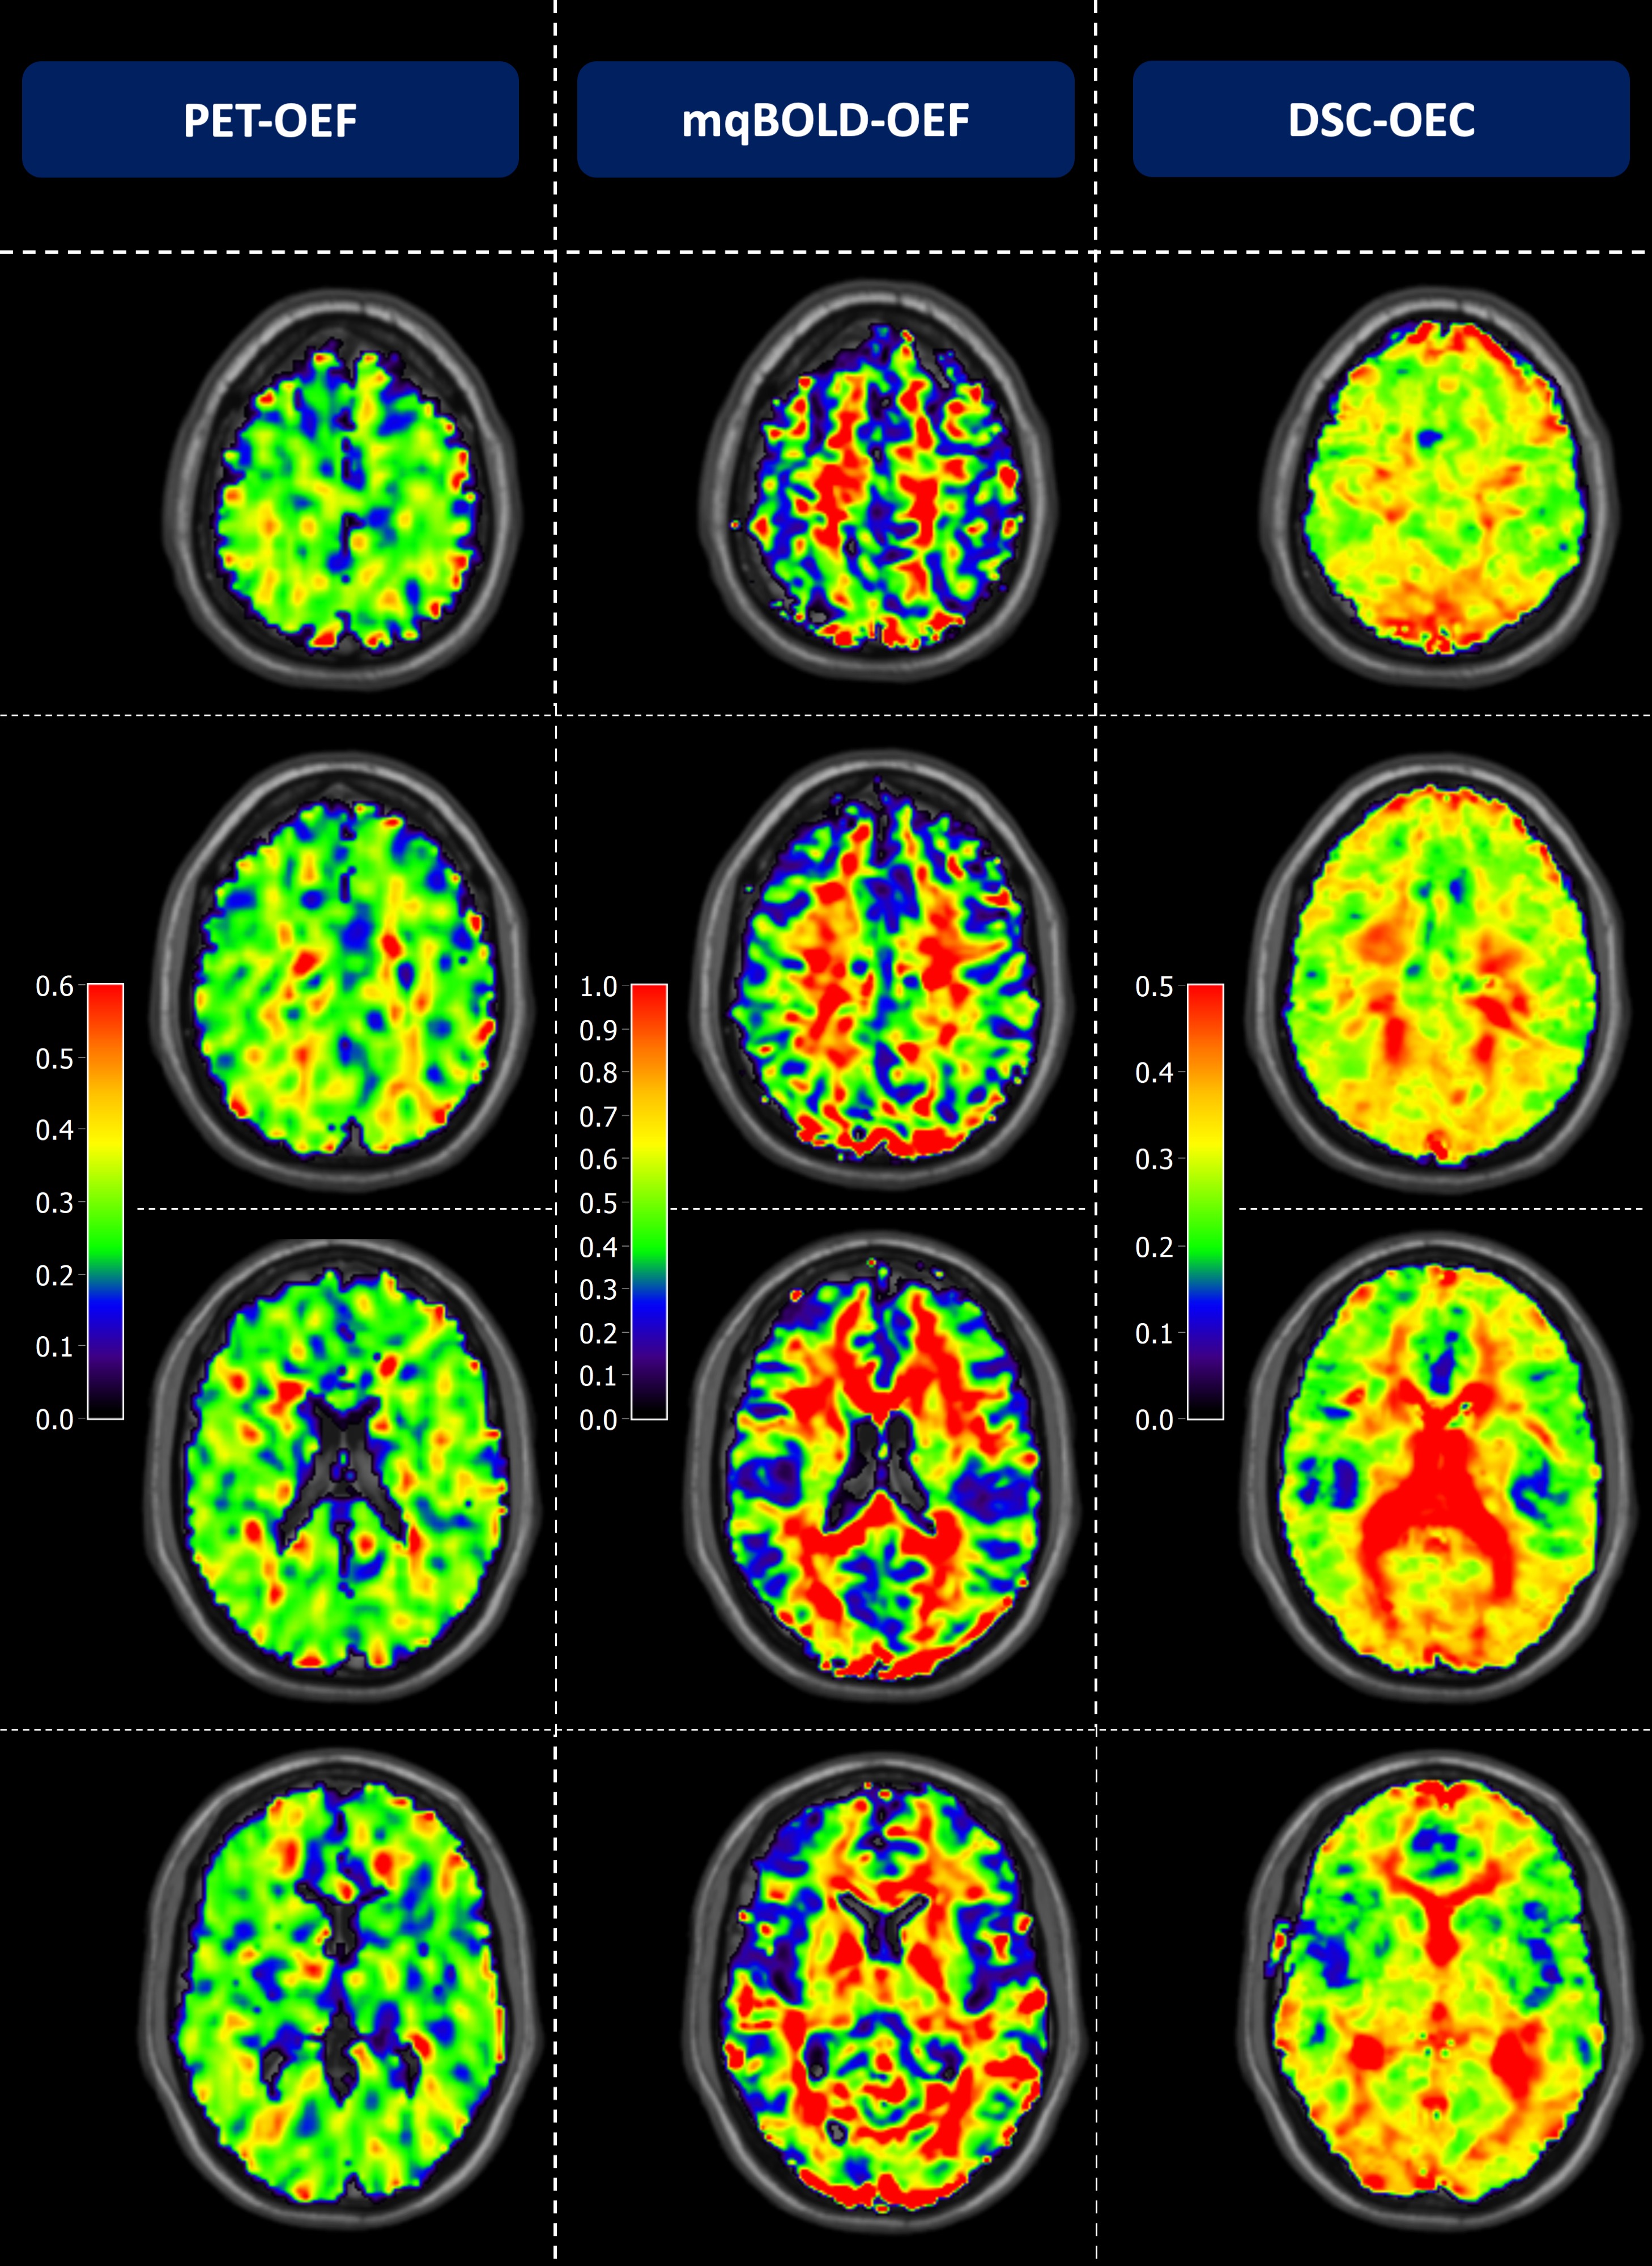
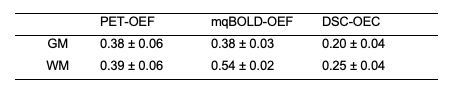
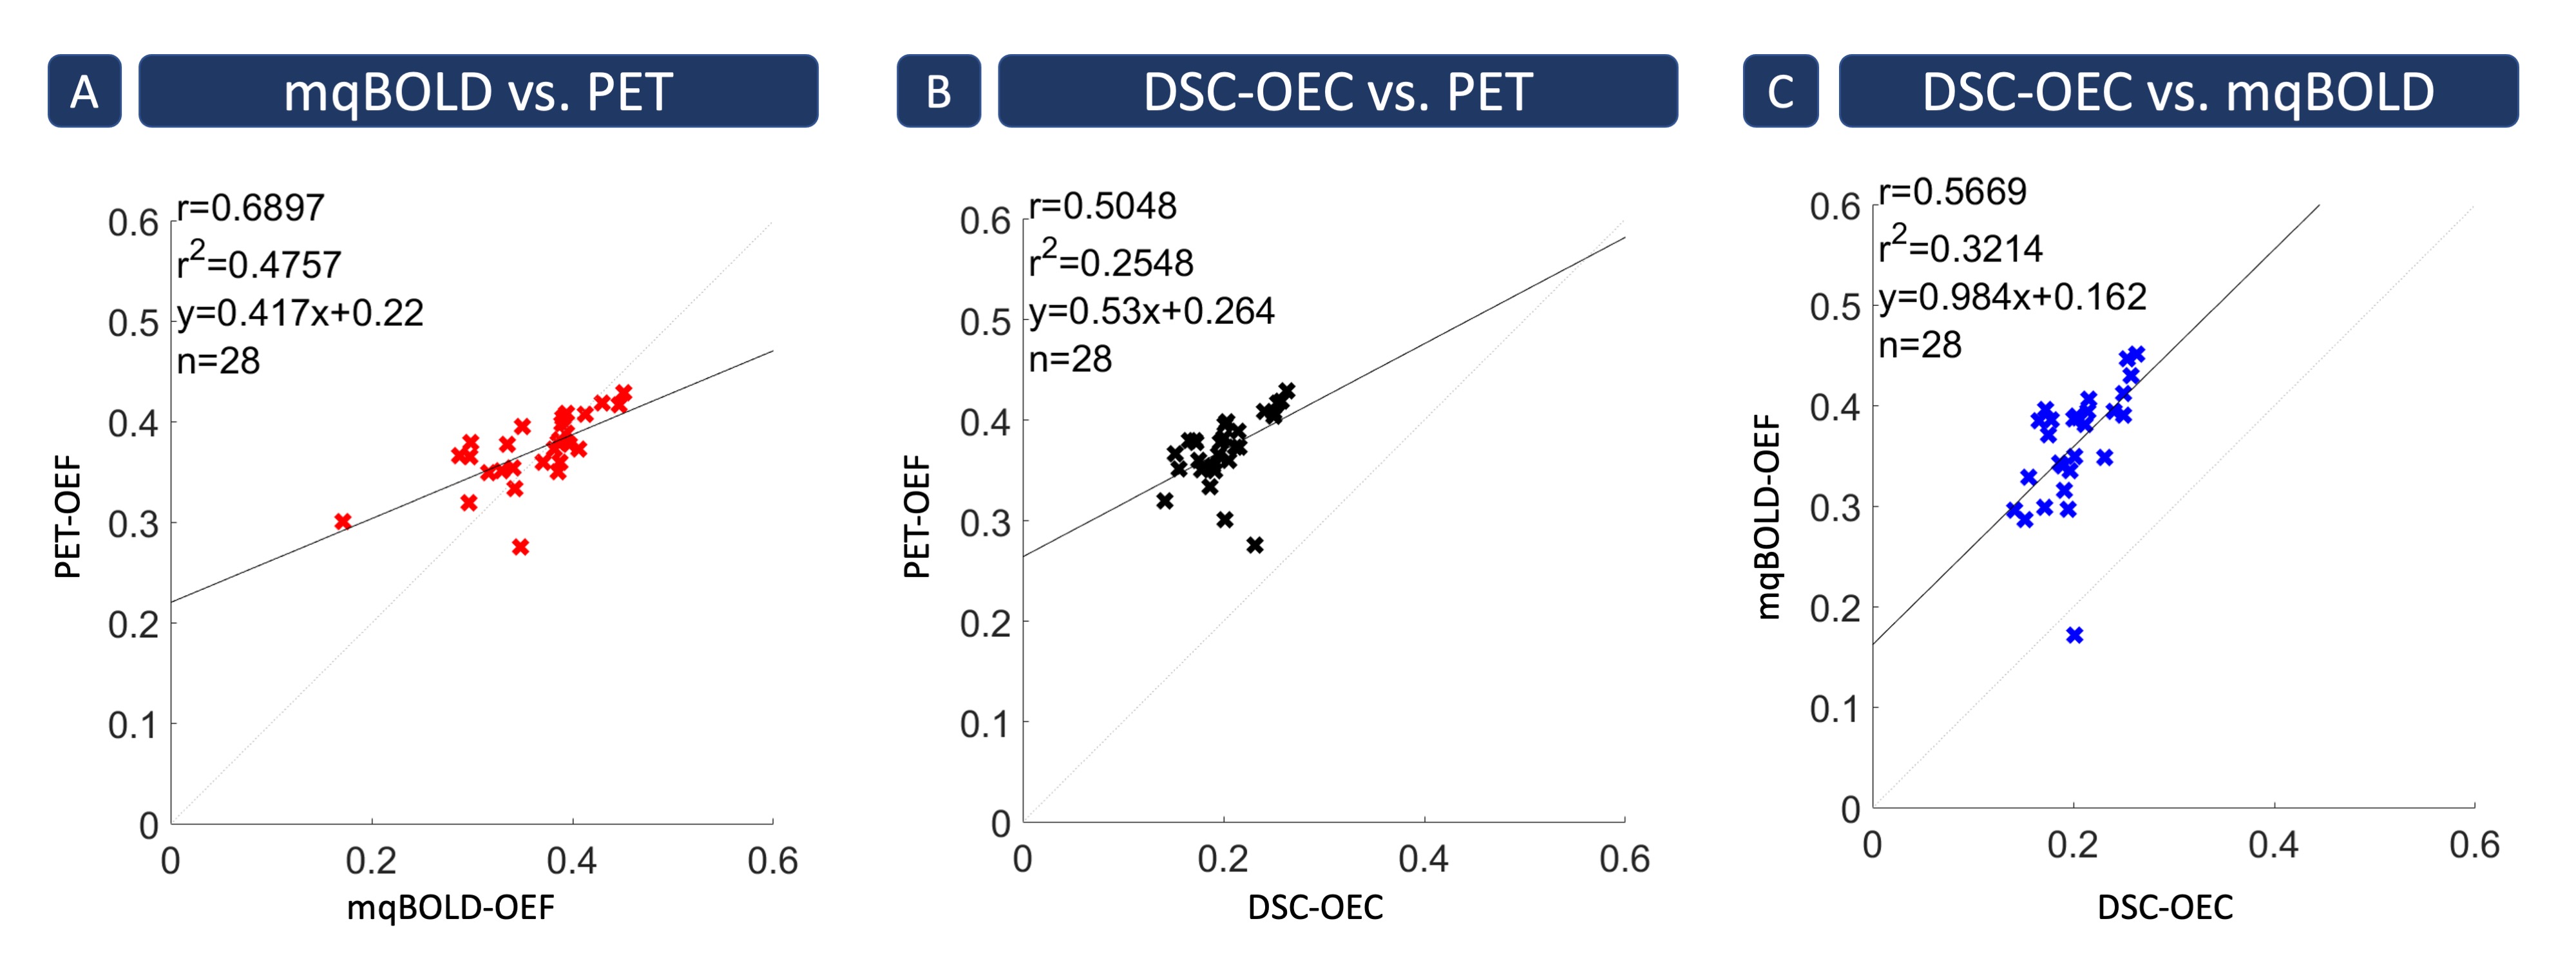
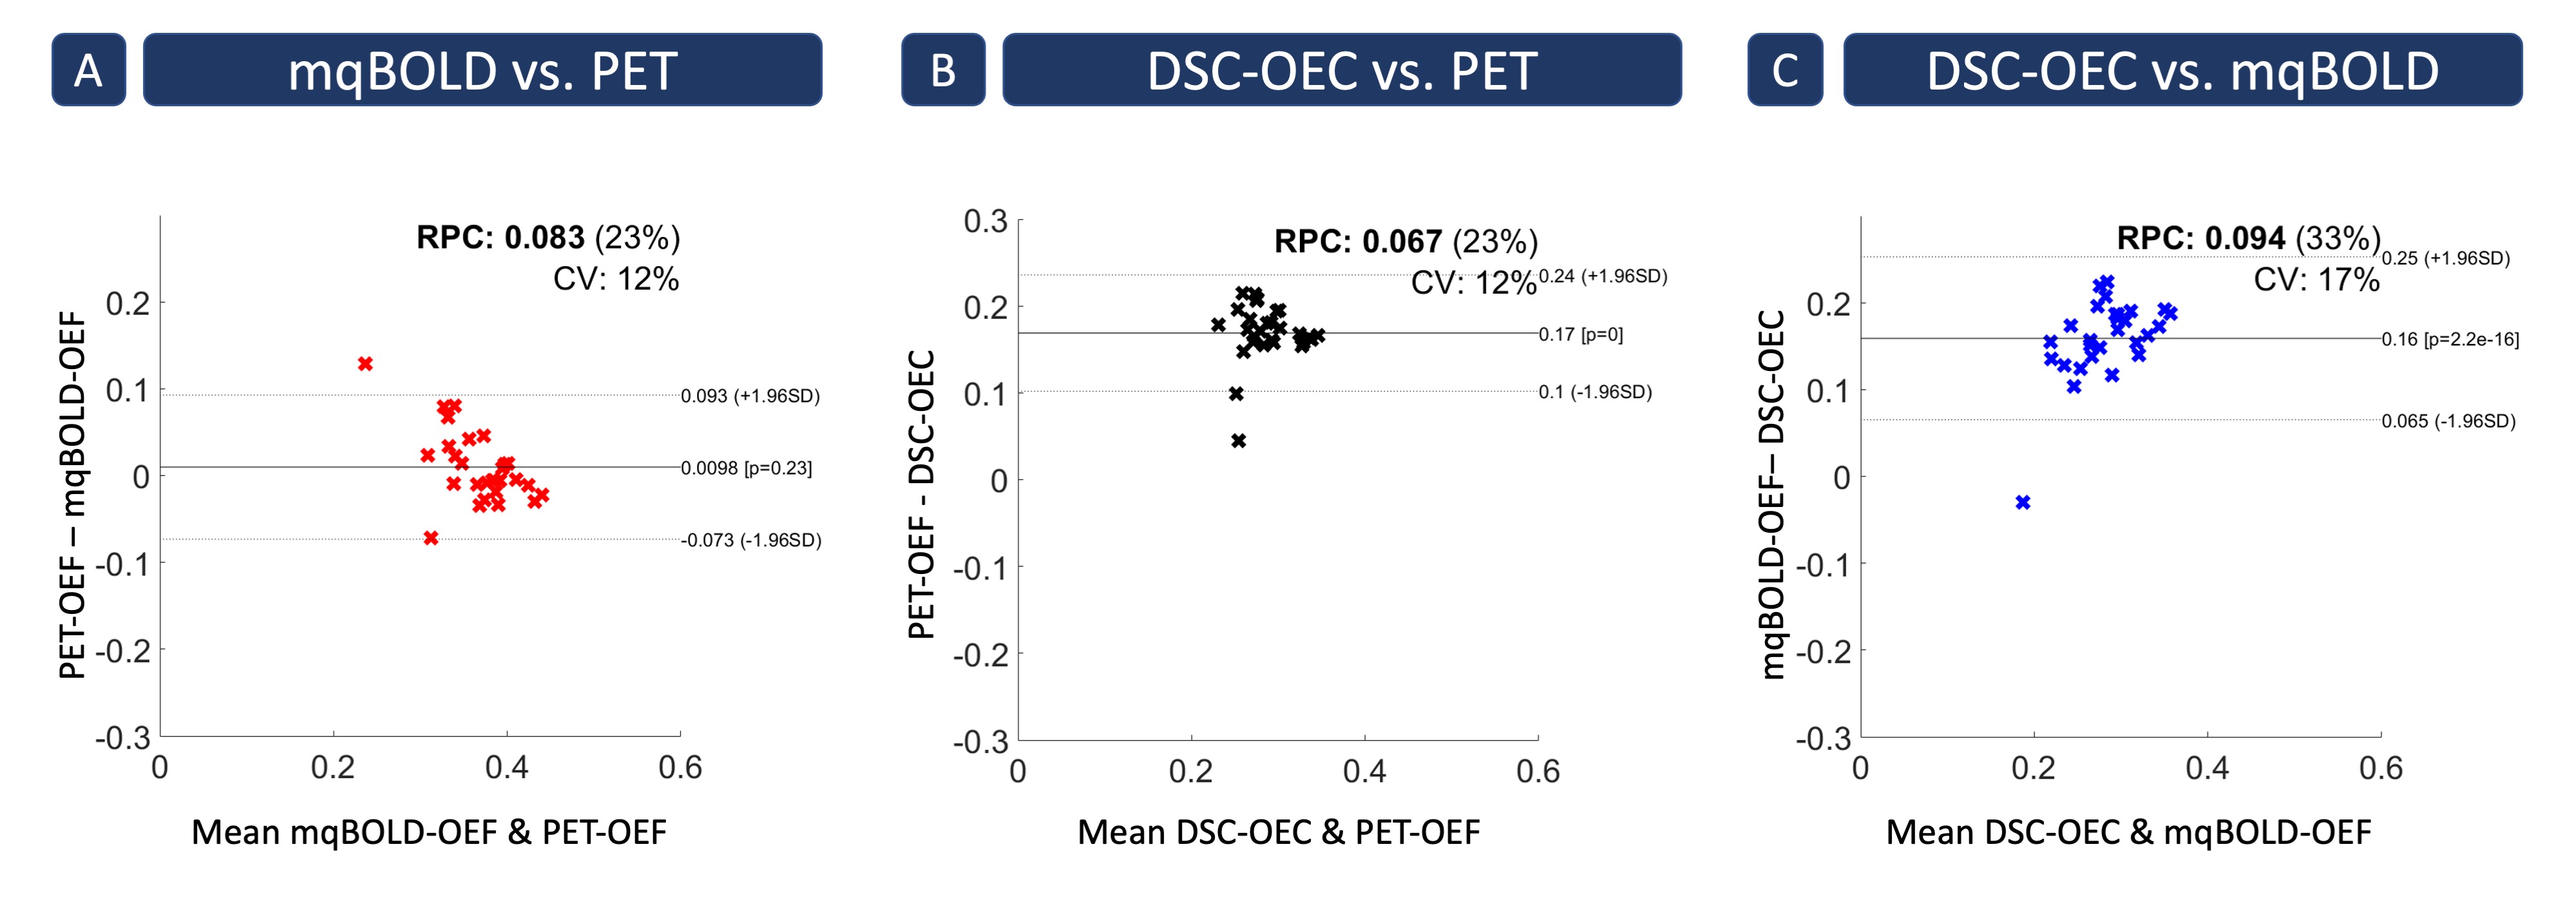
Exemplary data is shown in Figure 2. PET-OEF appears very homogeneous across the entire brain in GM and WM. While mqBOLD-OEF values were similar in GM, values in WM were higher. A similar artifactual GM/WM contrast was observed in DSC-OEC maps, but with generally lower values across the entire brain.These visual impressions were affirmed by group-level evaluations (Tab.1), where particularly mqBOLD-OEF in GM is in excellent agreement with PET. In addition, mqBOLD-OEF (Fig.3A) and DSC-OEC (Fig.3B) both showed high correlation with PET-OEF (r=0.69 and r=0.50, p<0.05, respectively) and among each other (r=0.57, p<0.05; Fig.3C). Bland-Altman plots affirmed the good quantitative correspondence of mqBOLD-OEF compared with PET, indicating no significant difference (p=0.23; Fig.4A). Absolute DSC-OEC, on the other hand, was significantly lower (p<0.05; Fig.4B, C).
Discussion
In the present study, we demonstrated good correlation of cerebral oxygenation mapping in GM by two MRI-based methods compared to PET. High correlation between OEF from mqBOLD and PET was found, and quantitative values were in excellent agreement. This is in accordance with literature reports, where mqBOLD-OEF was in similarly good agreement with sagittal sinus oxygenation in rodents.19 Our findings affirmed the previously proposed improvements of the mqBOLD implementation by 3D GraSE T2 mapping.6 However, the artificial GM/WM contrast remains challenging and requires separate evaluations in GM and WM.Lower, but nevertheless good spatial correlation with PET-OEF was found for DSC-OEC, in agreement with published results in two subjects with carotid artery occlusion.20 This finding points to differences between OEC and OEF. These differences could be explained by additional factors acting on capillary oxygen diffusivity, such as hematocrit and intracapillary erythrocyte stacking,21 which are not considered in the vascular CFIN model. Furthermore, OEC yielded systematically lower values than both PET- and mqBOLD-OEF, which has not been observed in previous studies.6, 20 This might be related to the reduced contrast agent dose we applied as a consequence of the ongoing debate about Gadolinium accumulations.22 However, as rCBV from the same DSC data was reliable,23 further investigation is required.
Regarding interpretations of the reported correlations between MRI and PET data in two different cohorts, inter-subject OEF variations should be considered.3 While non-simultaneous data acquisition effects on OEF comparisons are unclear, substantial effects for CBF have been reported24 and potentially apply also to our comparisons.25 To resolve remaining uncertainties, future simultaneous PET/MR acquisitions could greatly advance the field of cerebral oxygenation mapping.25
Conclusion
We successfully evaluated MRI-based cerebral oxygen extraction mapping by mqBOLD and DSC. Derived OEF and OEC maps correlated well with PET reference data in young healthy participants. Particularly, high agreement of mqBOLD with PET was found in GM. Future comparisons in patient studies are highly demanded to further evaluate the potential of MRI-based oxygenation mapping in a clinical setting.Acknowledgements
The authors highly appreciate the support of Valentin Riedl (TUM) in the acquisition of MRI data. We acknowledge support by the Else-Kröner-Fresenius-Stiftung (JK), Friedrich-Ebert-Stiftung (SK), Dr.-Ing. Leonhard-Lorenz-Stiftung (grant SK 971/19) and the German Research Foundation (DFG, grant PR 1039/6-1).References
1. Toth V, Forschler A, Hirsch NM, et al. MR-based hypoxia measures in human glioma. J Neurooncol 2013; 115: 197-207. 2013/08/07. DOI: 10.1007/s11060-013-1210-7.
2. Hino A, Tenjin H, Horikawa Y, et al. Hemodynamic and metabolic changes after carotid endarterectomy in patients with high-degree carotid artery stenosis. J Stroke Cerebrovasc Dis 2005; 14: 234-238. 2007/10/02. DOI: 10.1016/j.jstrokecerebrovasdis.2005.08.001.
3. Jiang D, Lin Z, Liu P, et al. Normal variations in brain oxygen extraction fraction are partly attributed to differences in end-tidal CO2. J Cereb Blood Flow Metab 2020; 40: 1492-1500. 2019/08/07. DOI: 10.1177/0271678X19867154.
4. Hirsch NM, Toth V, Forschler A, et al. Technical considerations on the validity of blood oxygenation level-dependent-based MR assessment of vascular deoxygenation. NMR Biomed 2014; 27: 853-862. 2014/05/09. DOI: 10.1002/nbm.3131.
5. Christen T, Schmiedeskamp H, Straka M, et al. Measuring brain oxygenation in humans using a multiparametric quantitative blood oxygenation level dependent MRI approach. Magn Reson Med 2012; 68: 905-911. 2011/12/14. DOI: 10.1002/mrm.23283.
6. Kaczmarz S, Hyder F and Preibisch C. Oxygen extraction fraction mapping with multi-parametric quantitative BOLD MRI: Reduced transverse relaxation bias using 3D-GraSE imaging. Neuroimage 2020; 220: 117095. 2020/07/01. DOI: 10.1016/j.neuroimage.2020.117095.
7. Yablonskiy DA and Haacke EM. Theory of NMR signal behavior in magnetically inhomogeneous tissues: The static dephasing regime. Magnetic Resonance in Medicine 1994; 32: 749-763. DOI: https://doi.org/10.1002/mrm.1910320610.
8. Hirsch NM and Preibisch C. T2* mapping with background gradient correction using different excitation pulse shapes. AJNR Am J Neuroradiol 2013; 34: E65-68. 2012/07/28. DOI: 10.3174/ajnr.A3021.
9. Gottler J, Kaczmarz S, Kallmayer M, et al. Flow-metabolism uncoupling in patients with asymptomatic unilateral carotid artery stenosis assessed by multi-modal magnetic resonance imaging. J Cereb Blood Flow Metab 2019; 39: 2132-2143. 2018/07/04. DOI: 10.1177/0271678X18783369.
10. Kaczmarz S, Gottler J, Petr J, et al. Hemodynamic impairments within individual watershed areas in asymptomatic carotid artery stenosis by multimodal MRI. J Cereb Blood Flow Metab 2020: 271678X20912364. 2020/04/03. DOI: 10.1177/0271678X20912364.
11. Mouridsen K, Hansen MB, Ostergaard L, et al. Reliable estimation of capillary transit time distributions using DSC-MRI. J Cereb Blood Flow Metab 2014; 34: 1511-1521. 2014/06/19. DOI: 10.1038/jcbfm.2014.111.
12. Jespersen SN and Ostergaard L. The roles of cerebral blood flow, capillary transit time heterogeneity, and oxygen tension in brain oxygenation and metabolism. J Cereb Blood Flow Metab 2012; 32: 264-277. 2011/11/03. DOI: 10.1038/jcbfm.2011.153.
13. Eskildsen SF, Gyldensted L, Nagenthiraja K, et al. Increased cortical capillary transit time heterogeneity in Alzheimer's disease: a DSC-MRI perfusion study. Neurobiol Aging 2017; 50: 107-118. 2016/12/13. DOI: 10.1016/j.neurobiolaging.2016.11.004.
14. Preibisch C, Shi K, Kluge A, et al. Characterizing hypoxia in human glioma: A simultaneous multimodal MRI and PET study. NMR Biomed 2017; 30 2017/08/15. DOI: 10.1002/nbm.3775.
15. Stadlbauer A, Mouridsen K, Doerfler A, et al. Recurrence of glioblastoma is associated with elevated microvascular transit time heterogeneity and increased hypoxia. J Cereb Blood Flow Metab 2018; 38: 422-432. 2017/03/10. DOI: 10.1177/0271678X17694905.
16. Stadlbauer A, Oberndorfer S, Zimmermann M, et al. Physiologic MR imaging of the tumor microenvironment revealed switching of metabolic phenotype upon recurrence of glioblastoma in humans. J Cereb Blood Flow Metab 2020; 40: 528-538. 2019/02/09. DOI: 10.1177/0271678X19827885.
17. Stadlbauer A, Zimmermann M, Doerfler A, et al. Intratumoral heterogeneity of oxygen metabolism and neovascularization uncovers 2 survival-relevant subgroups of IDH1 wild-type glioblastoma. Neuro Oncol 2018; 20: 1536-1546. 2018/05/03. DOI: 10.1093/neuonc/noy066.
18. Hyder F, Herman P, Bailey CJ, et al. Uniform distributions of glucose oxidation and oxygen extraction in gray matter of normal human brain: No evidence of regional differences of aerobic glycolysis. J Cereb Blood Flow Metab 2016; 36: 903-916. 2016/01/13. DOI: 10.1177/0271678x15625349.
19. Christen T, Lemasson B, Pannetier N, et al. Evaluation of a quantitative blood oxygenation level-dependent (qBOLD) approach to map local blood oxygen saturation. NMR Biomed 2011; 24: 393-403. 2010/10/21. DOI: 10.1002/nbm.1603.
20. Ostergaard L, Jespersen SN, Engedahl T, et al. Capillary dysfunction: its detection and causative role in dementias and stroke. Curr Neurol Neurosci Rep 2015; 15: 37. 2015/05/10. DOI: 10.1007/s11910-015-0557-x.
21. Hyder F, Shulman RG and Rothman DL. A model for the regulation of cerebral oxygen delivery. Journal of Applied Physiology 1998; 85: 554-564. DOI: 10.1152/jappl.1998.85.2.554.
22. Kanda T, Fukusato T, Matsuda M, et al. Gadolinium-based Contrast Agent Accumulates in the Brain Even in Subjects without Severe Renal Dysfunction: Evaluation of Autopsy Brain Specimens with Inductively Coupled Plasma Mass Spectroscopy. Radiology 2015; 276: 228-232. 2015/05/06. DOI: 10.1148/radiol.2015142690.
23. Hedderich D, Kluge A, Pyka T, et al. Consistency of normalized cerebral blood volume values in glioblastoma using different leakage correction algorithms on dynamic susceptibility contrast magnetic resonance imaging data without and with preload. J Neuroradiol 2019; 46: 44-51. 2018/05/14. DOI: 10.1016/j.neurad.2018.04.006.
24. Fan AP, Jahanian H, Holdsworth SJ, et al. Comparison of cerebral blood flow measurement with [15O]-water positron emission tomography and arterial spin labeling magnetic resonance imaging: A systematic review. J Cereb Blood Flow Metab 2016; 36: 842-861. 2016/03/06. DOI: 10.1177/0271678X16636393.
25. Fan AP, An H, Moradi F, et al. Quantification of brain oxygen extraction and metabolism with [(15)O]-gas PET: A technical review in the era of PET/MRI. Neuroimage 2020; 220: 117136. 2020/07/08. DOI: 10.1016/j.neuroimage.2020.117136.
Figures