1303
Altered structural connectivity and impairment of brain network-cognition relationship in obstructive sleep apnea (OSA)1USC Stevens Neuroimaging and Informatics Institute, Keck School of Medicine of University of Southern California, Los Angeles, CA, United States, 2Department of Neurology, Boramae Medical Center, Seoul National University College of Medicine, Seoul, Korea, Republic of, 33Department of Neurology, Samsung Medical Center, Sungkyunkwan University School of Medicine, Samsung Biomedical Research Institute, Seoul, Korea, Republic of
Synopsis
Obstructive sleep apnea (OSA) possibly affects individuals cognitively. To identify potential neurocognitive drawbacks for these patients, diffusion MRI and T1 neuroimaging data were collected from 148 OSA and healthy subjects. Structural brain networks were constructed using diffusion MR images. Network topological characteristics and localized connectivity were performed on diffusion related network along with brain and behavior relationships. It was found that the OSA individuals generally had greater modularity network measure, and impaired connectivity in several regions in the frontal lobe. Also, some of the brain connections and behavior relationships that were established in healthy subjects were disrupted for OSA patients.
Background and Purpose
OSA is a common sleeping disorder that is associated with chronically fragmented sleep and intermittent hypoxemia,1 occurring when an individual suffers from reduced airflow while they sleep with the narrowing of the upper respiratory tract.2 Patients with OSA may also experience neurocognitive problems, such as deficits in memory, attention, and visuoconstructive abilities.3 The diffusion tensor imaging (DTI), especially the structural brain networks constructed from DTI, has the potential to assess brain structural impairments in OSA, leading to neurocognitive problems. While structural brain networks in OSA have been studied previously, the organization of brain networks in relations to neurocognitive impairment has been rarely studied. By comparing the topological organization and localized connectivity of the brain networks between OSA patients and healthy controls, and assessing their relationship with the cognitive scores, we aim to clarify the relationship between the brain network impairments and the neurocognitive deficit in OSA.Methods
148 male subjects were recruited in this study, including 90 OSA subjects and 58 normal subjects. DTI and T1 images were acquired on InteraAchieva 3T MRI (Philips Medical Systems). Cortical surface models and volumetric segmentations were produced using Freesurfer4 on T1-weighted MRI. For tractography, we performed multi-tensor modeling using the Markov-chain Monte Carlo method in FSL BEDPOSTX.5 Within-subject co-registration between T1 and DTI was performed using FSL FLIRT. An 82-by-82 structural network was constructed based on Desikan-Killiany parcellation6 together with extra subcortical regions. We performed deterministic multi-fiber tractography using a model-based interpolation framework7 to estimate connectivity between each region pair using the Quantitative Imaging Toolkit (QIT).8 We summarized each connection by the number of tractography curves, the average track density, the volume, the average FA, and combinations thereof.Using a threshold of 0.35 to remove the trivial connectivity, we analyzed the topographical characteristics of the networks using the Brain Toolbox (BCT),9 which provided summary graph theory network values including: global efficiency, modularity, characteristic path length, average R, and average clustering coefficient values. We further compared the group difference in localized connectivity using Network Based Statistics (NBS). Neurobehavioral exam scores were analyzed by compositing each exam scores into the following five cognitive domains (z-scores): attention executive functioning, information processing, verbal memory, visual memory, and language function. General linear models (GLM) were used to assess the relationship between brain measures and neurobehavioral scores, including age and body mass index (BMI) as covariates. We also compared between healthy and OSA groups using Student’s t-test after correcting for the effects of age and BMI.
Results
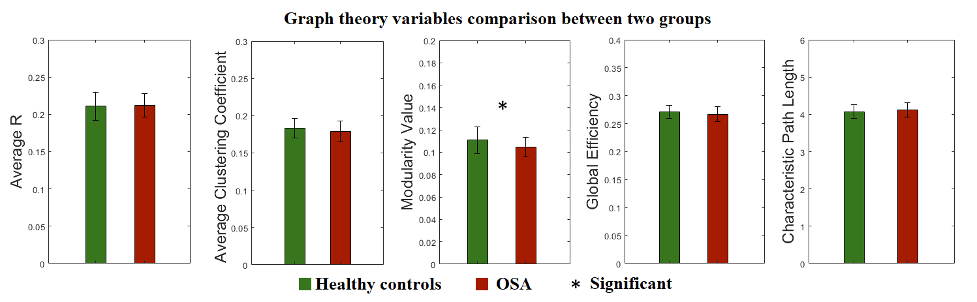
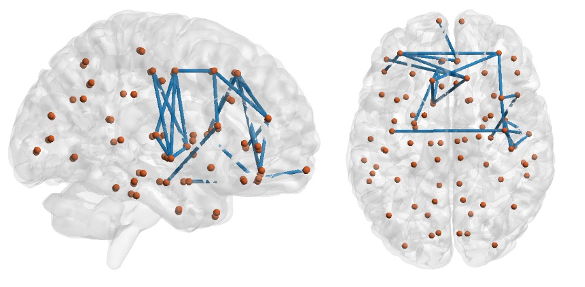
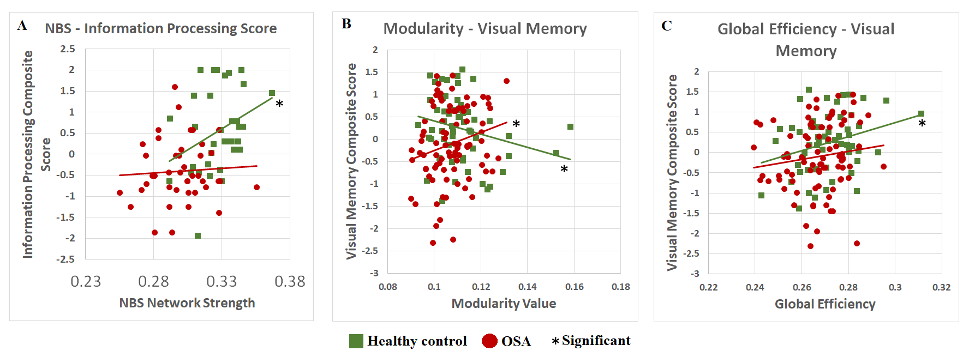
Our results exhibited that the modularity in OSA group was larger than healthy controls (uncorrected p<0.05). The GLM analysis demonstrated that modularity negatively correlated with visual memory score for healthy subjects (p=0.032), and global efficiency positively with visual memory scores in healthy subjects (p=0.026). However, in OSA patients, these two relationships of brain network-cognition were not observed.In NBS analysis, using the cluster defining threshold of p<1×10⁻⁴, a single network of 24 connections among 21 brain regions was revealed with weaker connectivity in the OSA group (p=0.003). It is shown that most of the disrupted connections in OSA were located in the frontal lobe of the brain. Analysis of brain network-cognition relationship indicated that network strength of NBS network positively correlated with information processing scores (p<0.05). This relationship was not found in OSA patients.
Conclusions
The modularity of brain structural networks in OSA patients was significantly higher than healthy controls. Network modularity was also associated with visual memory scores in healthy controls but not in OSA patients. A high network modularity is indicative of global segregation and local integration, implicating a suboptimal and inefficient topological organization. A high degree of local integration and integrity of the brain connections found in OSA patients may indicate the brain network disrupted in relation to sleep fragmentation and intermittent hypoxia.10Broad brain regions were thought to be involved in visual memory tasks, e.g., visual cortex, parietal cortex as spatial navigation and frontoparietal network as object retrieval and recognition,11 and hippocampus.12 In our study, global efficiency, a measure of global integration of network organization, was associated with visual memory scores in controls. This suggested that the normal visual memory function may require an integration of numerous cognitive resources and coordination of many brain regions.
For OSA patients, the higher modularity that is linked with an increase and isolation of brain local networks may further disrupt the global topological organization, eventually leading to the failure in coordinating cognitive resources and visual memory function.
Using NBS, we found that the most significantly disrupted connectivity was located in the frontal lobe. Altered functional responses and structure in the prefrontal cortex constitutes one of the most consistent findings in the neuroimaging of OSA.13 We also found that the network strength was positively associated with information processing function which consists of higher order cognitive functions related to the frontal cortex. Therefore, the disruption of frontal cortical connectivity in OSA may play a role in the impairment of the normal relationship between the frontal cortex and information processing.
Acknowledgements
This study was supported by the National Institutes of Health grants (P50NS035902, P01NS082330, R01NS046432, R01HD072074; P41EB015922; U54EB020406; U19AG024904; U01NS086090; 003585-00001) and BrightFocus Foundation Award (A2019052S).References
1. Luo, Yun-gang, et al. "Brain structure network analysis in patients with obstructive sleep apnea." PloS one 10.9 (2015): e0139055.
2. Lee MH, Yun CH, Min A, et al. Altered structural brain network resulting from white matter injury in obstructive sleep apnea. Sleep. 2019 Sep 6;42(9):zsz120. doi: 10.1093/sleep/zsz120. PMID: 31260533.
3. Décary, Anne, Isabelle Rouleau, and Jacques Montplaisir. "Cognitive deficits associated with sleep apnea syndrome: a proposed neuropsychological test battery." Sleep: Journal of Sleep Research & Sleep Medicine (2000).
4. Fischl, B. (2012). FreeSurfer. Neuroimage, 62(2), 774-781.
5. Behrens, T. E., Berg, H. J., Jbabdi, S., Rushworth, M. F., & Woolrich, M. W. (2007). Probabilistic diffusion tractography with multiple fibre orientations: What can we gain?. Neuroimage, 34(1), 144-155.
6. Desikan, R. S., Ségonne, F., Fischl, B., Quinn, B. T., Dickerson, B. C., Blacker, D., ... & Albert, M. S. (2006). An automated labeling system for subdividing the human cerebral cortex on MRI scans into gyral based regions of interest. Neuroimage, 31(3), 968-980.
7. Cabeen, R. P., Bastin, M. E., & Laidlaw, D. H. (2016). Kernel regression estimation of fiber orientation mixtures in diffusion MRI. Neuroimage, 127, 158-172.
8. Cabeen, R. P., Laidlaw, D. H., & Toga, A. W. (2018). Quantitative imaging toolkit: Software for interactive 3D visualization, data exploration, and computational analysis of neuroimaging datasets. ISMRM-ESMRMB Abstracts, 12-14.
9. Rubinov, M., & Sporns, O. (2010). Complex network measures of brain connectivity: uses and interpretations. Neuroimage, 52(3), 1059-1069.
10. Chen, Li-Ting, et al. "Disrupted small-world brain functional network topology in male patients with severe obstructive sleep apnea revealed by resting-state fMRI." Neuropsychiatric Disease and Treatment 13 (2017): 1471.
11. Salazar, R. F., et al. "Content-specific fronto-parietal synchronization during visual working memory." Science338.6110 (2012): 1097-1100.
12. Roland, P. E., and Balazs Gulyás. "Visual memory, visual imagery, and visual recognition of large field patterns by the human brain: functional anatomy by positron emission tomography." Cerebral Cortex 5.1 (1995): 79-93.
13. Dang-Vu, Thien Thanh. "Prefrontal dysfunction in obstructive sleep apnea: a biomarker of disease severity?" (2013): 631-632.
Figures