1302
Cerebral perfusion network analysis to understand cognition in old age: a principal component analysis of ASL-MRI1Division of Clinical Neuroscience, University of Nottingham, Nottingham, United Kingdom, 2Sir Peter Mansfield Imaging Centre, University of Nottingham, Nottingham, United Kingdom, 3NIHR Nottingham Biomedical Research Centre, University of Nottingham, Nottingham, United Kingdom, 4Alzheimer's Disease Neuroimaging Initiative, Los Angeles, CA, United States
Synopsis
A functional biomarker of age-related cognitive decline is yet to be elucidated but would be desirable to better understand detrimental and protective processes in order to promote cognitive health for the elderly. Challenges arise from multiple sources of variance across individuals and within brain perfusion maps with an unknown link between local or network function and clinical tests of global cognition. Principal Component Analysis provides the opportunity to address some of these knowledge gaps, by defining this relationship and relating this to underlying anatomical regions.
Purpose
Blood flow is indicative of metabolic requirements of nearby tissue, responsible for delivery of oxygen and glucose to facilitate metabolic reactions1. Whilst hypoperfusion of the posterior cingulate cortex is one of the most consistent findings thus far to indicate functional decline across the healthy ageing - mild cognitive impairment - Alzheimer’s disease continuum (HA-MCI-AD)2, this ignores the global nature of brain ageing, necessitating further investigation of the whole brain or underlying networks. Additionally, clinical diagnostic tests such as the Montreal Cognitive Assessment (MoCA)3 are key to detection of cognitive impairment, yet little is known about how these tests relate to cerebral perfusion. Principal Component Analysis (PCA) is a powerful technique to further characterise this relationship in a data-driven multivariate approach, and has shown great utility in fluorodeoxyglucose positron emission tomography (FDG-PET) investigations of ageing-related hypometabolism.4Aim
To determine the relationship between cerebral blood flow patterns in grey matter (GM), and MoCA scores in cognitively normal elderly using PCA and graph analysis.Methods
49 healthy subjects (13M: 36F, mean = 66.45 [SD = 50.98 - 84]) from a combination of unrelated studies – the Alzheimer’s Disease Neuroimaging Initiative (third iteration - ADNI-3) and internal cohorts within the Sir Peter Mansfield Imaging Centre – with approved data sharing, underwent pseudo-continuous arterial spin labelling with 3D spiral readout (internal cohorts: TE/TR= 10.5/4632ms, FA= 111 degrees, labelling duration= 1450ms, FOV= 240mm, slice thickness= 4mm, slice gap= 4mm, number of slices= 36, echo train length= 1, number of excitations= 3, acquisition matrix= 128*128. PLD of either 2025 or 1625ms. ADNI-3 variants: TE/TR= 10.5/4885ms, PLD= 2000ms) at 3T using either a Discovery MR750/750w scanner (GE Healthcare, Chicago, IL) with 8- or 32-channel head coil, for a cross-sectional retrospective study. FSPGR-BRAVO T1 images were also acquired, and the MoCA administered in the baseline research visit.Images were quality controlled, partial-volume corrected based on the modified least-trimmed squares approach5, registered to MNI space using the Medical Image Registration ToolKit, and smoothed using a median filter. GM was masked using a dual-tissue probability mask, excluding ≤20% GM and ≥30% CSF.
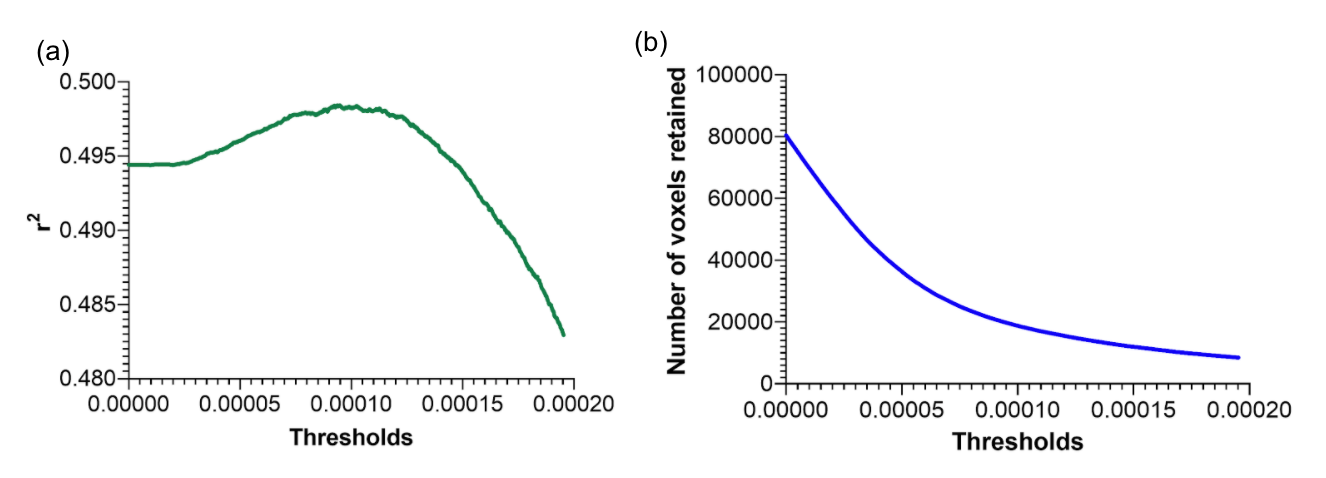
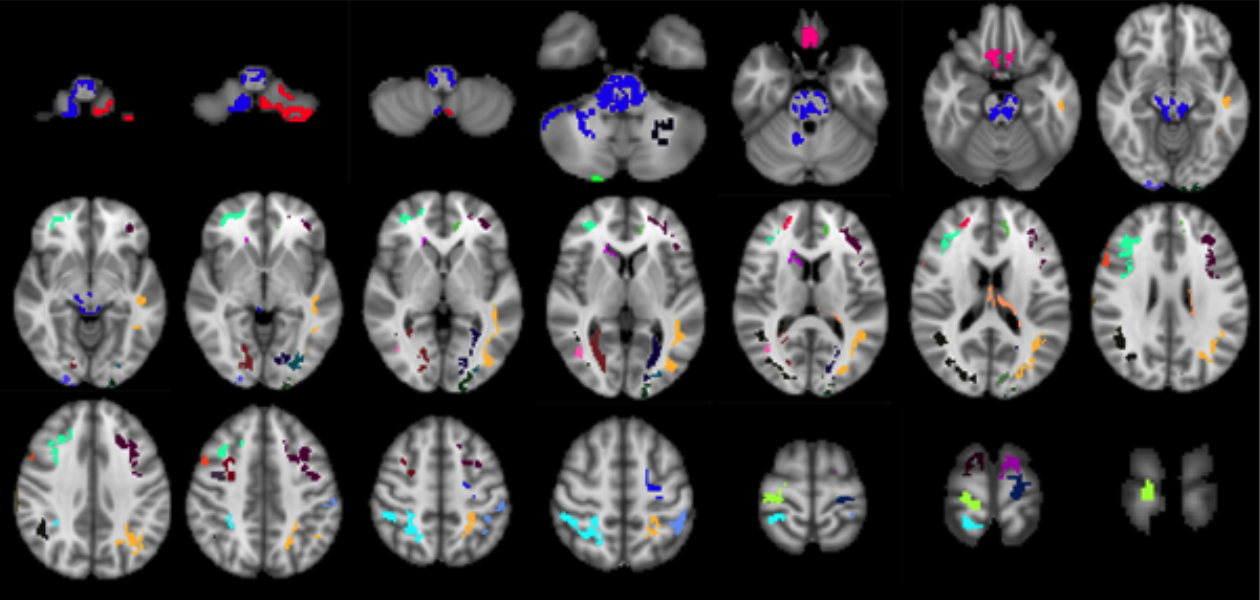
A PCA-based ASL linear regression model — based on established methods6 using log-transformed, double-demeaned cerebral blood flow (CBF) values7,8 — assessed the relationship between cerebral perfusion covariance and MoCA scores. Component selection was based on the residual variance of the MoCA regression model and expected error variance of the MoCA score9. Surviving components were linearly combined, then thresholded to maximise variance explained while minimising voxels retained, to remove spurious and less relevant voxels. Age, sex, GM perfusion and GM volume were included as covariates. A graph showing associations between regions in the thresholded linearly combined component (≥0.5ml volume) was constructed, by correlating the mean vectors of each pair of regions, using the log-transformed, double-demeaned CBF values, to help visualise the relationships between spatial networks resulting from PCA analysis.
Results
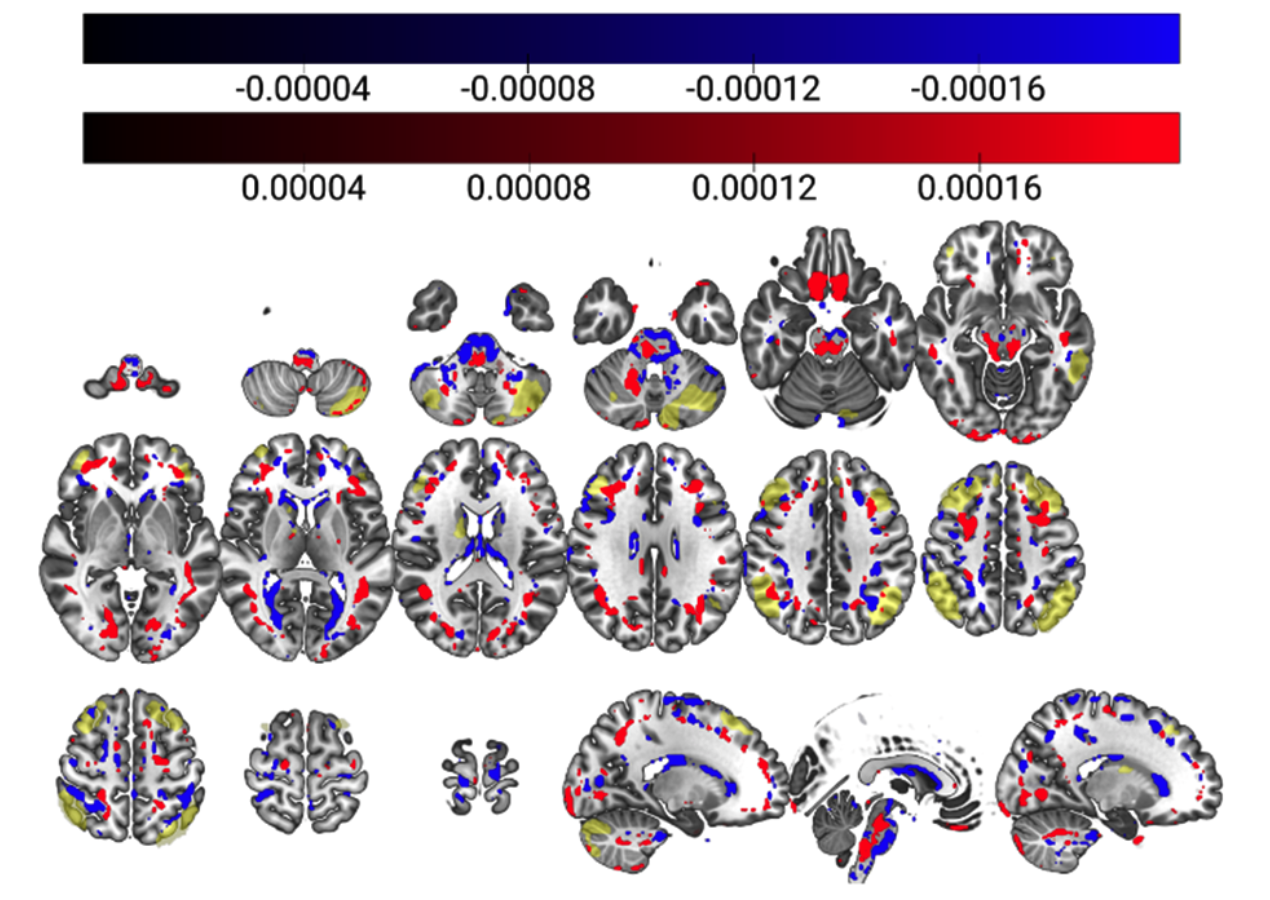
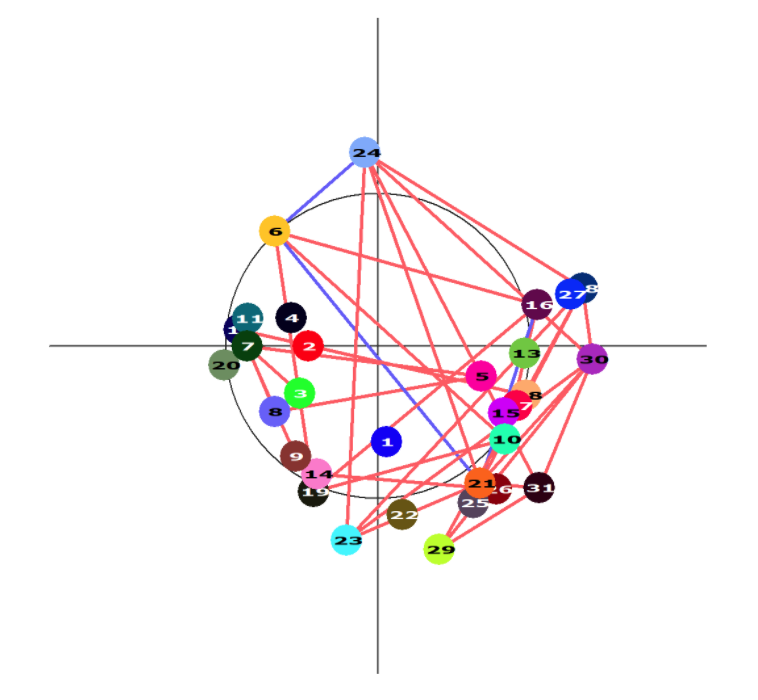
The PCA model considered 48 components, of which three survived – components 1, 4 and 42. The unthresholded model provided moderate explanation of the MoCA/cerebral perfusion relationship (r2=0.4994), with thresholding to retain 98% of the r2 removing spurious and noisy voxels (Figure 1). Figure 2 shows remaining voxels for the thresholded surviving components. Figures 3 and 4 show regional relatedness, and a negative correlation between nodes 6, 16, 21 and 24, as well as multiple positive correlations between various other nodes. Whilst the default mode network (DMN) was not evident in the results, inclusion of parts of the executive control network (ECN) is apparent. Voxel-based comparison using FSL-randomise evidenced no significant results.Discussion
This study is an interesting first step to defining the relationship between cerebral perfusion and MoCA scoring, highlighting the greater power of multivariate PCA over univariate FSL-randomise in elucidating this relationship. Whilst PCA defines this variance, graph visualisation adds to its interpretability, relating these findings to regional perfusion, by further clarifying an underlying healthy perfusion pattern. Here, an interesting negative correlation exists between nodes including the left parietal, occipital and frontal lobes, and the right middle frontal gyrus. Various positive correlations across much of the GM are apparent, including both the thalamus and dorsolateral prefrontal cortex (DLPFC), highlighting involvement of parts of the executive control network (ECN) and their associations. However, both positive and negative component expression in such networks suggests variance in the MoCA/cerebral perfusion relationship at a regional recruitment level, which may be missed in simpler analyses. Several ‘hubs’ appear to exist, with nodes of multiple connections and anatomical groupings apparent. Absence of correlations with other nodes (such as the brainstem, node 1) suggests spuriousness warranting analysis of additional nuisance factors. Absence of the DMN is noteworthy, given its consistent failure early in Alzheimer’s disease.10 Inclusion of further covariates pertaining to long- and short-term medication use, genetics, lifestyle factors, and socio-economic and educational statuses may improve the model’s explanatory power. If validated in an independent cohort a robust CBF pattern explaining age-related cognitive decline would be valuable to better understand and ultimately promote cognitive health in the elderly.Conclusion
Using ASL-PCA provides preliminary support for a CBF pattern partially explaining cognitive decline in older age.Acknowledgements
Jodi Watt holds a studentship from Life Cycle 5.
*Data used in preparation of this article were obtained from the Alzheimer’s Disease Neuroimaging Initiative (ADNI) database (adni.loni.usc.edu). As such, the investigators within the ADNI contributed to the design and implementation of ADNI and/or provided data but did not participate in analysis or writing of this report. A complete list of ADNI investigators can be found at: http://adni.loni.usc.edu/wp-content/uploads/how_to_apply/ADNI_Acknowledgement_list.pdf
Data collection and sharing for this project was funded by the Alzheimer's Disease Neuroimaging Initiative (ADNI) (National Institutes of Health Grant U01 AG024904) and DOD ADNI (Department of Defense award number W81XWH-12-2-0012). ADNI is funded by the National Institute on Aging, the National Institute of Biomedical Imaging and Bioengineering, and through generous contributions from the following: AbbVie, Alzheimer’s Association; Alzheimer’s Drug Discovery Foundation; Araclon Biotech; BioClinica, Inc.; Biogen; Bristol-Myers Squibb Company; CereSpir, Inc.; Cogstate; Eisai Inc.; Elan Pharmaceuticals, Inc.; Eli Lilly and Company; EuroImmun; F. Hoffmann-La Roche Ltd and its affiliated company Genentech, Inc.; Fujirebio; GE Healthcare; IXICO Ltd.; Janssen Alzheimer Immunotherapy Research & Development, LLC.; Johnson & Johnson Pharmaceutical Research & Development LLC.; Lumosity; Lundbeck; Merck & Co., Inc.; Meso Scale Diagnostics, LLC.; NeuroRx Research; Neurotrack Technologies; Novartis Pharmaceuticals Corporation; Pfizer Inc.; Piramal Imaging; Servier; Takeda Pharmaceutical Company; and Transition Therapeutics. The Canadian Institutes of Health Research is providing funds to support ADNI clinical sites in Canada. Private sector contributions are facilitated by the Foundation for the National Institutes of Health (www.fnih.org). The grantee organization is the Northern California Institute for Research and Education, and the study is coordinated by the Alzheimer’s Therapeutic Research Institute at the University of Southern California. ADNI data are disseminated by the Laboratory for Neuro Imaging at the University of Southern California.
References
1 Zauner, A. and Muizelaar, J.P., 1997. Brain metabolism and cerebral blood flow. Head injury, pp.89-99.
2 Sierra-Marcos, A., 2017. Regional cerebral blood flow in mild cognitive impairment and Alzheimer’s disease measured with arterial spin labeling magnetic resonance imaging. International journal of Alzheimer’s disease, 2017.
3 Nasreddine, Z.S., Phillips, N.A., Bédirian, V., Charbonneau, S., Whitehead, V., Collin, I., Cummings, J.L. and Chertkow, H., 2005. The Montreal Cognitive Assessment, MoCA: a brief screening tool for mild cognitive impairment. Journal of the American Geriatrics Society, 53(4), pp.695-699.
4 Nobili, F., Salmaso, D., Morbelli, S., Girtler, N., Piccardo, A., Brugnolo, A., Dessi, B., Larsson, S.A., Rodriguez, G. and Pagani, M., 2008. Principal component analysis of FDG PET in amnestic MCI. European journal of nuclear medicine and molecular imaging, 35(12), pp.2191-2202.
5 Liang, X., Connelly, A. and Calamante, F., 2013. Improved partial volume correction for single inversion time arterial spin labeling data. Magnetic Resonance in Medicine, 69(2), pp.531-537.
6 Zhang, N., Gordon, M.L., Ma, Y., Chi, B., Gomar, J.J., Peng, S., Kingsley, P.B., Eidelberg, D. and Goldberg, T.E., 2018. The age-related perfusion pattern measured with arterial spin labeling MRI in healthy subjects. Frontiers in aging neuroscience, 10, p.214.
7 Spetsieris, P.G., Ma, Y., Dhawan, V. and Eidelberg, D., 2009. Differential diagnosis of parkinsonian syndromes using PCA-based functional imaging features. Neuroimage, 45(4), pp.1241-1252.
8 Melzer, T.R., Watts, R., MacAskill, M.R., Pearson, J.F., Rüeger, S., Pitcher, T.L., Livingston, L., Graham, C., Keenan, R., Shankaranarayanan, A. and Alsop, D.C., 2011. Arterial spin labelling reveals an abnormal cerebral perfusion pattern in Parkinson’s disease. Brain, 134(3), pp.845-855.
9 Feeney, J., Savva, G.M., O’Regan, C., King-Kallimanis, B., Cronin, H. and Kenny, R.A., 2016. Measurement error, reliability, and minimum detectable change in the Mini-Mental State Examination, Montreal Cognitive Assessment, and Color Trails Test among community living middle-aged and older adults. Journal of Alzheimer's Disease, 53(3), pp.1107-1114.
10 Greicius, M.D., Srivastava, G., Reiss, A.L. and Menon, V., 2004. Default-mode network activity distinguishes Alzheimer's disease from healthy aging: evidence from functional MRI. Proceedings of the National Academy of Sciences, 101(13), pp.4637-4642.
11 Shirer, W.R., Ryali, S., Rykhlevskaia, E., Menon, V. and Greicius, M.D., 2012. Decoding subject-driven cognitive states with whole-brain connectivity patterns. Cerebral cortex, 22(1), pp.158-165.
Figures