1300
Reproducibility of brain ultrashort-T2* component measurements in healthy volunteers1Department of Radiology and Biomedical Imaging, University of California, San Francisco, San Francisco, CA, United States, 2UC Berkeley - UCSF Graduate Program in Bioengineering, Berkeley and San Francisco, CA, United States
Synopsis
This work presents a study detailing the reproducibility of ultrashort-T2* measurements using a novel UTE relaxometry method. Generated parameter maps show similar looking structures in terms of intensity and definition. Furthermore, the distributions of the ultrashort-T2* fractional component in various brain ROIs show similar distributions and have low coefficients of variance. These results suggest the proposed UTE relaxometry method is reproducible and can reliably measure parameters of the brain ultrashort-T2* component.
Introduction
Myelin plays a critical role in facilitating rapid neural signal conduction across the brain. MRI is the preferred imaging modality for assessing myelin given its sensitivity to water content, binding, and diffusion. Recent studies have characterized ultrashort-T2* components in the brain using a novel ultrashort echo time (UTE) relaxometry method. These components are most likely associated with methylene protons in myelin phospholipid membranes and are a potentially more direct measure of myelination1, 2, 3, 4, 5. While parameter mapping and relaxometry methods can more accurately characterize tissue pathology, it is necessary to demonstrate the accuracy and reliably of such techniques. Here, we evaluated the reproducibility of the brain ultrashort-T2* component measurements in healthy volunteers.Methods
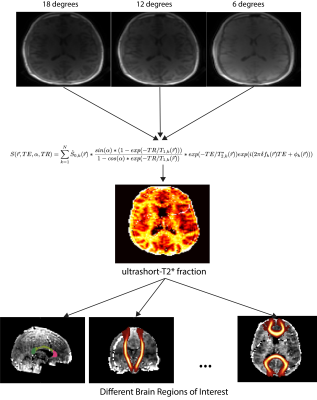
Whole brain relaxometry was performed using a 3D radial pulse sequence supporting UTEs with a nonselective, hard pulse excitation. The delay between excitation and readout was shifted between TRs to acquire a set of 8 different sets TEs within a single scan ranging from 24 µs to 5 ms. Three of these UTE scans were performed at 6, 12, and 18 degree flip angles. T1, T2*, and relative proton density maps were derived using VFA method and adding the SPGR signal equation to the following signal model:$$S(\vec{r}, TE, \alpha, TR) =\sum_{k=1}^{N} \hat{S}_{0, k}(\vec{r})* \frac{sin(\alpha)*(1 - exp(-TR/T_{1, k}(\vec{r})))}{1-cos(\alpha) * exp(-TR/T_{1, k}(\vec{r}))} * exp(-TE/T^{*}_{2, k}(\vec{r}))exp(i(2\pi \delta f_{k}(\vec{r})TE + \phi _{k}(\vec{r})))$$
with N=2 components where the first captured all long-T2* (> 1 ms) components and the second captured the ultrashort-T2* (< 1 ms) components. Our prior work has shown that, while the long-T2* components are near the water resonance frequency, the ultrashort-T2* component is near the primary fat resonance frequencies (~1.5 ppm)5. Quantitative parameter maps for each flip angle representing each of these measurements were generated in MATLAB (Mathworks). Flip angles were strategically chosen to saddle either side of the Ernst angles for gray, white matter, and the ultrashort-T2* component for more accurate T1 quantification. Other key parameters were 2 mm isotropic resolution, 4.1-5.8 fold parallel imaging acceleration reconstructed with non-Cartesian ESPIRiT6 and support for anisotropic FOVs. The same volunteer was scanned twice with the above method with the subject removed from the scanner and then reinserted into the head coil after the first scan. For two volunteers the volunteer was scanned twice on the same day while for two other volunteers the same scans were performed on different days within 2 months of each other.
Results and Discussion
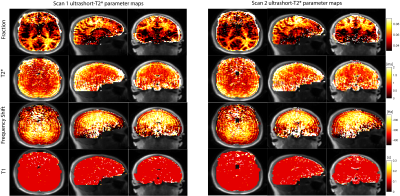
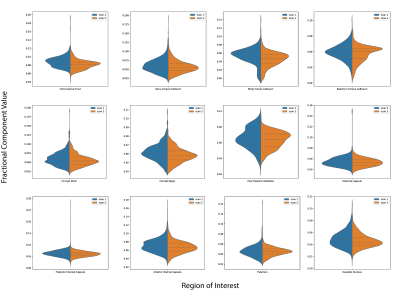
Figure 2 showcases the measured ultrashort-T2* parameters maps (fractional component, T2*, frequency shift, and T1) from two separate scans of the same volunteer. All 4 parameter maps from both scans show similar intensities. We can see similar higher ultrashort-T2* fractional component values in white matter structures of 0.09 as expected. Additionally, typical gray matter areas have a lower measured ultrashort-T2* fraction and appear darker in both scans demonstrating the similarity of the fractional component in different scans of the same subject. The frequency shift parameter maps from both scans show higher values in some white matter regions, namely the corpus callosum and corticospinal tracts as expected. The T2* and T1 maps show similar consistencies across the cortex. The T2* map shows more lateral areas of the brain having a longer T2* than compared to more medial structures in both scans. Additionally, the T1 map of the ultrashort component shows uniformity across the cortex in both scans, suggesting the variable flip angle acquisition and calculation method to incorporate differential T1 weighting is robust.Figure 3 shows split violin plots comparing measured fractional component in various white matter ROIs. We see that the interquartile range for each ROI is similar across brain regions in both scans. This suggests that not only is the measured whole brain fractional component the same, but the distribution across different brain regions is similar across the four volunteers. Inspection of the distributions show larger, more clearly defined ROIs such as the corticospinal tract and posterior internal capsule tend to have tighter distributions. Conversely, smaller ROIs such as the body corpus callosum tend to have more outliers and wider distributions. This is probably due to the fact that the fitting model tends to not perform as well when resolving smaller structures.
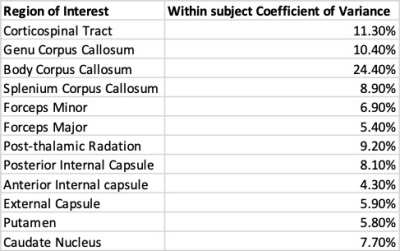
This latter point is highlighted in Table 1 which reports the within-subject coefficient of variance for each ROI. The body of the corpus callosum has a higher variance of 24.4% compared to other white matter structures due to the proximity of air in the sinus and the thin nature of the structure compared to other ROIs measured. Overall, these results suggest that the relaxometry method described is reproducible and robust when the same subject is scanned either back to back or up to 2 months apart.
Conclusion
This work details the reproducibility of ultrashort-T2* component measurements using a novel UTE relaxometry method. Visual inspection of parameter maps show similar looking structures in terms of intensity and definition. Additionally, the distributions of the fractional component in various brain ROIs show similar distributions and have mostly low coefficients of variance (4.3%-11.3%). These results suggest the proposed UTE relaxometry method is reproducible and can reliably measure parameters of the brain ultrashort-T2* component.Acknowledgements
No acknowledgement found.References
1. Horch, R. A., Gore, J. C., & Does, M. D. (2011) Origins of the ultrashort-T(2) (1) H NMR signals in myelinated nerve: A direct measure of myelin content?. Magn Reson Med 66, 24-31.
2. Wilhelm, M. J., Ong, H. H., Wehrli, S. L., Li, C., Tsai, P.-H., Hackney, D. B., & Wehrli, F. W. (2012) Direct magnetic resonance detection of myelin and prospects for quantitative imaging of myelin density. Proc Natl Acad Sci U S A 109, 9605-10.
3. Du, J., Ma, G., Li, S., Carl, M., Szeverenyi, N. M., VandenBerg, S., Corey-Bloom, J., & Bydder, G. M. (2014) Ultrashort echo time (UTE) magnetic resonance imaging of the short T2 components in white matter of the brain using a clinical 3T scanner. Neuroimage 87, 32-41.
4. Du J ,Sheth V ,He Q ,Carl M ,Chen J ,Corey-Bloom J ,Bydder GM. Measurement of T1 of the ultrashort T2* components in white matterof the brain at 3T. PLoS One 2014;9:e103296.
5. Boucneau, T., Cao P, Tang, S., Han M., Xuan D., Henry RG., & Larson PEZ. (2018) In Vivo Characterization of Brain Ultrashort-T2 Components. Magn Reson Med, 80(2), 726-735.
6. Uecker, M., Lai, P., Murphy, M. J., Virtue, P., Elad, M., Pauly, J. M., Vasanawala, S. S., & Lustig, M. (2013) ESPIRiT-an eigenvalue approach to autocalibrating parallel MRI: Where SENSE meets GRAPPA. Magn Reson Med , 71(3), 990-1001.
Figures


