1296
Application of quantitative susceptibility mapping in assessment of iron content in brain regions of normal children1Children's Hospital of Chongqing Medical University, Chongqing, China, 2GE Healthcare, MR Research China, Beijing, Beijing, China
Synopsis
In the central nervous system, iron is a cofactor for many metabolic processes and aminergic neurotransmitter synthesis, and iron plays an important role in brain development from the fetal to adolescent stages. There have been many reports about the application of quantitative magnetic susceptibility mapping (QSM) to detect iron content in the normal adult brain at home and abroad and few reports about the application of QSM to detect iron content in the normal brain of children.
Purpose
In this study, QSM was used to detect the iron content in various brain regions of normal children, and the physiological distribution characteristics, and variation in the iron content in various brain regions of normal children were found, which provided an objective basis for the clinical diagnosis and treatment of some diseases in children.Material and Methods
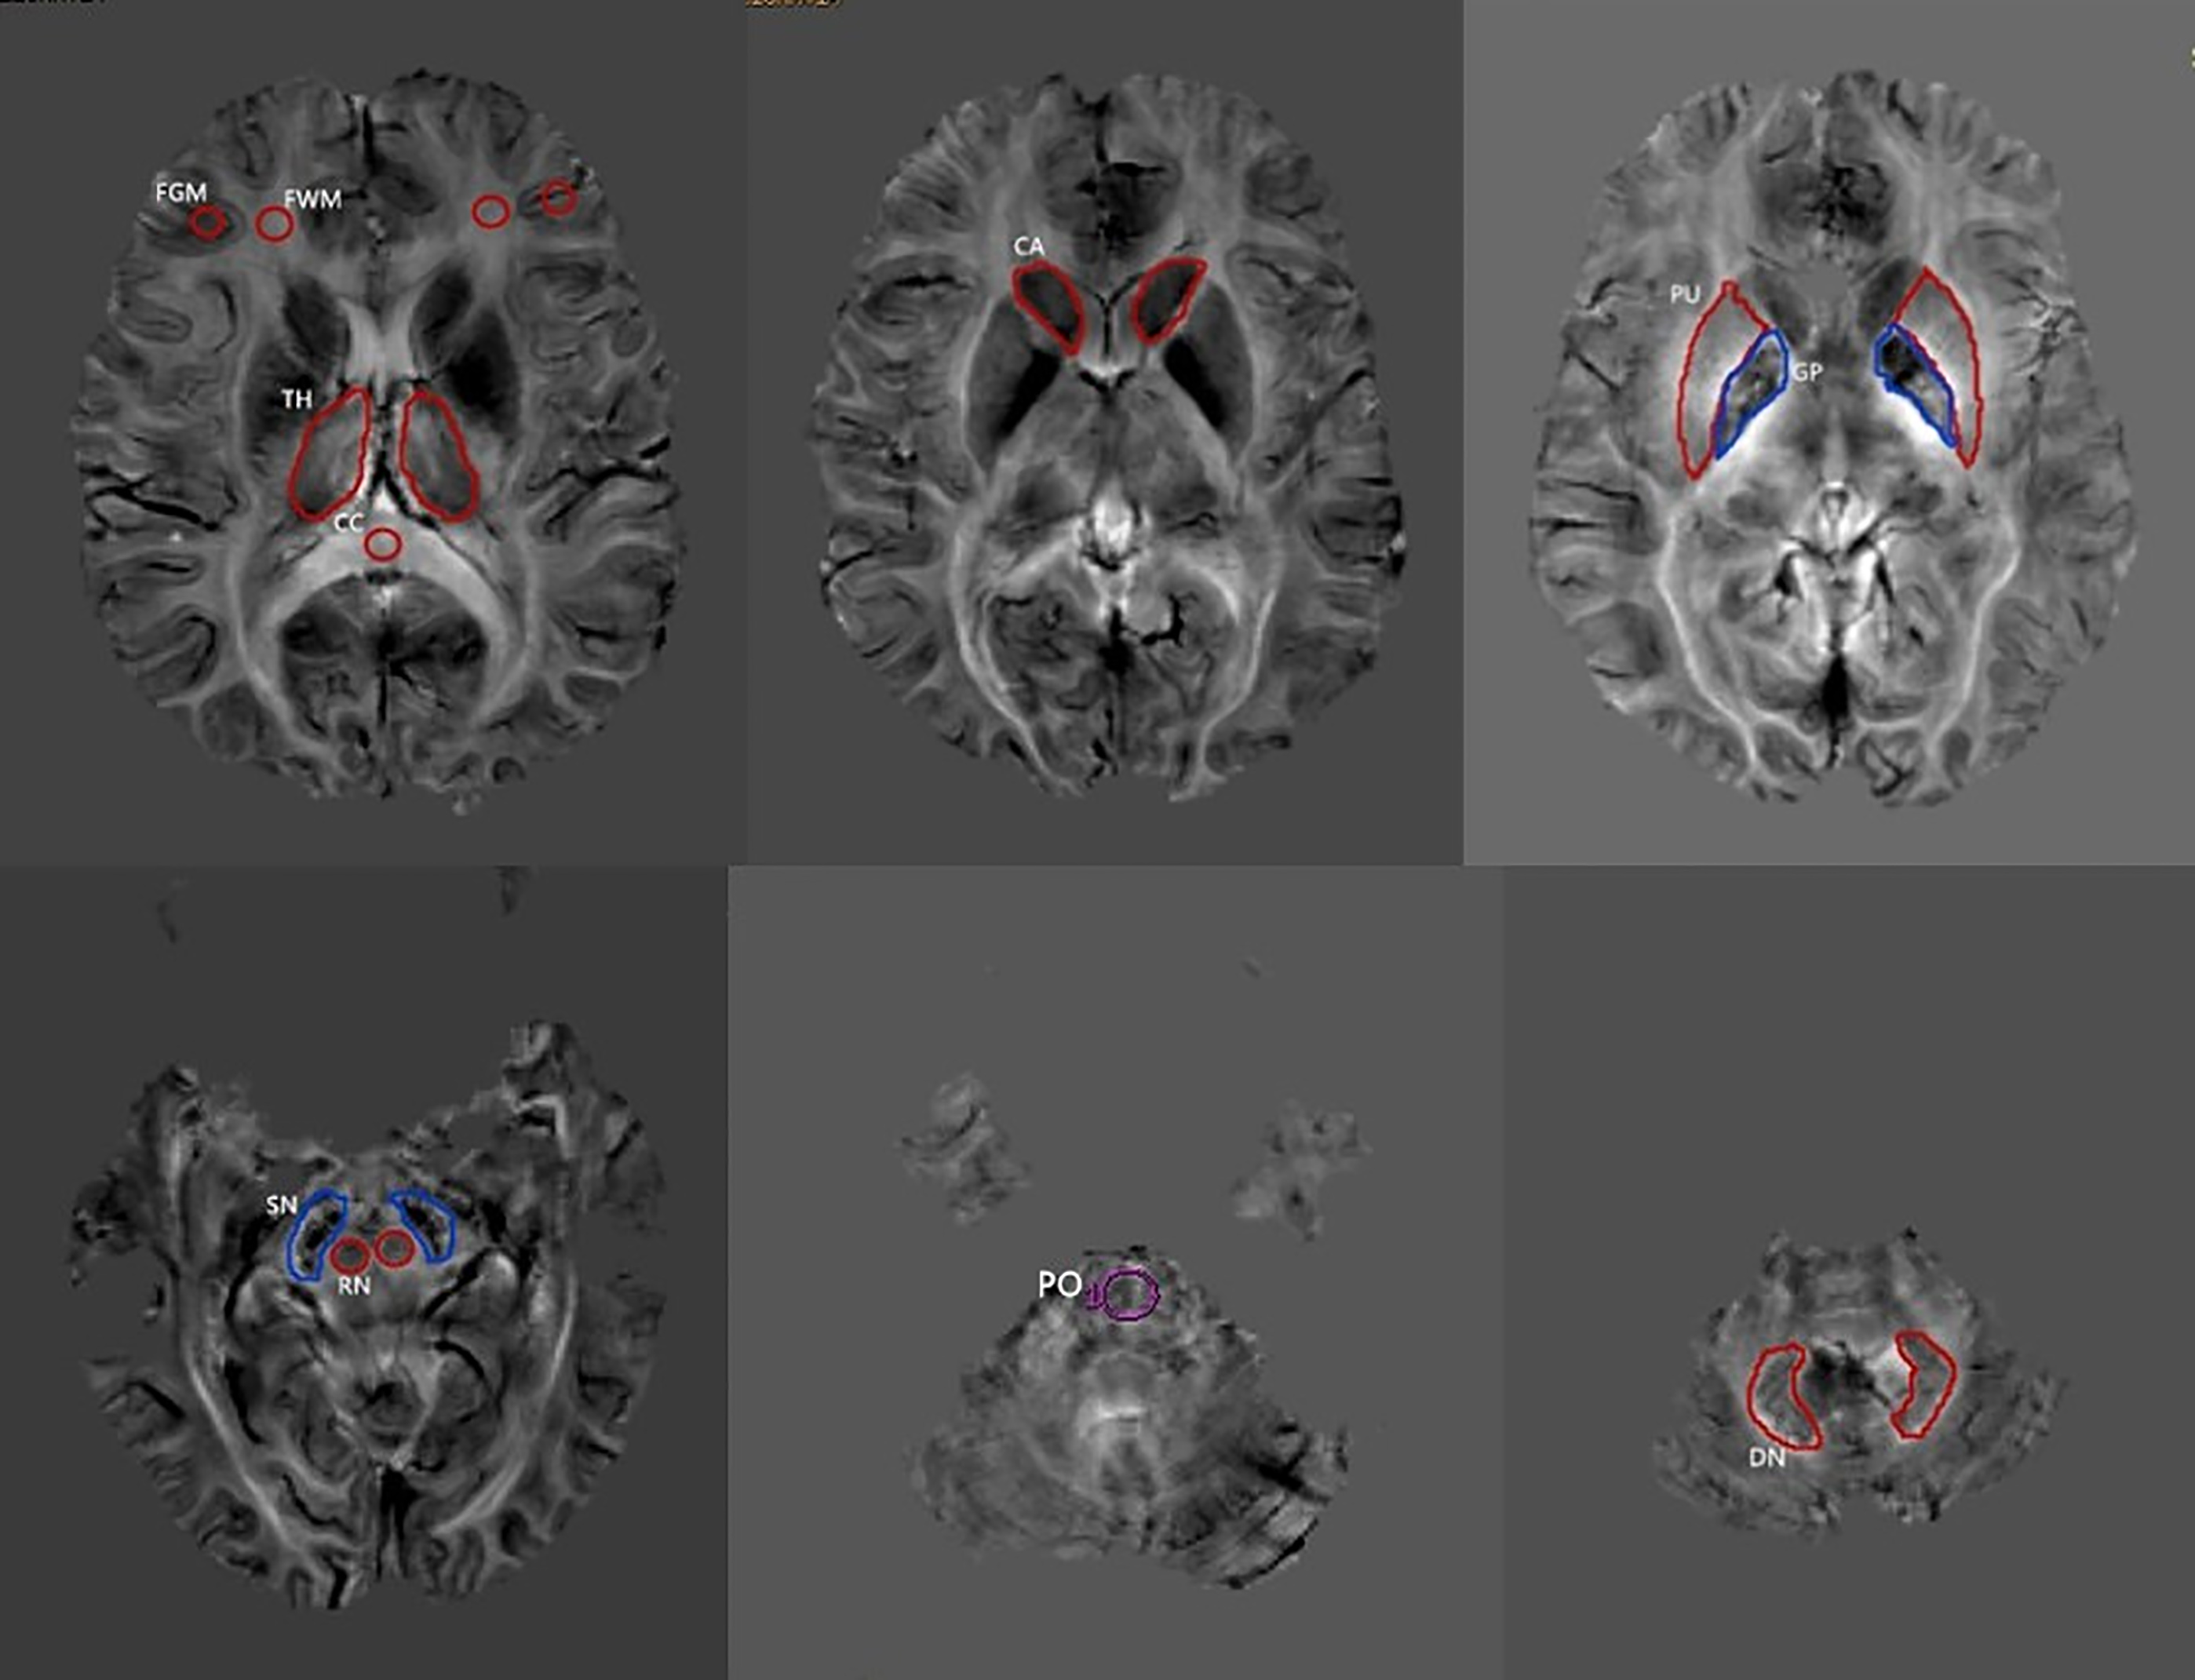
From June 2018 to December 2019, 50 normal children aged ≥2-<3, ≥3-<4, ≥4-<5, ≥5-<6, ≥6-<9, ≥9-<12, ≥12-<15, or ≥15-<18 years were prospectively selected. All children received routine head MRI and enhanced T2 star-weighted angiography (ESWAN) sequence scans, and the ESWAN sequence images were processed by software to obtain whole brain magnetic susceptibility mapping. The magnetic susceptibility values of different age groups in the same brain region were compared, and the magnetic susceptibility values of the same age group were compared across genders, brain sides and brain regions.Results
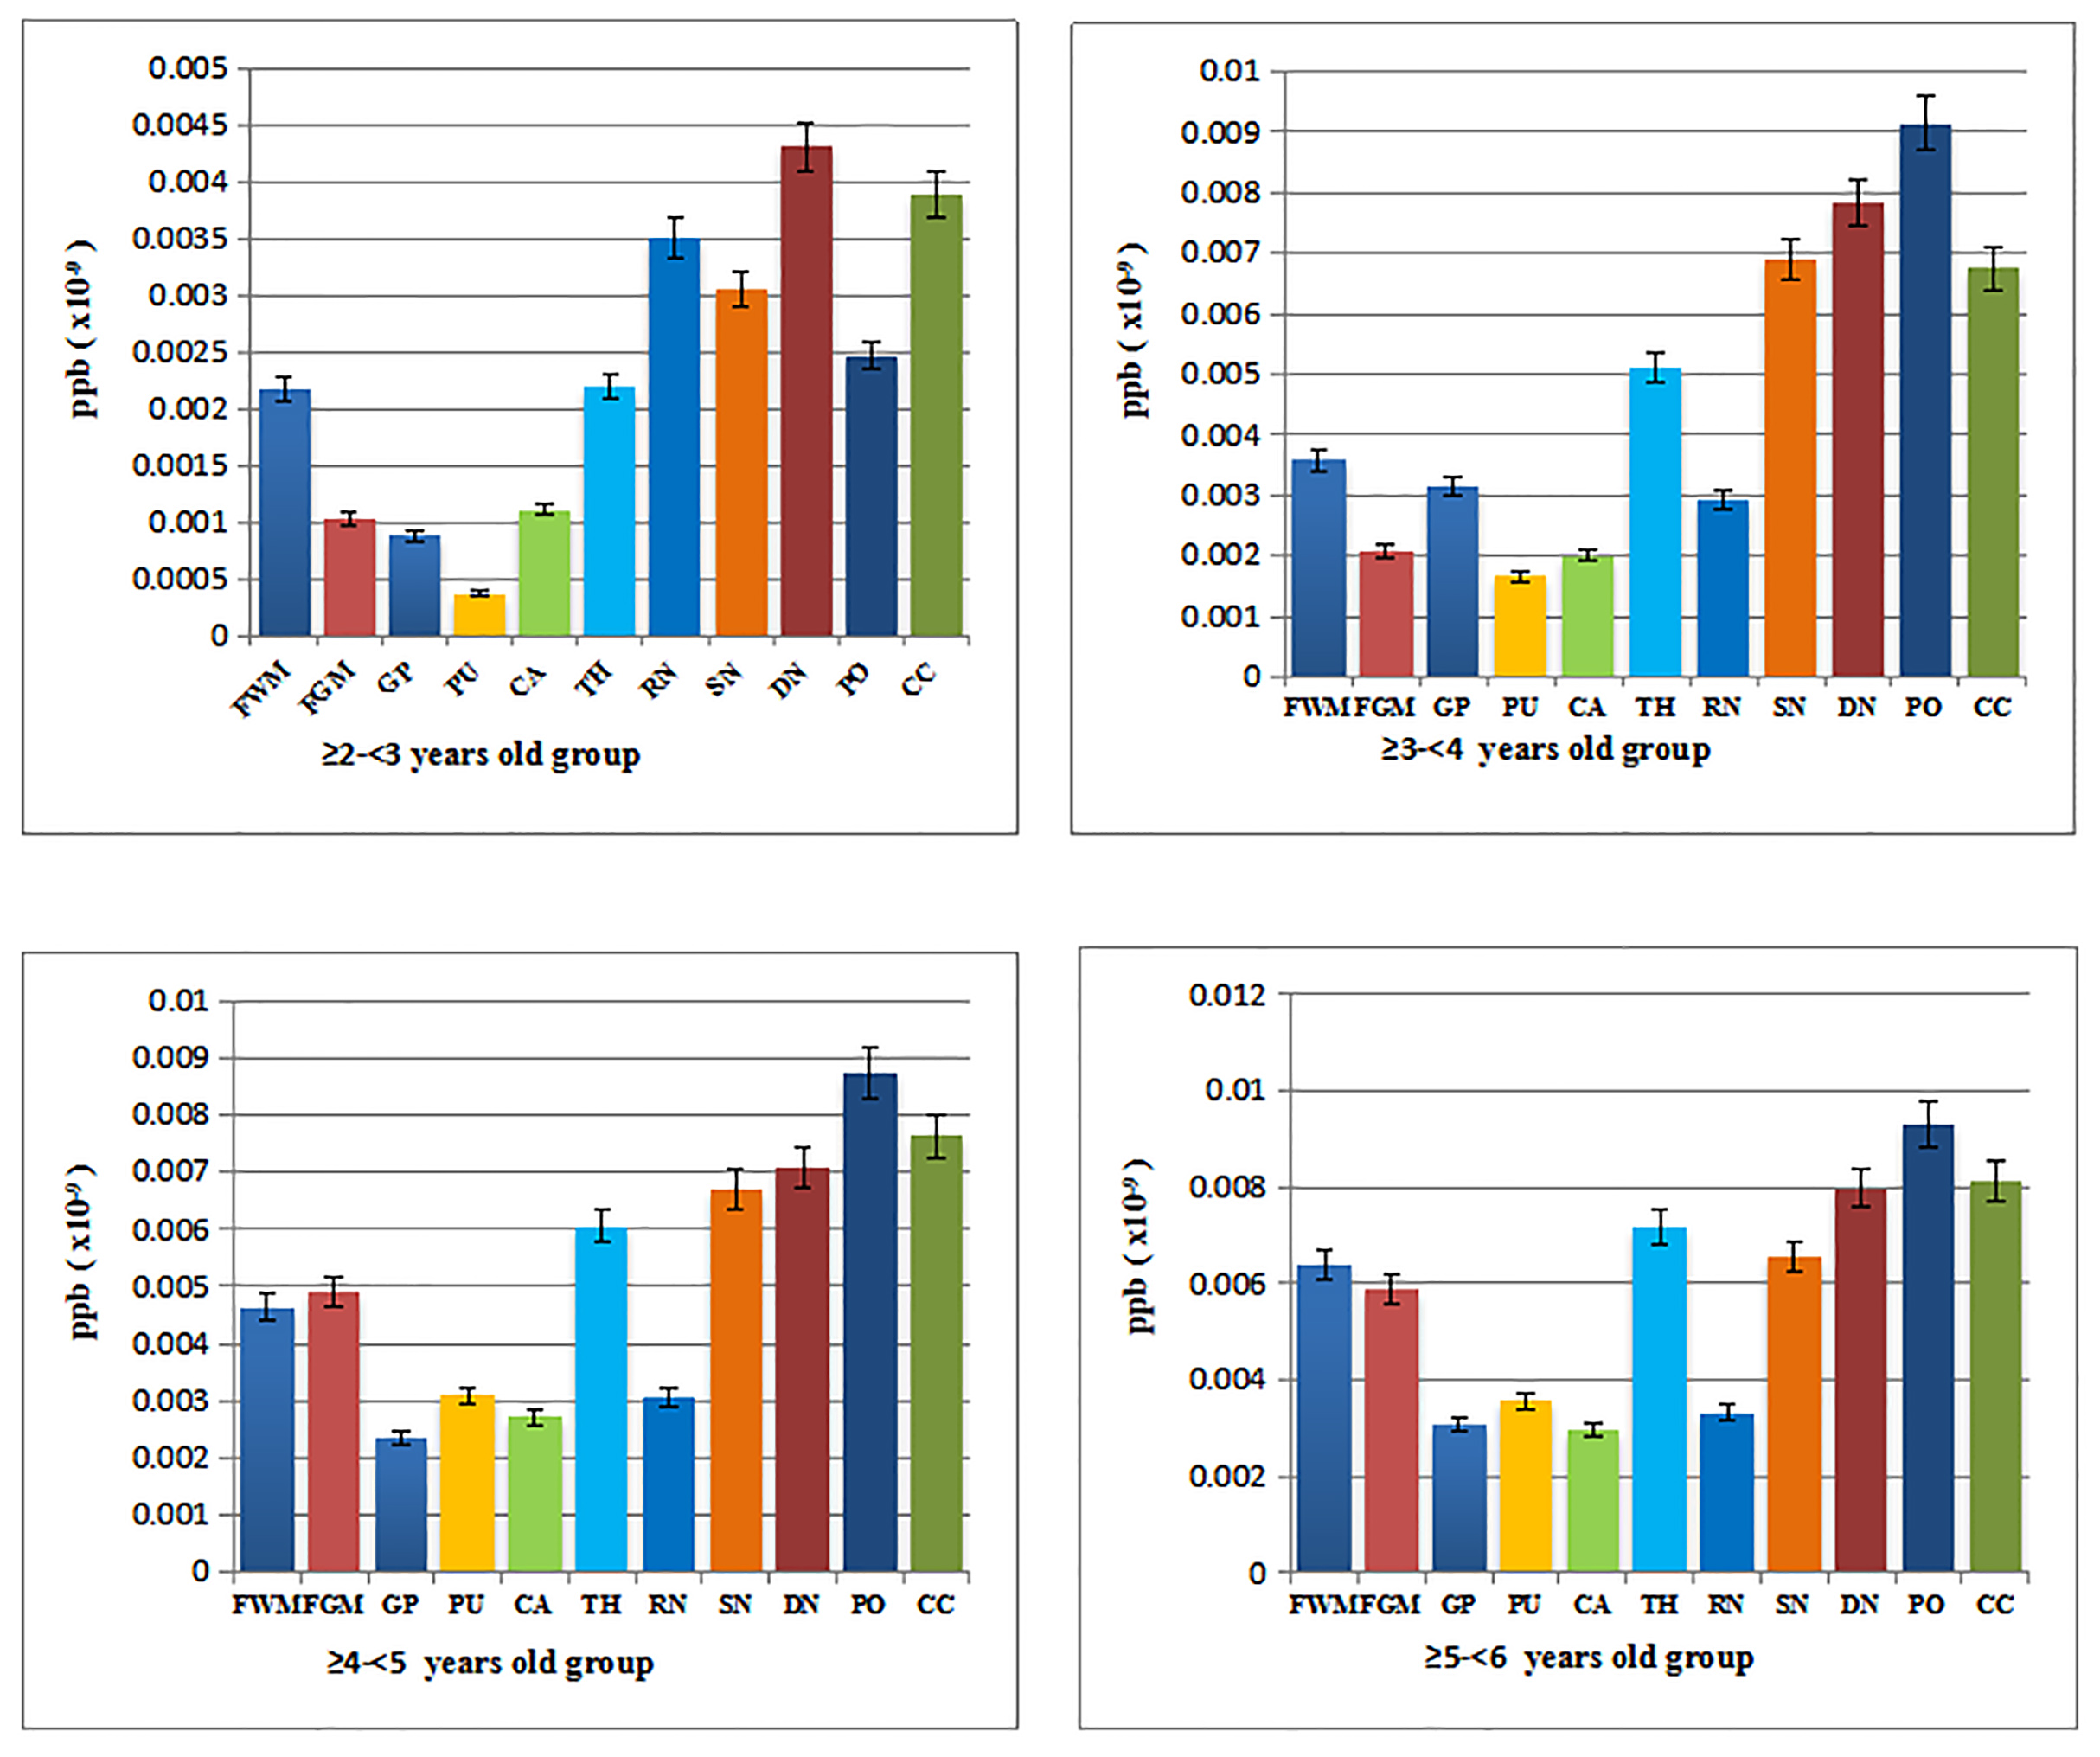
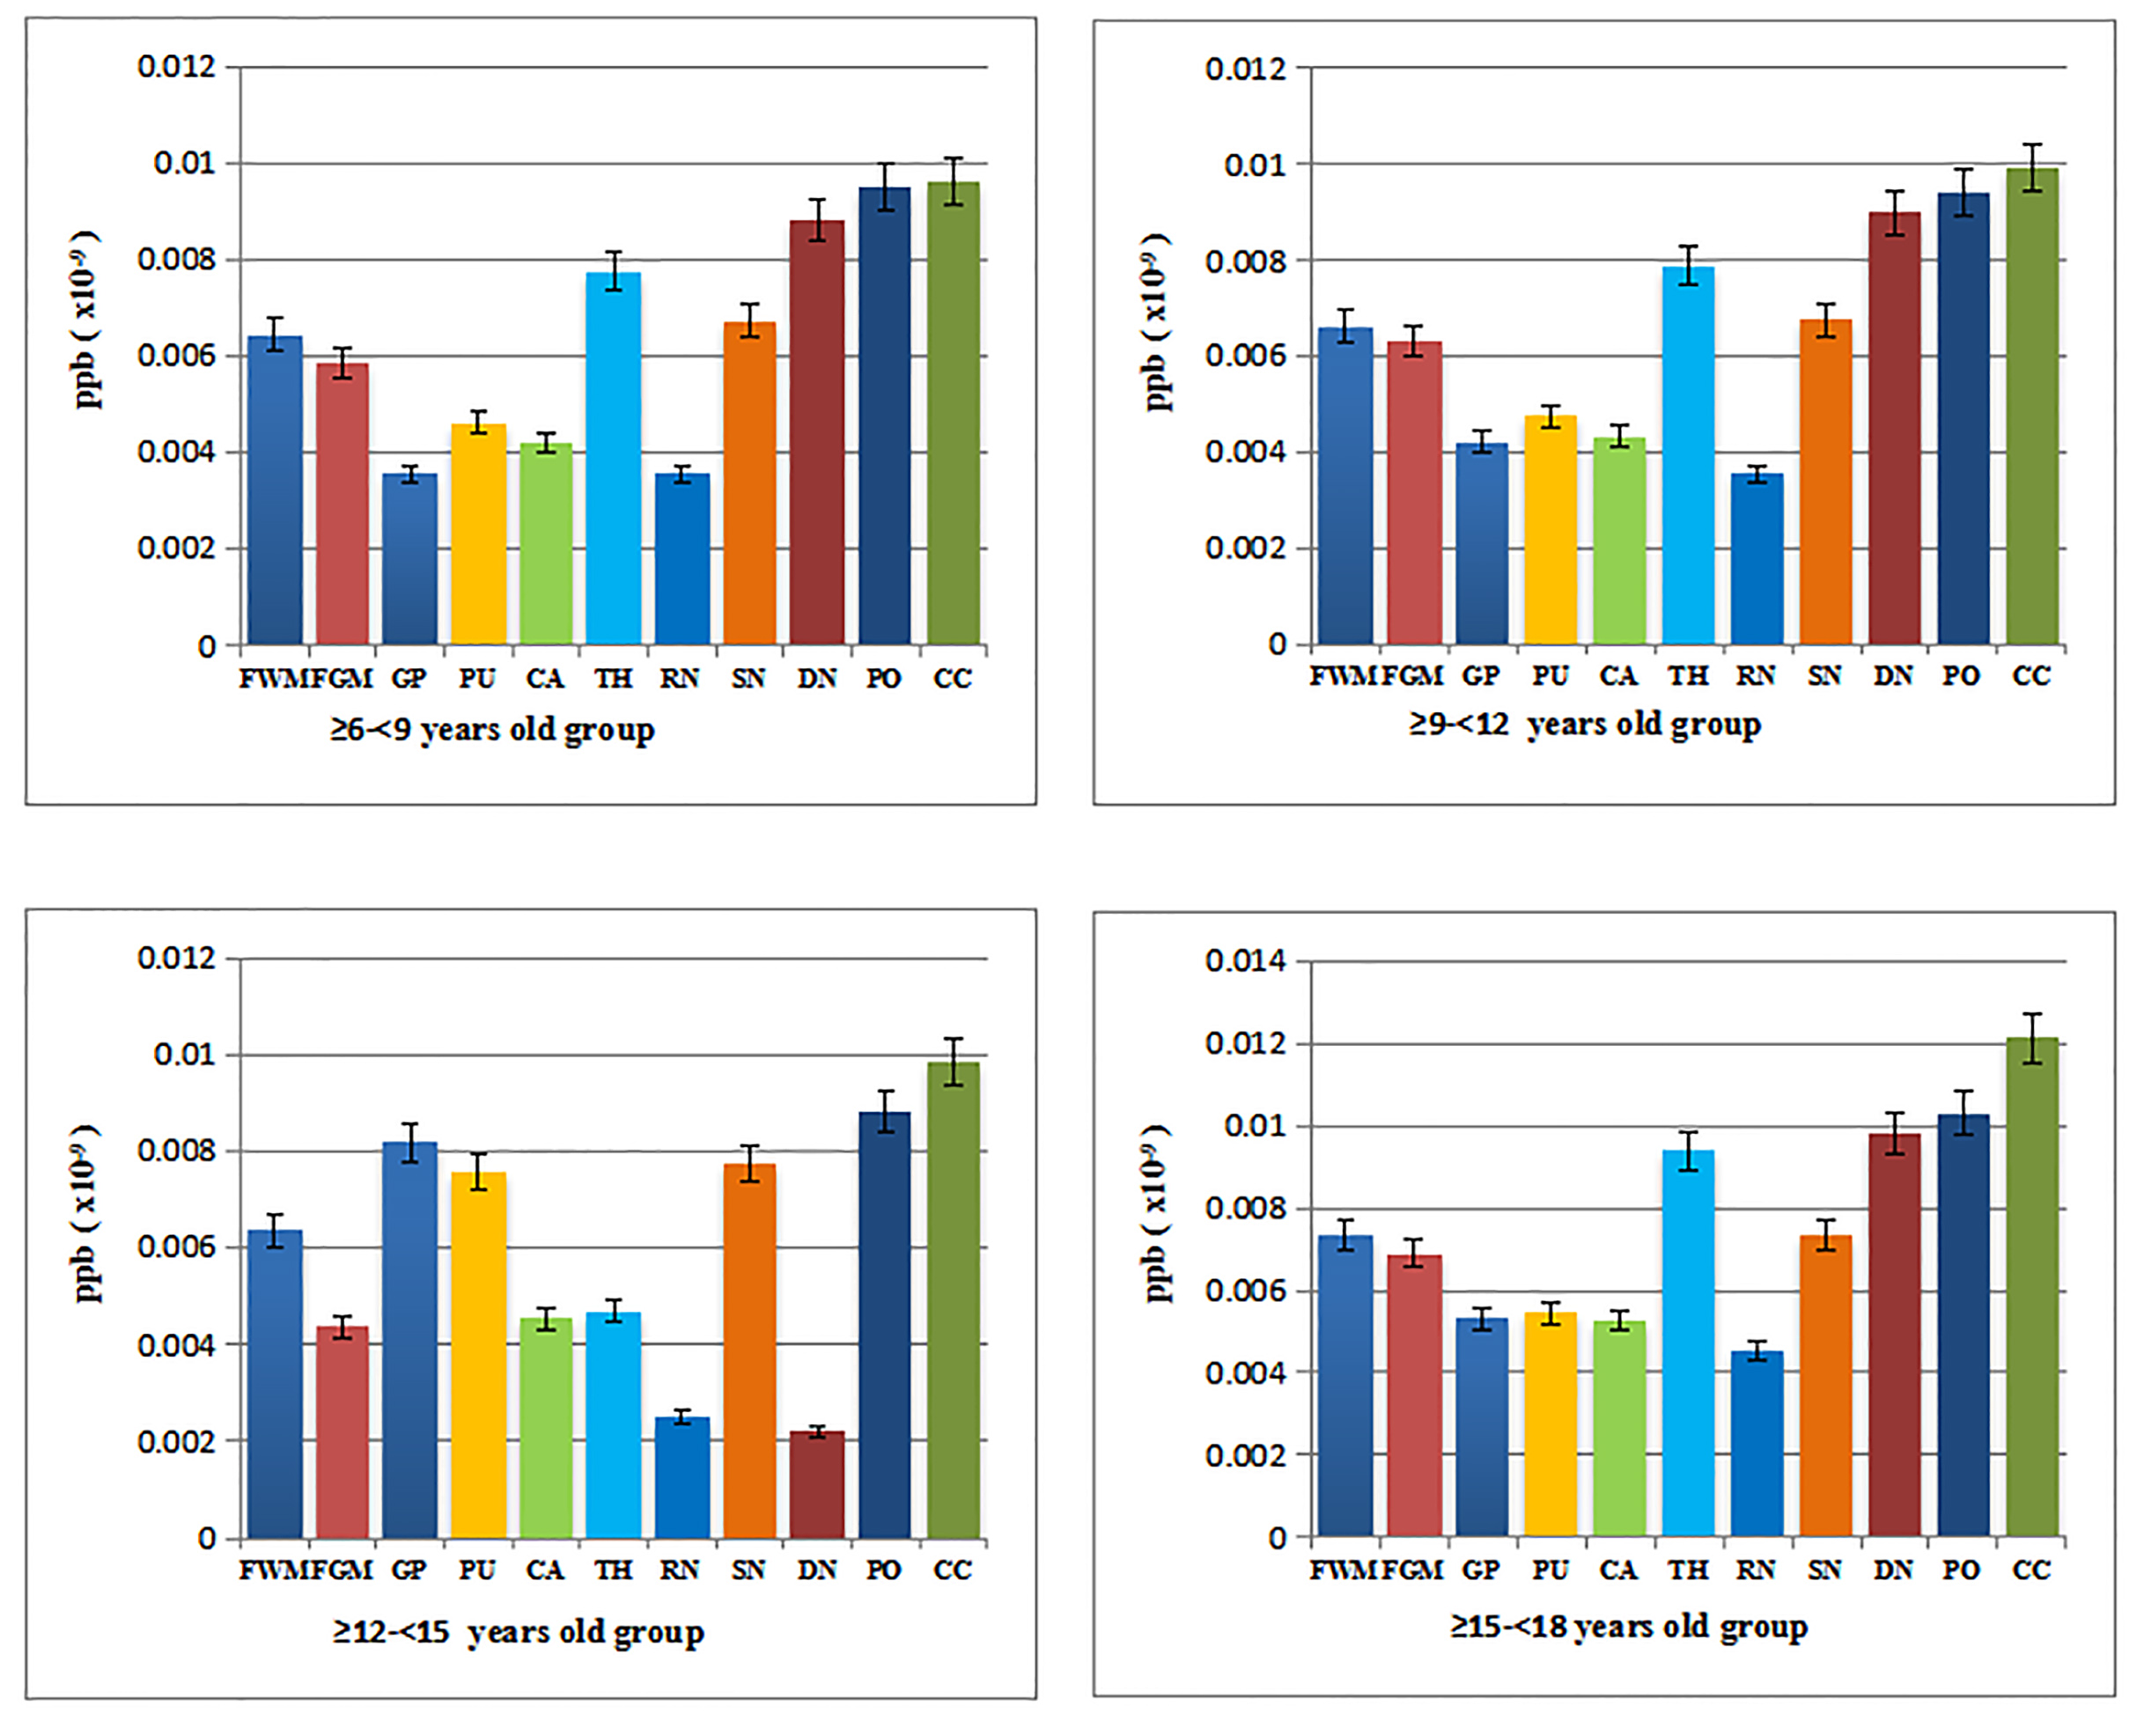
The magnetic susceptibility value of each brain region increased with age, and the magnetic susceptibility value of each brain region was positively correlated with the age of children(r=0.63, P<0.05). There was no significant difference in the magnetic susceptibility between the left and right sides of the brain in children aged ≥2-<6 years; however, for children aged ≥6-<18 years, the magnetic susceptibility values of the left putamen nucleus, globus pallidum and substantia nigra of children with the same age were higher than those of the right side(P<0.05).Discussion
This study found that the magnetic susceptibility values of various brain regions of children were positively correlated with age; the magnetic susceptibility values increased with age, probably because children are in a period of rapid growth and development during which brain iron content is known to increase rapidly. The study found that for children aged ≥2-<3 years, the dentate nucleus had the highest magnetic susceptibility value; for children aged ≥3-<6 years, the pons had the highest magnetic susceptibility value; and for children aged ≥6-<18 years, the splenium of corpus callosum had the highest magnetic susceptibility value. These results were not consistent with those of Drayer B et al. [5] that the globus pallidus of the normal adult brain had the highest magnetic susceptibility and white matter had the lowest magnetic susceptibility. This may be because children are in a period of rapid growth and development, and the increase in iron content in different brain regions may be inconsistent.This study found significant gender differences. For children aged ≥2-<3 years, the magnetic susceptibility values of the globus pallidus and caudate nucleus in the female group were greater than those in the male group (P<0.05). For children aged ≥3-<4 and ≥6-<12 years, the magnetic susceptibility values of the globus pallidus, putamen nucleus and caudate nucleus in the female group were greater than those in the male group (P<0.05). For children aged ≥4-<6 years, the magnetic susceptibility values of the globus pallidus, putamen nucleus and caudate nucleus in the male group were greater than those in the female group (P<0.05). For children aged ≥12-<18 years, the magnetic susceptibility values of the white matter, globus pallidus, putamen nucleus and caudate nucleus in the male group were greater than those in in the female group (P<0.05). This suggested that as children age, increased iron content in various brain regions may be inconsistent between male and female children.
The study found that there was no significant difference in magnetic susceptibility between the left and right sides of various brain regions of children aged ≥2-<6 years, indicating variation in iron content between the left and right sides of various brain regions of children younger than 6 years were consistent. The magnetic susceptibility values of the left side of the putamen nucleus, globus pallidus, and substantia nigra in children aged ≥6-<18 years were higher than those of the right side of children of the same age (P<0.05), indicating that change in iron content between the left and right sides of the brain may be inconsistent after the age of 6 years. This needs to be further verified in future studies.
Conclusions
This study characterized and established reference ranges for the iron content of various brain regions of normal children aged ≥2-<18 years in this region across age groups. The findings provide a reliable and objective reference for the diagnosis and treatment of some brain diseases in children.Acknowledgements
No acknowledgement found.References
[1]Yan F, He N, Lin H, et al.Iron deposition quantification: Applications in the brain and liver[J].J Magn Reson Imaging. 2018,48(2):301-317.
[2]Lyudmila Pivina, Yuliya Semenova, Monica Daniela Doşa, et al. Iron Deficiency, Cognitive Functions, and Neurobehavioral Disorders in Children.Journal of Molecular Neuroscience. (2019) 68:1–10
[3] Vallée L.Iron and Neurodevelopment.Arch Pediatr. 2017,24(5S):5S18-5S22
[4] Tiepolt S, Schäfer A, Rullmann M, Roggenhofer E; Netherlands Brain Bank, Gertz HJ, Schroeter ML, Patt M, Bazin PL, Jochimsen TH, Turner R, Sabri O, Barthel H. Quantitative Susceptibility Mapping of Amyloid-β Aggregates in Alzheimer's Disease with 7T MR.J Alzheimers Dis. 2018,64(2):393-404.
[5] Dayer B,Burger P,Darwin R,et al. MRI of brain iron.AJR Am J Roentgenol,1986,147(1):103-110
Figures