1295
Regional Brain Perfusion Changes in Cognition and Mood Regulatory Sites in Patients with Type 2 Diabetes Mellitus1Anesthesiology, University of California Los Angeles, Los Angeles, CA, United States, 2School of Nursing, University of California Los Angeles, Los Angeles, CA, United States, 3Medicine, Endocrinology - Diabetes and Metabolism, University of California Los Angeles, Los Angeles, CA, United States, 4Bioengineering, University of California Los Angeles, Los Angeles, CA, United States, 5Radiological Sciences, University of California Los Angeles, Los Angeles, CA, United States, 6Brain Research Institute, University of California Los Angeles, Los Angeles, CA, United States
Synopsis
Patients with Type 2 diabetes mellitus (T2DM) show cognitive and mood changes, and brain tissue injury in those regulatory regions. However, underlying cause of tissue damage in cognition and mood regulatory sites, and their associations with these functional deficits in T2DM remain unclear. We evaluated cerebral blood flow (CBF) in T2DM patients over controls, and found changes in the frontal and prefrontal cortices, cerebellum, hippocampus, cingulate, insula, thalamus, and basal-forebrain, sites involved regulating mood and cognition. Significant correlations emerged between CBF and functional deficits in T2DM, including mood and cognition symptoms, implying the altered hemodynamic contributing to the functional deficits.
INTRODUCTION
Type 2 diabetes mellitus (T2DM) patients show significant brain volume loss and tissue injury in various cognitive and mood control areas, functions that are deficient in the condition.1-6 Cognitive and mood dysfunctions are associated with reduced self-care and increased morbidity and mortality and reduced quality of life in T2DM patients. However, the underlying cause of brain volume loss and tissue injury in T2DM patients is unknown. Reduced cerebral blood flow (CBF) may lead to regional brain tissue changes, contributing to cognitive and mood deficits, but regional CBF status in cognitive and mood regulatory areas and relationships between hemodynamic alterations and mood and cognitive symptoms are not examined in T2DM patients. Regional brain CBF can be assessed by MRI based arterial spin labeling (ASL) imaging procedures. ASL imaging is a non-invasive approach, without use of radiation or contrast agents, for assessment of regional brain perfusion changes. ASL-based CBF values have been validated with positron emission tomography, and shown to be reproducible, making it favorable for regional CBF evaluation in T2DM patients. Our aim was to examine regional brain CBF changes in mood and cognitive control areas in T2DM over age- and sex- matched control subjects using 3D pseudo-continuous ASL procedures, and evaluate the relationships between cognitive and mood scores and regional CBF values in T2DM patients.METHODS
We examined 32 T2DM [age, 57.1±7.0 years; body-mass-index (BMI), 29.8±5.6 kg/m2; 19 female] and 14 healthy control subjects (age, 54.8±8.1years; BMI, 26.5±5.2 kg/m2; 9 female) using a 3.0-Tesla MRI (Siemens, Magnetom, Prisma Fit). Cognition, depressive, and anxiety symptoms were evaluated using the Montreal cognitive assessment (MoCA), Beck Depression Inventory (BDI-II), and Beck Anxiety Inventory (BAI), respectively in T2DM and control subjects and scores were compared between groups (SPSS; ANCOVA; covariates, age and sex). 3D pseudo-continuous ASL [pCASL] (TR = 4,000 ms, TE = 36.7 ms, FA = 120°, bandwidth = 2365 Hz/pixel, matrix size = 96×96, FOV = 240×240 mm, slice thickness = 2.5 mm) data were collected. Using the labeled and non-labeled ASL brain volumes, perfusion images were computed, and whole-brain CBF maps were generated. Whole-brain CBF maps were normalized to a common space, smoothed, and voxel-by-voxel CBF changes were assessed between T2DM and control subjects (SPM12; ANCOVA; covariates, age and sex; p<0.05]. The whole-brain CBF maps were correlated voxel-by-voxel with BAI, BDI-II, and MoCA scores in T2DM patients using partial correlations (SPM12; covariates, age and sex, p<0.005). Brain clusters with significant differences between groups and correlations between CBF values and BAI, BDI-II, and MoCA scores were overlaid onto background images for structural identification.RESULTS
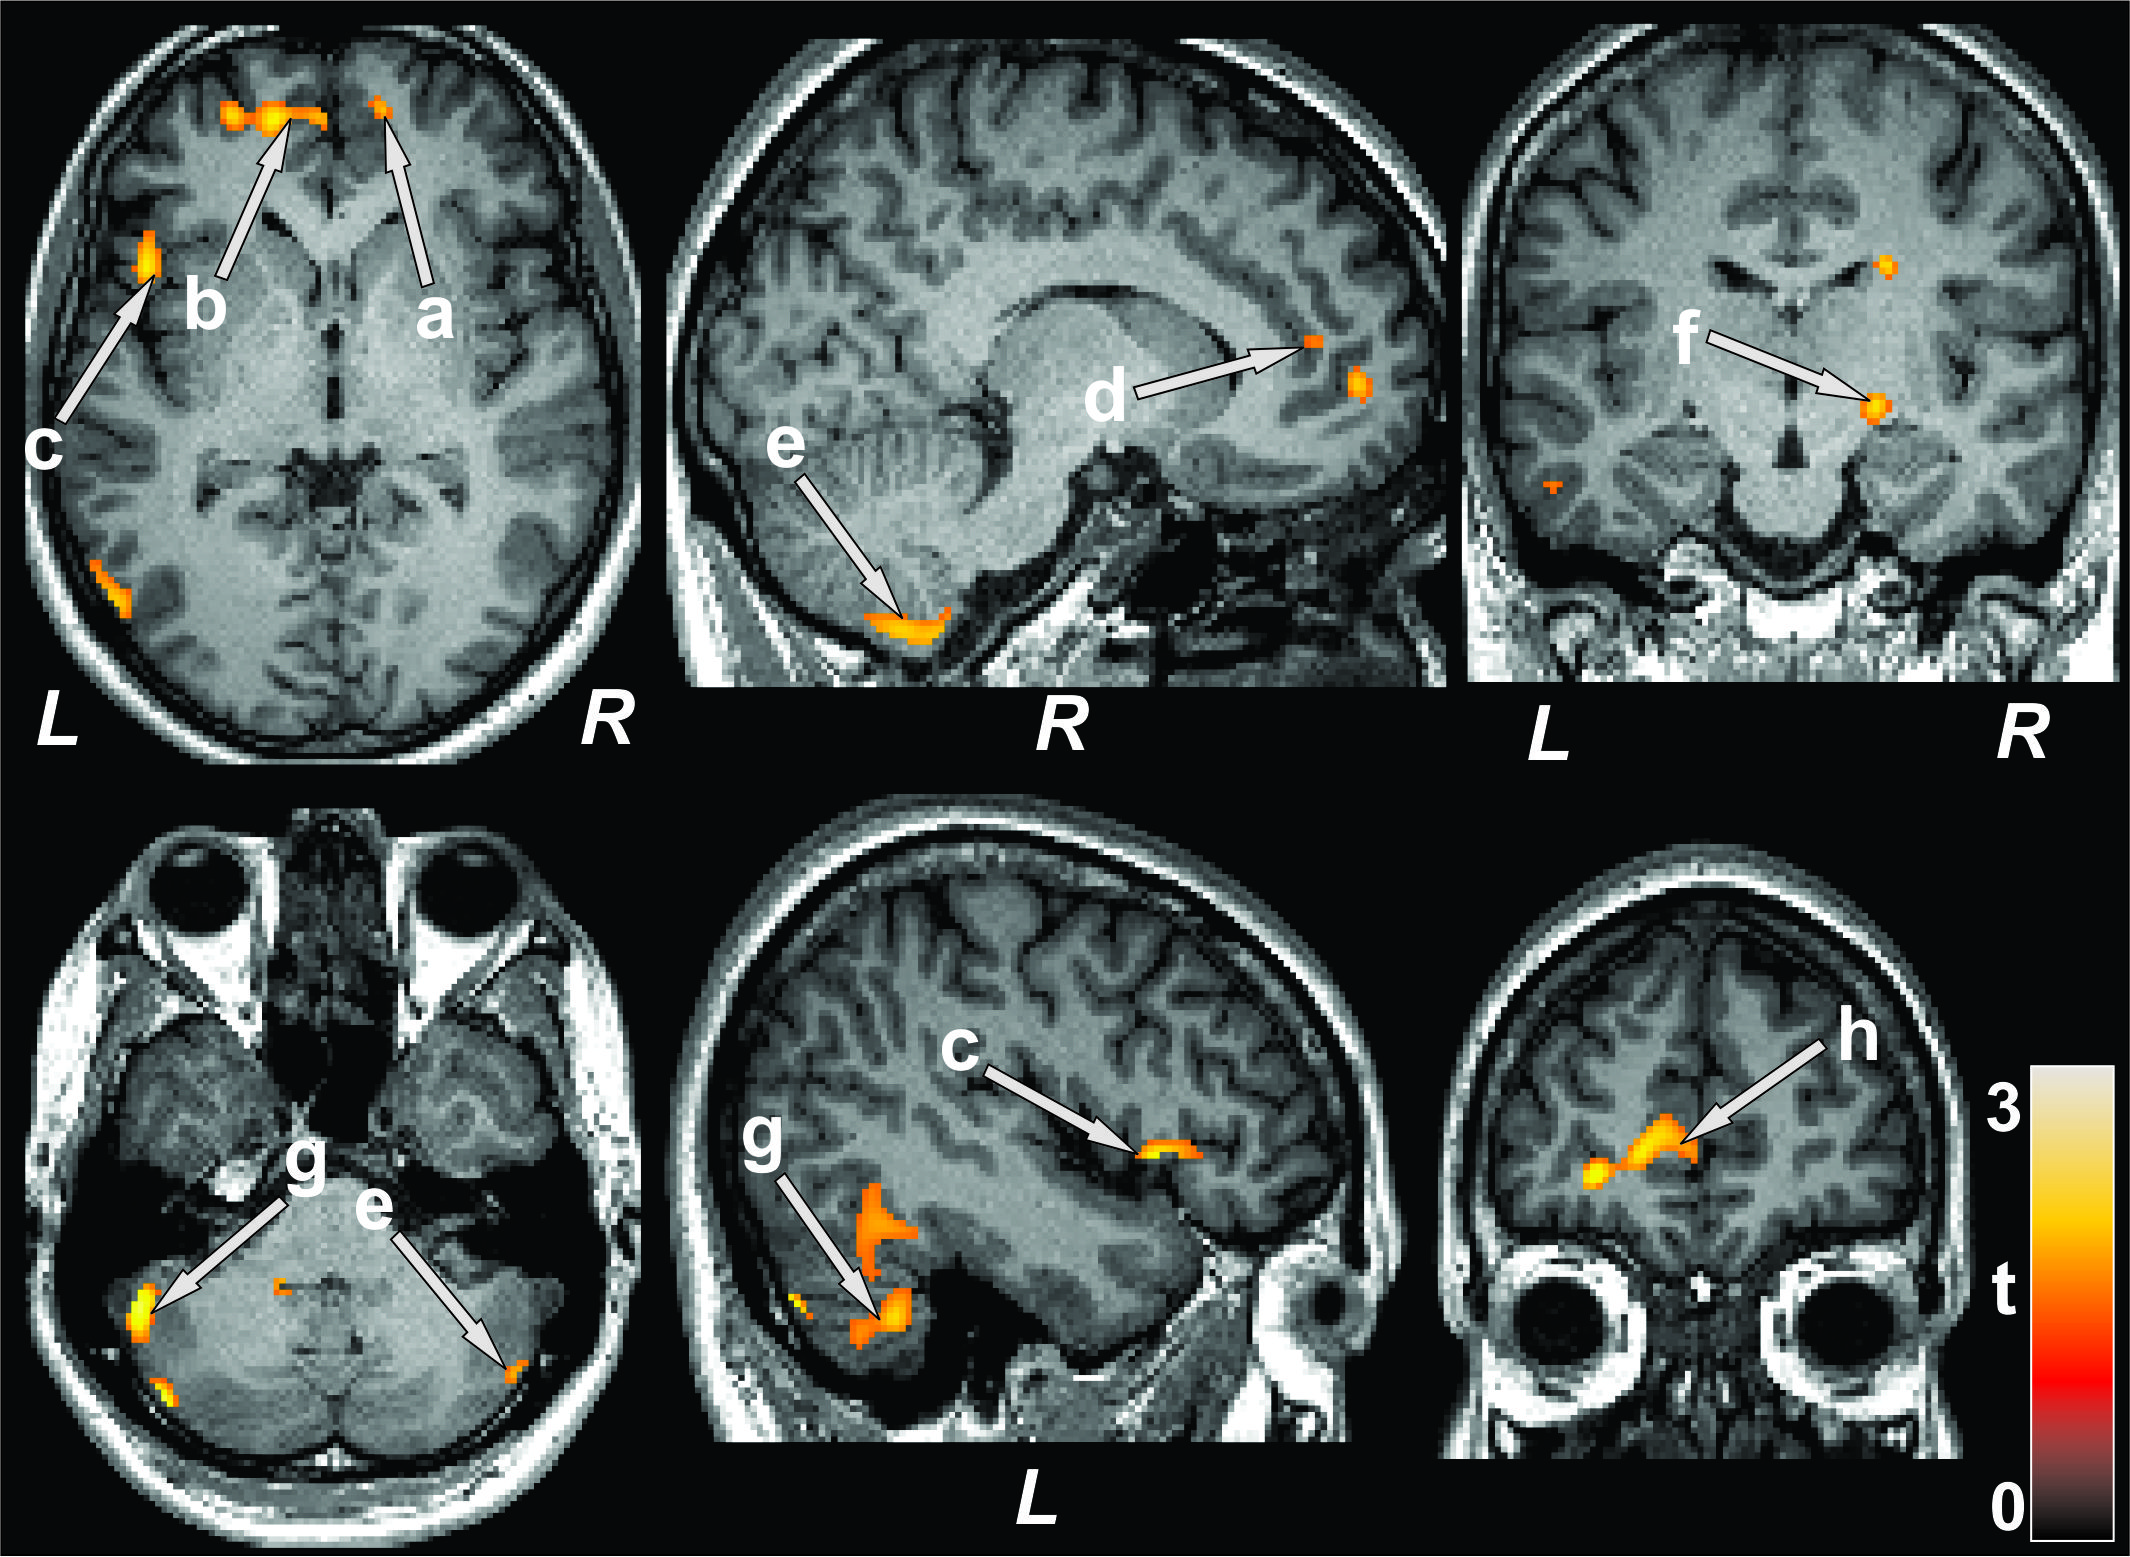
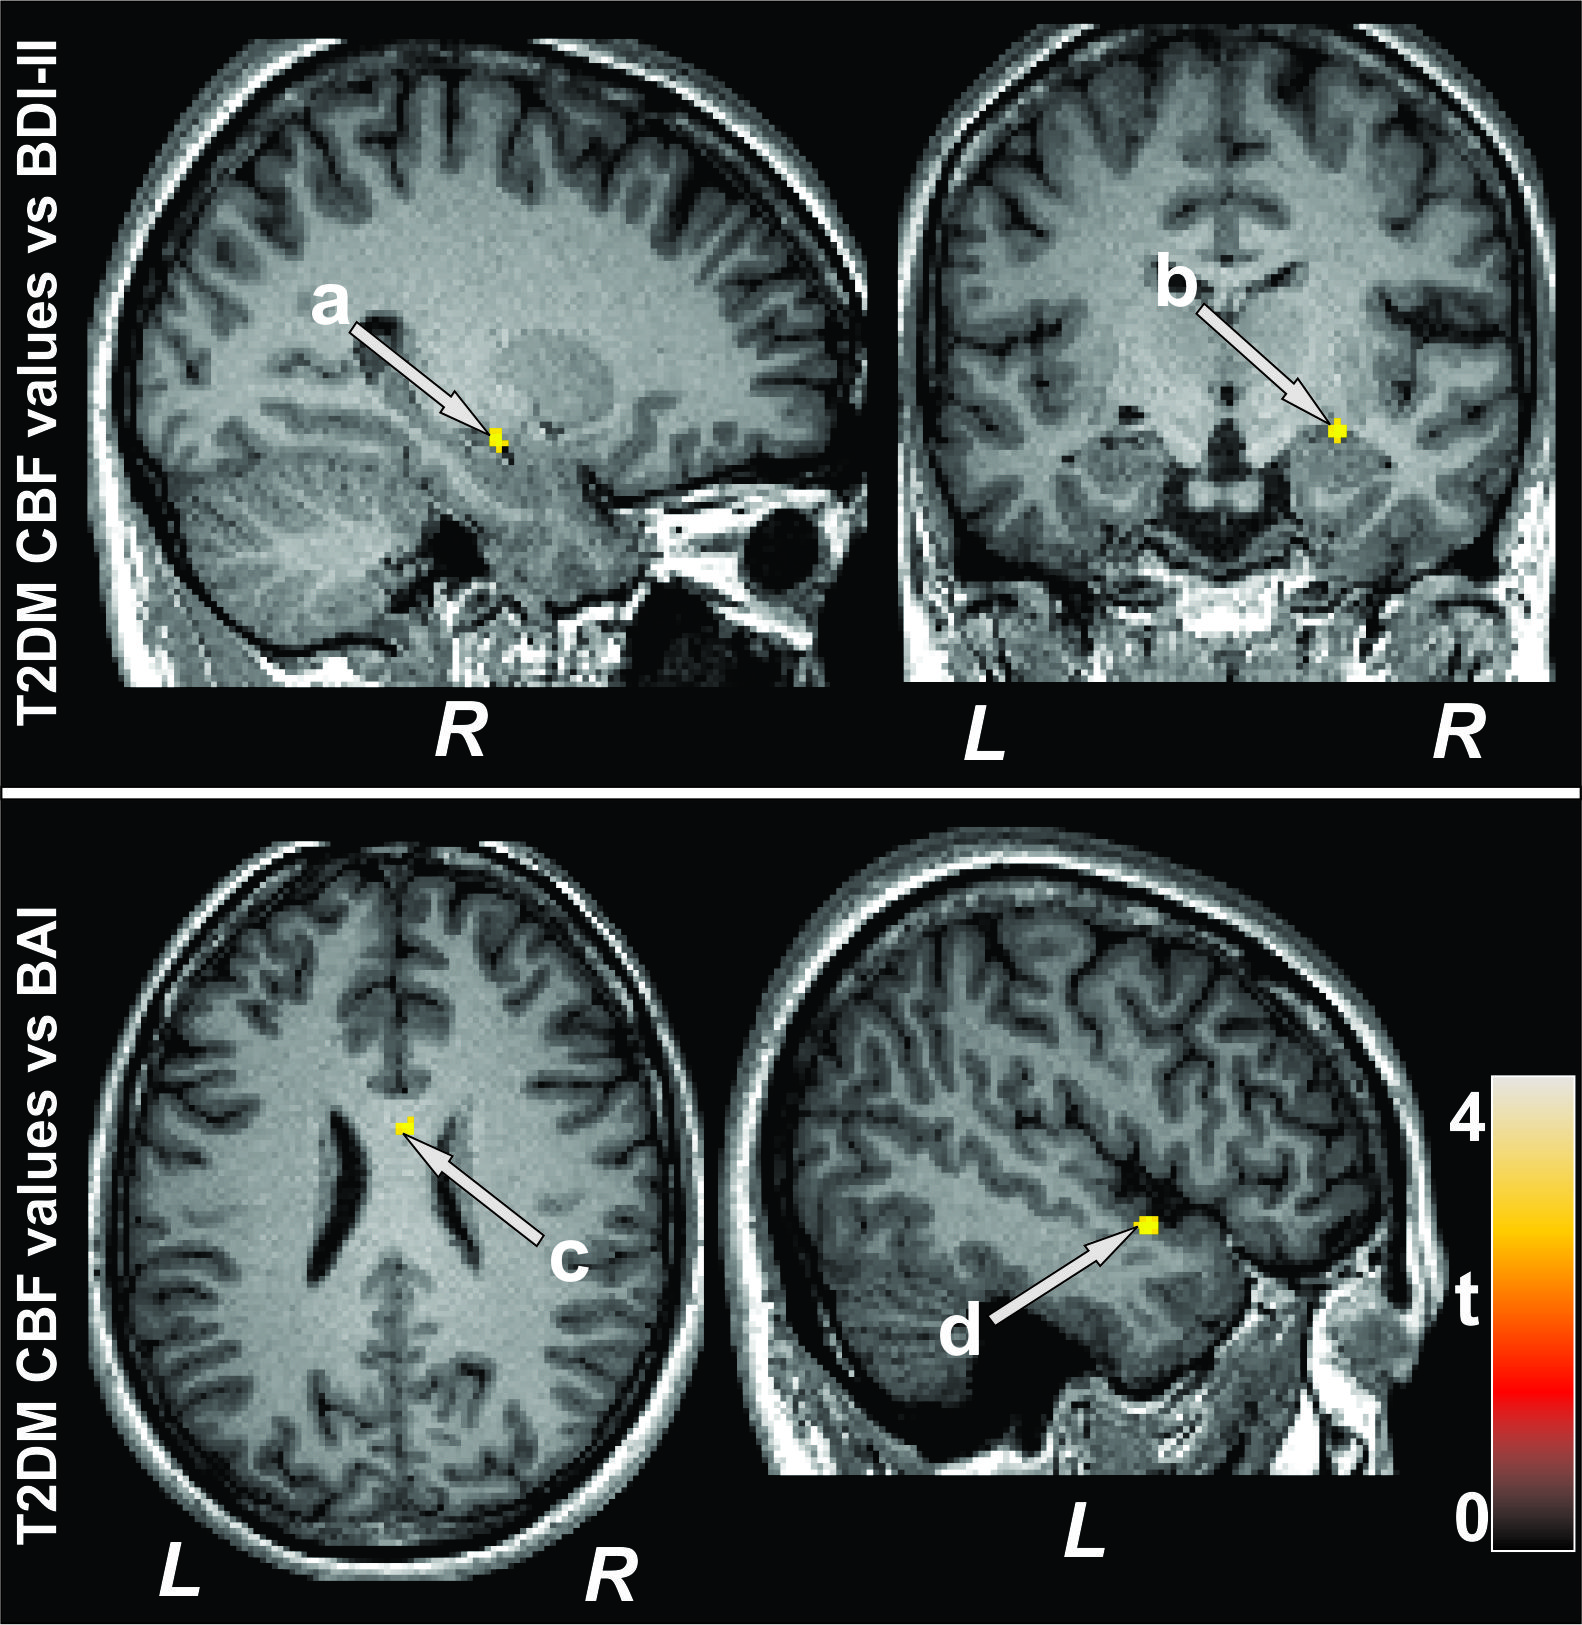
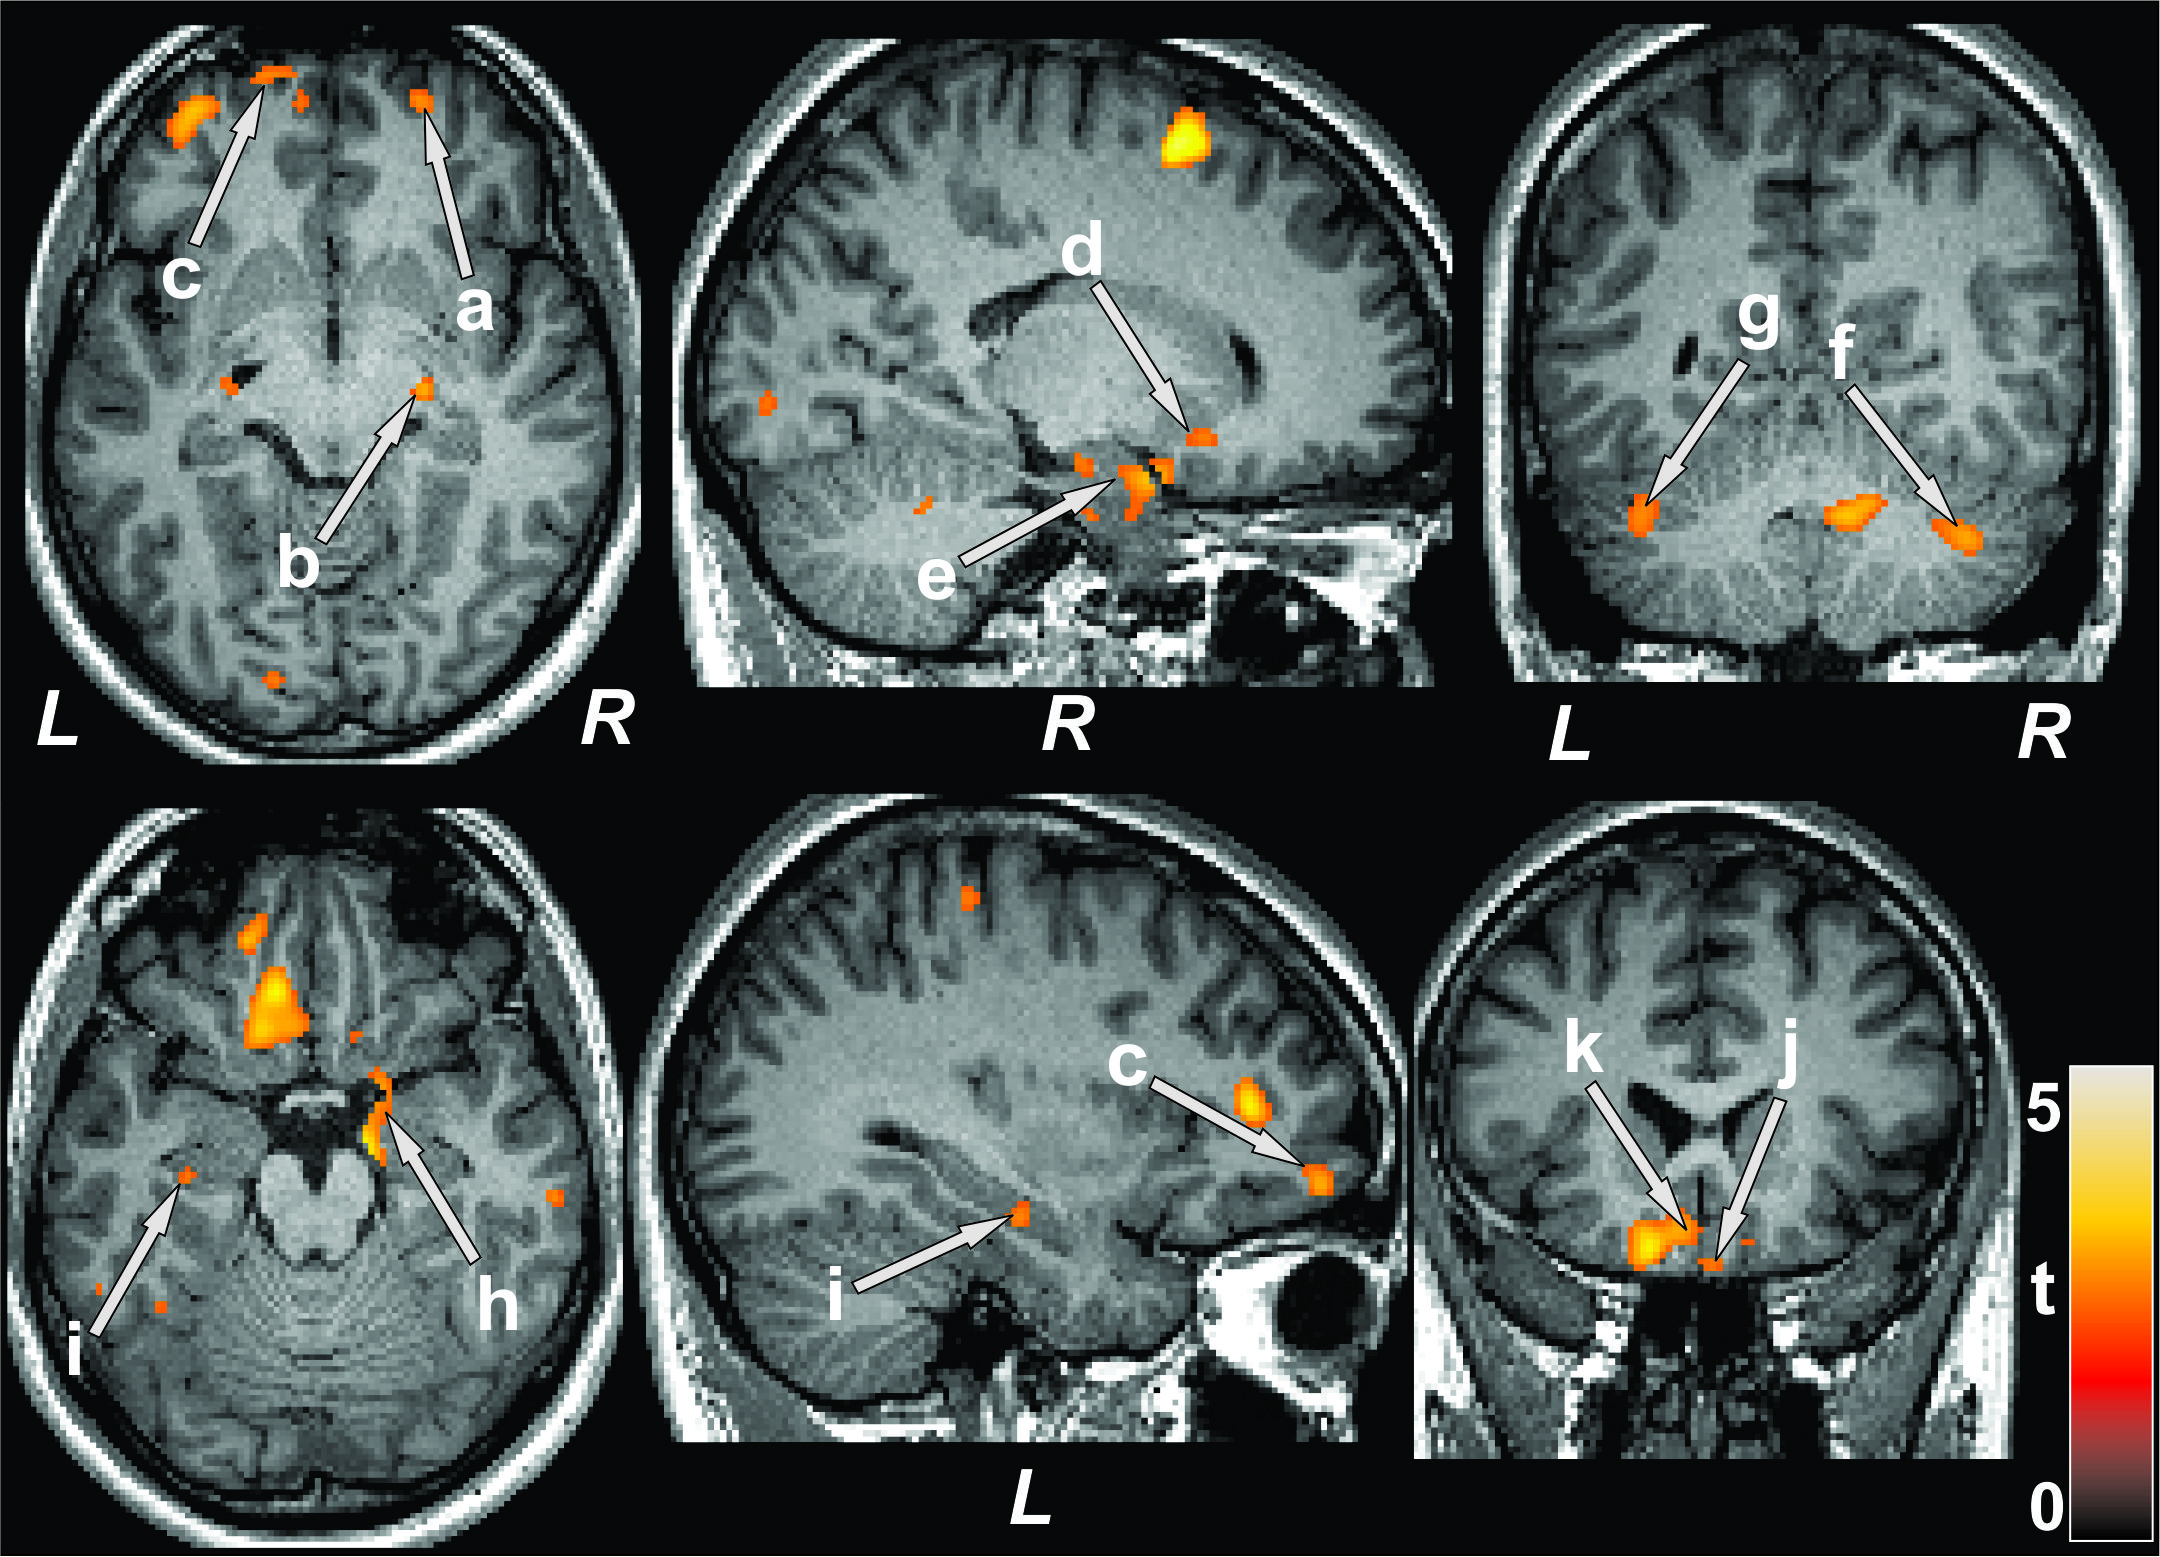
No significant differences in age, sex, or BMI emerged between T2DM and control subjects (age, p=0.35; sex, p=0.07; BMI, p=0.75). T2DM patients had significantly higher BDI-II (p=0.02) and lower global MoCA scores (p=0.001) compared to control subjects. However, BAI did not significantly differ between groups. Multiple brain areas showed reduced regional CBF values in T2DM compared to control subjects (Fig.1), including the prefrontal cortices, cerebellum, cerebellar tonsil, insula, cingulate, corpus callosum, putamen, hippocampus, basal-forebrain, thalamus, frontal cortex, temporal, and parietal gyrus. Anxiety scores showed negative associations with CBF values of the insula and corpus callosum in T2DM subjects (Fig. 2). Negative relationships were observed in T2DM subjects between depression scores and CBF values of the amygdala, hippocampus, basal forebrain, pons, and temporal cortices (Fig. 2), and positive correlations emerged between global MoCA scores and CBF values of the prefrontal cortices, cerebellum, cerebellar tonsil, cingulate, putamen, hippocampus, amygdala, basal-forebrain, thalamus, frontal cortex, temporal, occipital, and parietal gyrus (Fig. 3).DISCUSSION
T2DM patients showed significantly reduced CBF in multiple brain areas, including the frontal and prefrontal cortices, cerebellum, hippocampus, cingulate, insula, thalamus, basal forebrain, and putamen, sites that are involved in mood and cognition regulation, functions that are predominately diminished in T2DM patients compared to control subjects. Within the T2DM group, cognitive scores were inversely correlated to the CBF values, and associations were also found between CBF values and mood scores. The findings suggest that changes in cognition and mood functions may result from altered hemodynamics in those regulatory sites in the condition. The pathophysiology underlying reduced CBF in T2DM subjects may involve disruption of cerebrovascular autoregulation related to vascular risk factors in the condition.CONCLUSION
T2DM patients have cognitive and mood dysfunctions associated with reduced CBF in brain regions regulating these functions. The findings indicate that the functional deficits found in T2DM may stem from hemodynamic alterations arising from underlying vascular dysfunction associated with the condition.Acknowledgements
This work was supported by the National Institutes of Health 1R01 NR017190-03 and 3R01 NR017190-03S1.References
1. Gavard JA, Lustman PJ, Clouse RE. Prevalence of depression in adults with diabetes. An epidemiological evaluation. Diabetes Care. 1993;16:1167-1178.
2. Watari K, Letamendi A, Elderkin-Thompson V, et al. Cognitive function in adults with type 2 diabetes and major depression. Arch Clin Neuropsychol. 2006;21:787-796.
3. Chen Z, Li L, Sun J, et al. Mapping the brain in type II diabetes: Voxel-based morphometry using DARTEL. Eur J Radiol. 2012;81:1870-1876.
4. Moran C, Phan TG, Chen J, et al. Brain atrophy in type 2 diabetes: regional distribution and influence on cognition. Diabetes Care. 2013;36:4036-4042.
5. Zhang Y, Zhang X, Zhang J, et al. Gray matter volume abnormalities in type 2 diabetes mellitus with and without mild cognitive impairment. Neurosci Lett. 2014;562:1-6.
6. Gold SM, Dziobek I, Sweat V, et al. Hippocampal damage and memory impairments as possible early brain complications of type 2 diabetes. Diabetologia. 2010;53:2298-2306.
Figures