1293
Altered intrinsic brain functional network dynamics in patients with end-stage renal disease undergoing maintenance hemodialysis1Huaxi MR Research Center (HMRRC), Department of Radiology, West China Hospital of Sichuan University, Chengdu, China, 2Department of Nuclear Medicine, West China Hospital of Sichuan University, Chengdu, China, 3Psychoradiology Research Unit of Chinese Academy of Medical Sciences (2018RU011), Chengdu, China
Synopsis
Although patients with end-stage renal disease (ESRD) have shown disrupted connectivity within and between resting-state functional networks, the patterns of change in dynamic functional network connectivity (FNC) remain unclear. The present work is the first study to investigate the dynamic functional connectivity in patients with ESRD. Patients with ESRD showed state-specific FNC disruptions and altered dynamic FNC properties. Furthermore, the total number of transitions was related to cognitive performance in those patients. These findings provided new insights into the pathophysiological mechanism of their cognitive deficits.
Introduction
Patients with end-stage renal disease (ESRD) who received maintenance hemodialysis (MHD) treatment often exhibit deficits in cognitive function, especially in the domains of orientation, attention and executive function 1. Cognitive impairment (CI) in those patients may contribute to long-term adverse consequences, including dementia and death, and is also associated with increased cost of medical care 2,3. In recent years, resting-state functional magnetic resonance imaging (Rs-fMRI) technique has become a valuable and non-invasive tool to investigate the pathophysiological mechanisms of CI in patients with ESRD. Previous studies have demonstrated disrupted within and between functional network connectivity (FNC) in patients with ESRD 4-6. However, the patterns of change in dynamic FNC remain unclear. Thus, we aimed to investigate the dynamic FNC properties in patients with ESRD who underwent MHD.Methods
This prospective study included 66 patients with ESRD (ESRD group; 36 males and 30 females; mean age 33.92 ± 8.54 years, range from 19 to 47 years) and 47 healthy controls (HC group; 25 males and 22 females; mean age 32.02 ± 7.88 years, range from 19 to 46 years). All subjects underwent MR imaging on a 3T GE Discovery MR750 scanner with a 16-channel head coil. The Rs-fMRI data were obtained using a gradient-echo echo-planar imaging sequence. After data preprocessing, group-level independent component analysis was used to identify intrinsic connectivity networks. Then, dynamic functional connectivity was calculated using a sliding window approach. Next, functional connectivity state analysis was performed to calculate temporal properties of dynamic FNC states, including the fractional windows, mean dwell time, and total number of transitions. Finally, a graph theory method was applied to examine variability of global topological metrics of the FNC. In addition, we estimated the relationships between those dynamic FNC parameters showing significant between-group differences and the clinical variables in the ESRD group. Group differences in dynamic FNC parameters were tested using an independent two-sample t-test or a Mann-Whitney U-test. A partial correlation analysis was used to estimate the relationships between those dynamic FNC parameters showing significant between-group differences and the clinical variables in the ESRD group, and the results were corrected by false discovery rate method 7. Statistical significance was defined as p < 0.05.Results
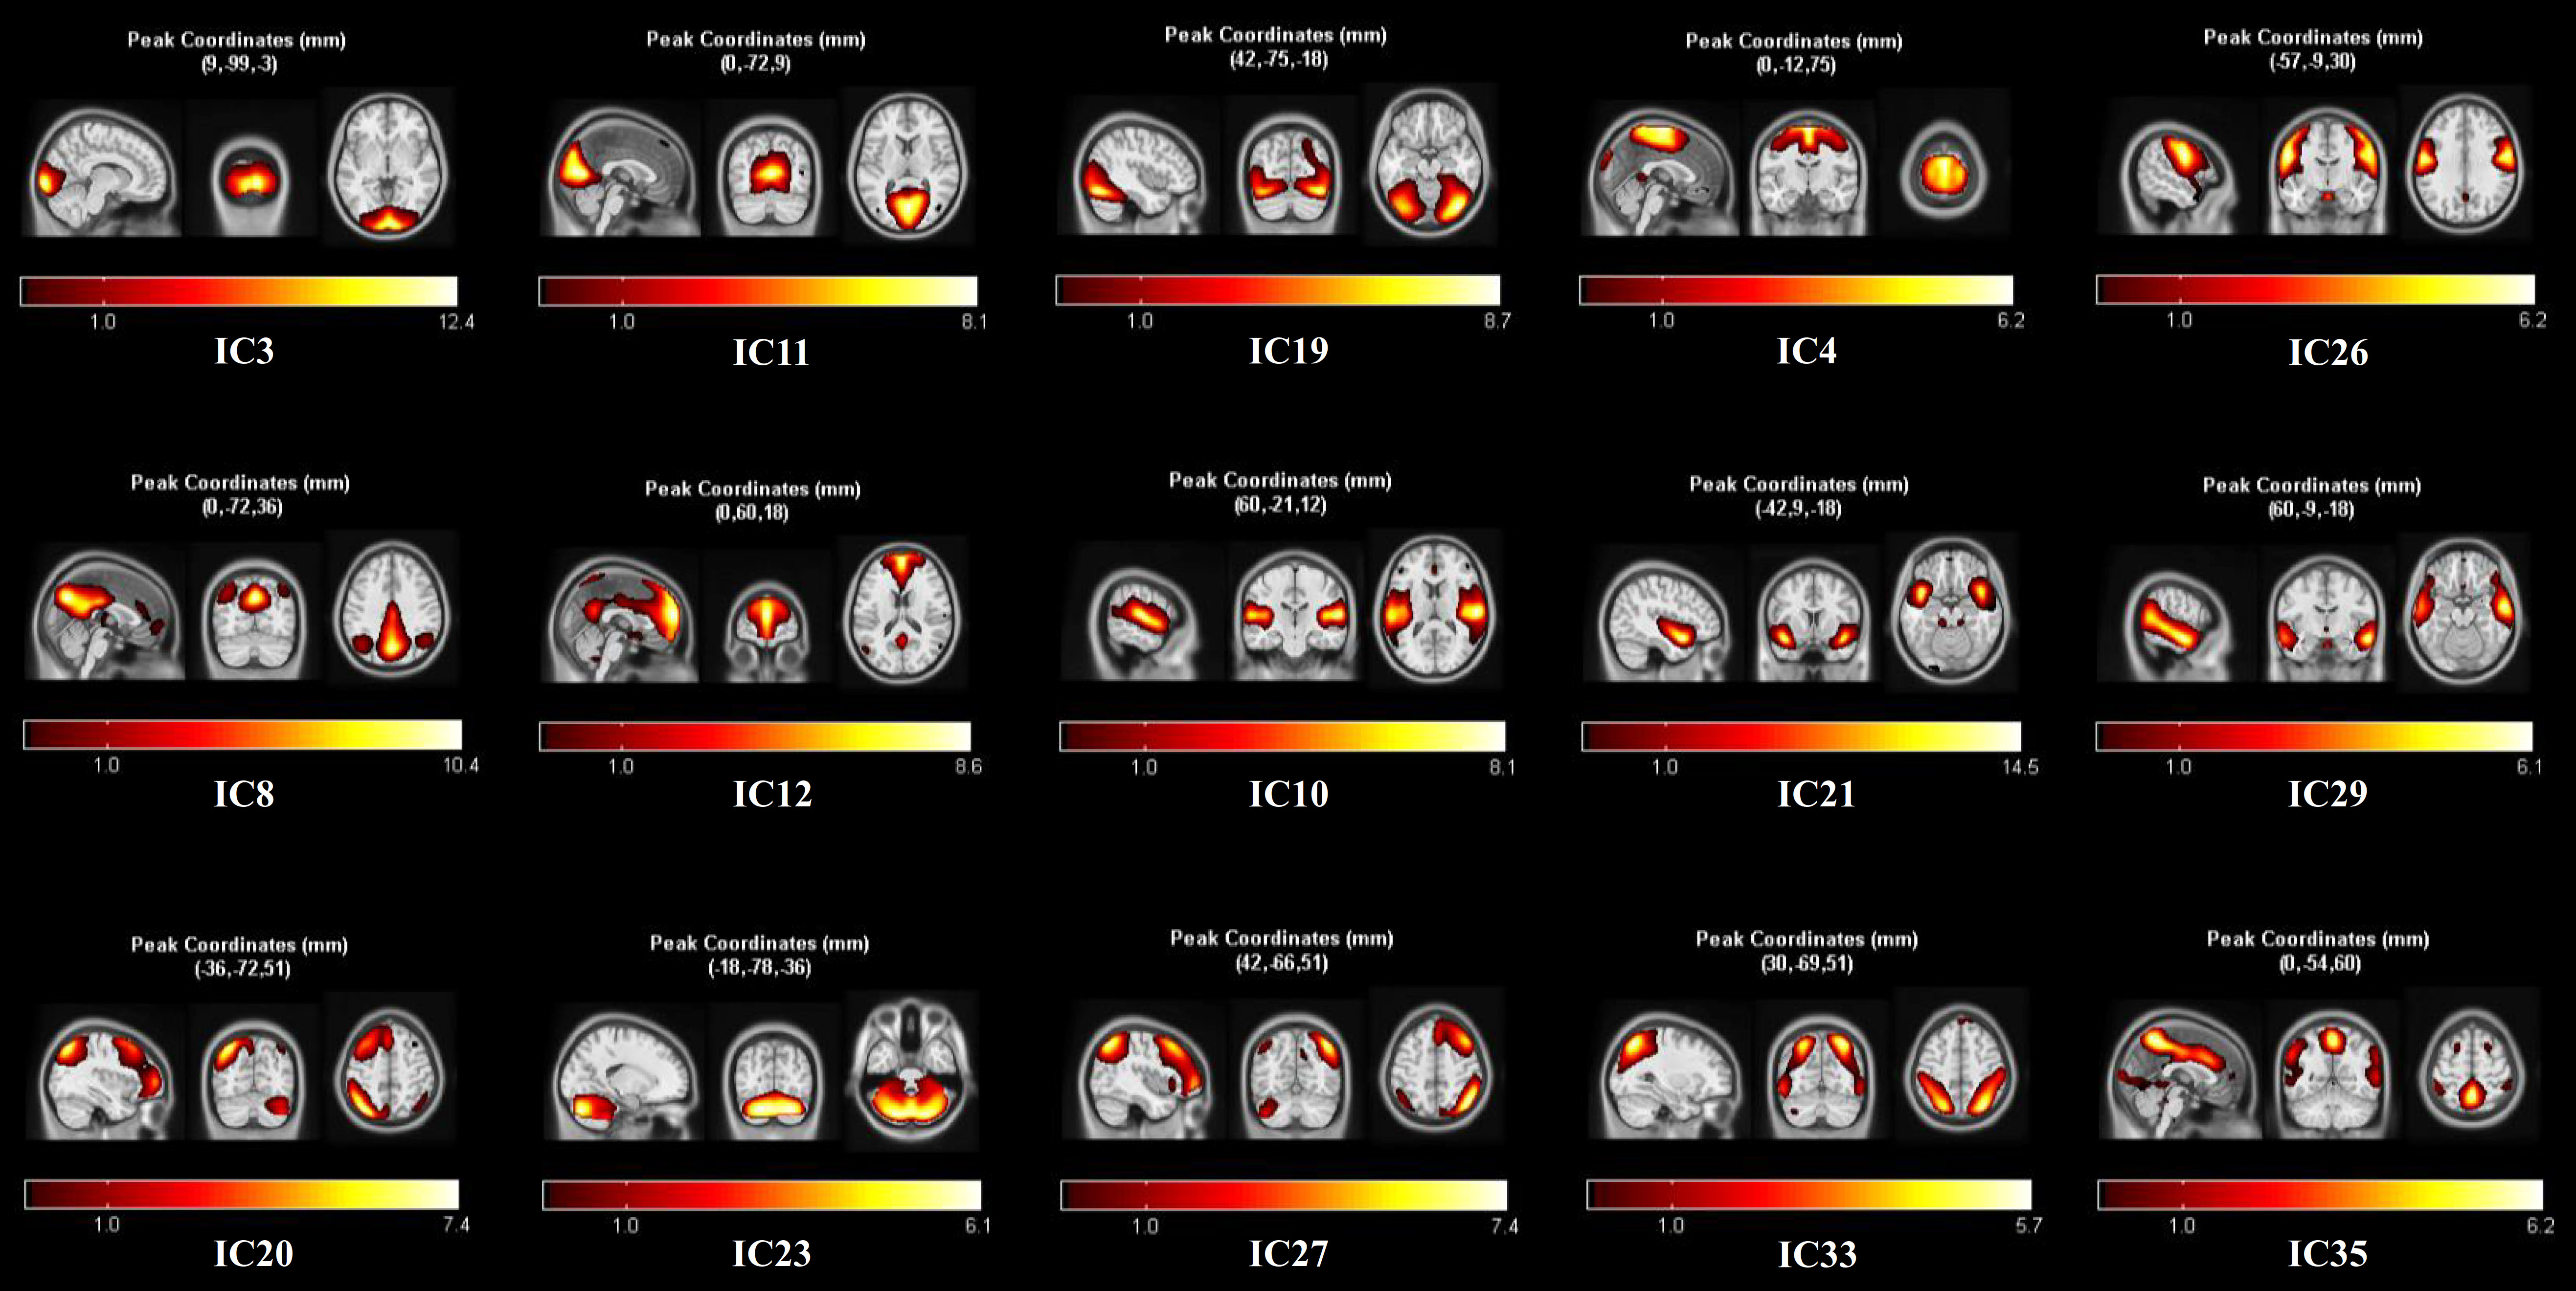
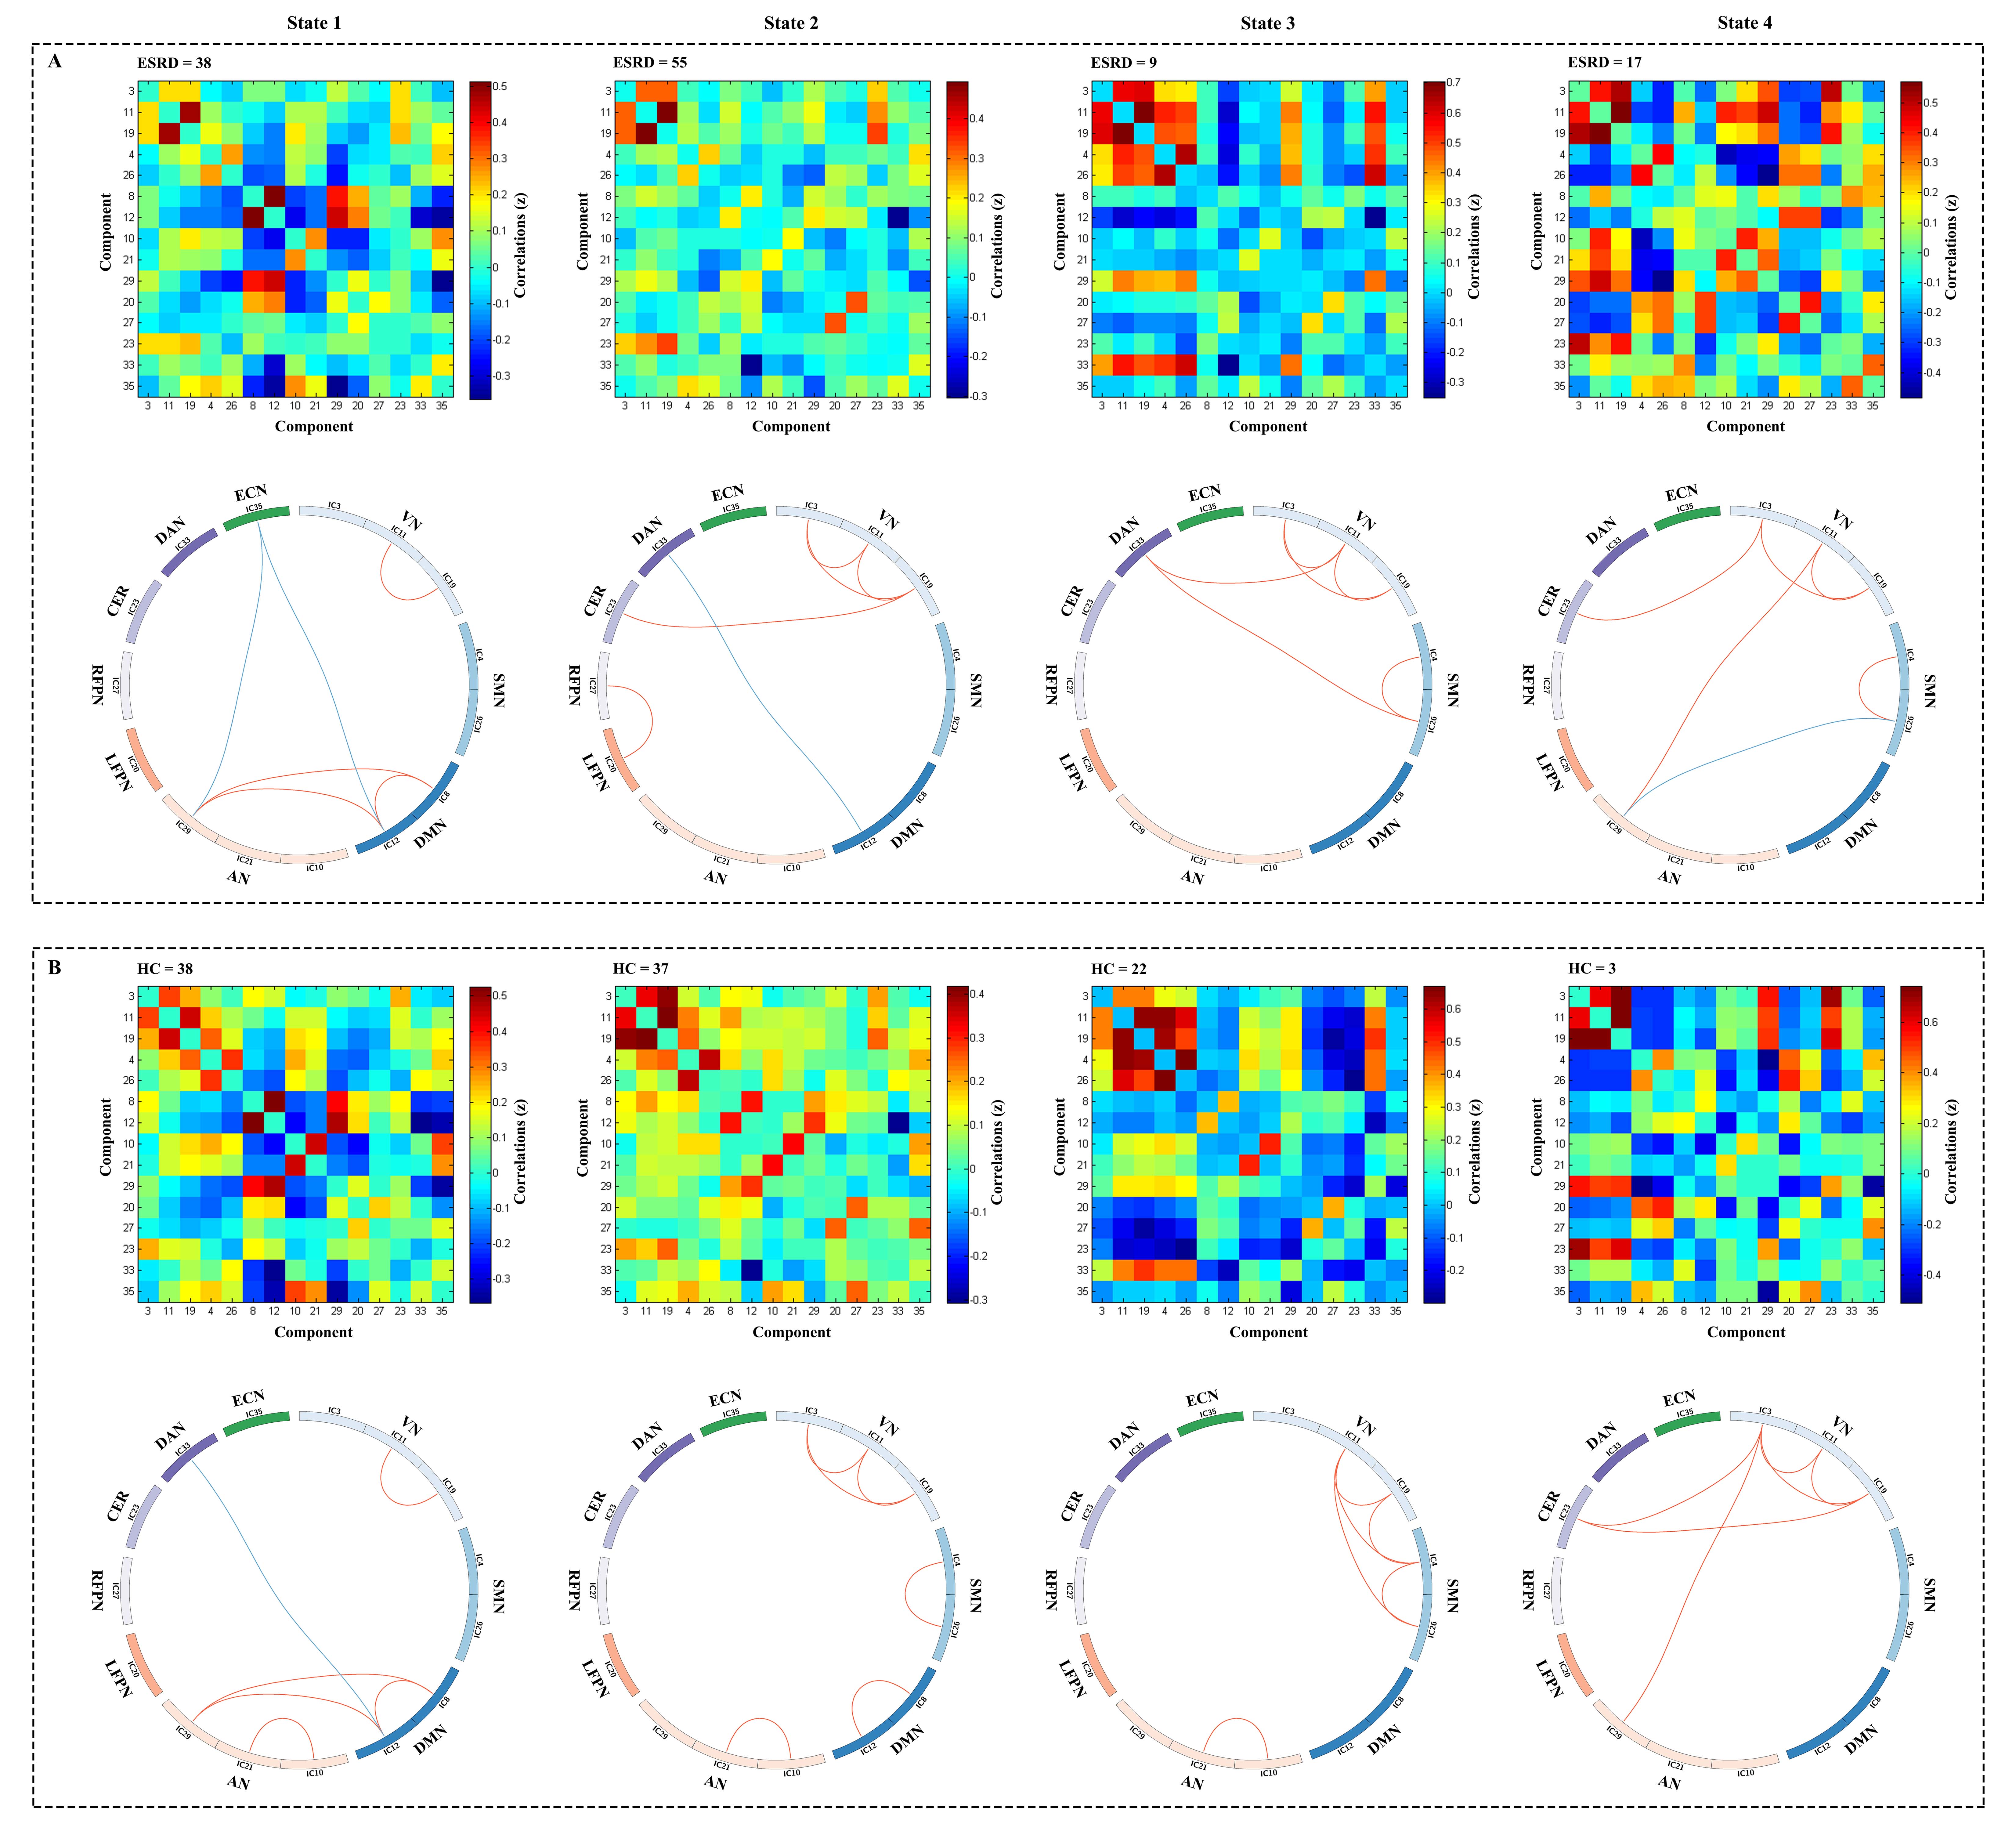
There were no significant differences in age, sex and educational level between the two groups (all p > 0.05) (Fig. 1). Fifteen independent components (ICs) were identified as meaningful (Fig. 2), and those ICs were sorted into nine resting-state networks: visual network, sensorimotor network, default mode network, auditory network, left frontoparietal network, right frontoparietal network, cerebellum, dorsal attention network, and executive control network. As shown in Fig. 3, we identified four highly structured FNC states that recurred throughout individual scans and across subjects using the k-means clustering algorithm. The group-specific medians for each state are shown in Fig. 4. Notably, not all subjects had the windows assigned to each state, which contributed to changes of the number of subject-specific matrices in different states. In the ESRD group, State 3 occurred less frequently, and State 4 re-occurred at a higher rate (Fig. 5A). Compared with HCs, patients with ESRD had decreased time in State 3, increased time in State 4, and increased total number of transitions across states (Fig. 5B-C). In addition, the ESRD group showed a lower variance in the normalized clustering coefficient (p = 0.021). Furthermore, the total number of transitions across states was negatively correlated with the completion time of Trail Making Test A (Fig. 5D), and was positively related with the Symbol Digit Modalities Test scores in the ESRD group (Fig. 5E).Discussion
By using Rs-fMRI in combination with FNC state analysis and graph theory analysis, the present study analyzed the dynamic FNC alterations in patients with ESRD undergoing MHD, focusing on the temporal properties of FNC states and the variance in network topological organization. To the best of our knowledge, this is the first study to characterize the patterns of change in dynamic FNC in patients with ESRD. The main findings of our study were as follows: 1) four discrete connectivity configurations were identified across all subjects; 2) state-specific aberrant network interactions between RSNs were observed in the ESRD group; 3) altered dynamic properties were found in the ESRD group, involving the mean dwell time and fractional windows in State 3 and 4, and the total number of transitions across states; 4) patients with ESRD showed lower variance in normalized clustering coefficient γ than HCs; 5) significant correlations between altered dynamic metrics and clinical characteristics were seen in patients with ESRD. These findings provide new insights into the pathophysiological mechanisms underlying CI in those patients, and underscore the importance of evaluating dynamic changes of brain connectivity.Conclusion
This study demonstrated abnormal dynamic FNC properties in patients with ESRD, which provided new insights into the pathophysiological mechanism of their cognitive deficits.Acknowledgements
This study was supported by the National Natural Science Foundation of China (Grant Nos. 81971595, 81771812, 81820108018 and 81621003), the Program for Changjiang Scholars and Innovative Research Team in University (PCSIRT, Grant No. IRT16R52) of China, and the 1·3·5 Project for Disciplines of Excellence–Clinical Research Incubation Project, West China Hospital, Sichuan University (Grant No. 2020HXFH005).References
1. O'Lone E, Connors M, Masson P, et al. Cognition in People With End-Stage Kidney Disease Treated With Hemodialysis: A Systematic Review and Meta-analysis. American journal of kidney diseases : the official journal of the National Kidney Foundation. 2016;67(6):925-935.
2. Kurella Tamura M, Yaffe K. Dementia and cognitive impairment in ESRD: diagnostic and therapeutic strategies. Kidney international. 2011;79(1):14-22.
3. Williams UE, Owolabi MO, Ogunniyi A, Ezunu EO. Prevalence and pattern of neurocognitive impairment in nigerians with stages 3 to 5 chronic kidney disease. ISRN neurology. 2013;2013:374890.
4. Ni L, Wen J, Zhang LJ, et al. Aberrant default-mode functional connectivity in patients with end-stage renal disease: a resting-state functional MR imaging study. Radiology. 2014;271(2):543-552.
5. Lu H, Gu Z, Xing W, et al. Alterations of default mode functional connectivity in individuals with end-stage renal disease and mild cognitive impairment. BMC nephrology. 2019;20(1):246.
6. Mu J, Chen T, Liu Q, et al. Abnormal interaction between cognitive control network and affective network in patients with end-stage renal disease. Brain imaging and behavior. 2018;12(4):1099-1111.
7. Genovese
CR, Lazar NA, Nichols T. Thresholding of statistical maps in functional
neuroimaging using the false discovery rate. NeuroImage. 2002;15(4):870-878.
Figures

Figure 1. Demographics and Clinical Characteristics of Patients with end-stage renal disease and healthy controls. All quantitative data are expressed as mean ± standard deviation; numbers for sex data. aThe p value was calculated by using chi-square test. bThe p value was calculated by using independent two-samples t test. MoCA = Montreal Cognitive Assessment; TMT-A = Trail Making Test A; SDMT = Symbol Digit Modalities Test; HAMD-17 = 17-item version of the Hamilton Depression Rating Scale