1292
Hippocampal segmentation from 7T images showed reduced subfields volume in Sickle Cell Disease subjects1University of Pittsburgh, Pittsburgh, PA, United States, 2University of Sao Paulo, Sao Carlos, Brazil
Synopsis
Sickle cell disease (SCD) is an inherited hemoglobinopathy that can cause organ dysfunction such as cerebral vasculopathy and neurological complications. We explored whether SCD may be also associated with abnormalities in hippocampal subregions. We analyzed 7T MRI images from individuals with SCD and matched controls. Individuals with SCD had a significantly smaller volume of the DG+CA2+CA3 hippocampal region. Other hippocampal subregions also showed a trend towards smaller volumes in the SCD group. Further studies are necessary to investigate the mechanisms that lead to structural changes in the hippocampus subfields and their relationship with cognitive performance in SCD.
Introduction
Sickle cell disease (SCD) is one of the most common genetic disorders. The genotypes HbSC and HbSβ+ tend to result in milder phenotypes, while HbSβ0 thalassemia and HbSS disease tend to be severe. Neurological complications of SCD include increased risk of stroke, silent cerebral infarction, and cognitive impairment, and are more common in individuals with HbSS disease. Reduced cortical and subcortical volume and thickness has been previously reported in patients with SCD when compared with healthy controls [1-3]. However, there is limited evidence of hippocampal involvement in SCD. Thus, we explored whether SCD may be also associated with abnormalities in hippocampal subregions. We conducted 7T MRI imaging in individuals with SCD, including the HbSS, HbSC and HbS/β thalassemia genotypes (n=37 including 16 severe and 21 mild), and healthy race and age-matched controls (n=40). To the best of our knowledge, our study is the first to analyze hippocampal subregions with high-resolution images obtained with 7T MRI, and to include both severe and milder genotypes of SCD.Methods
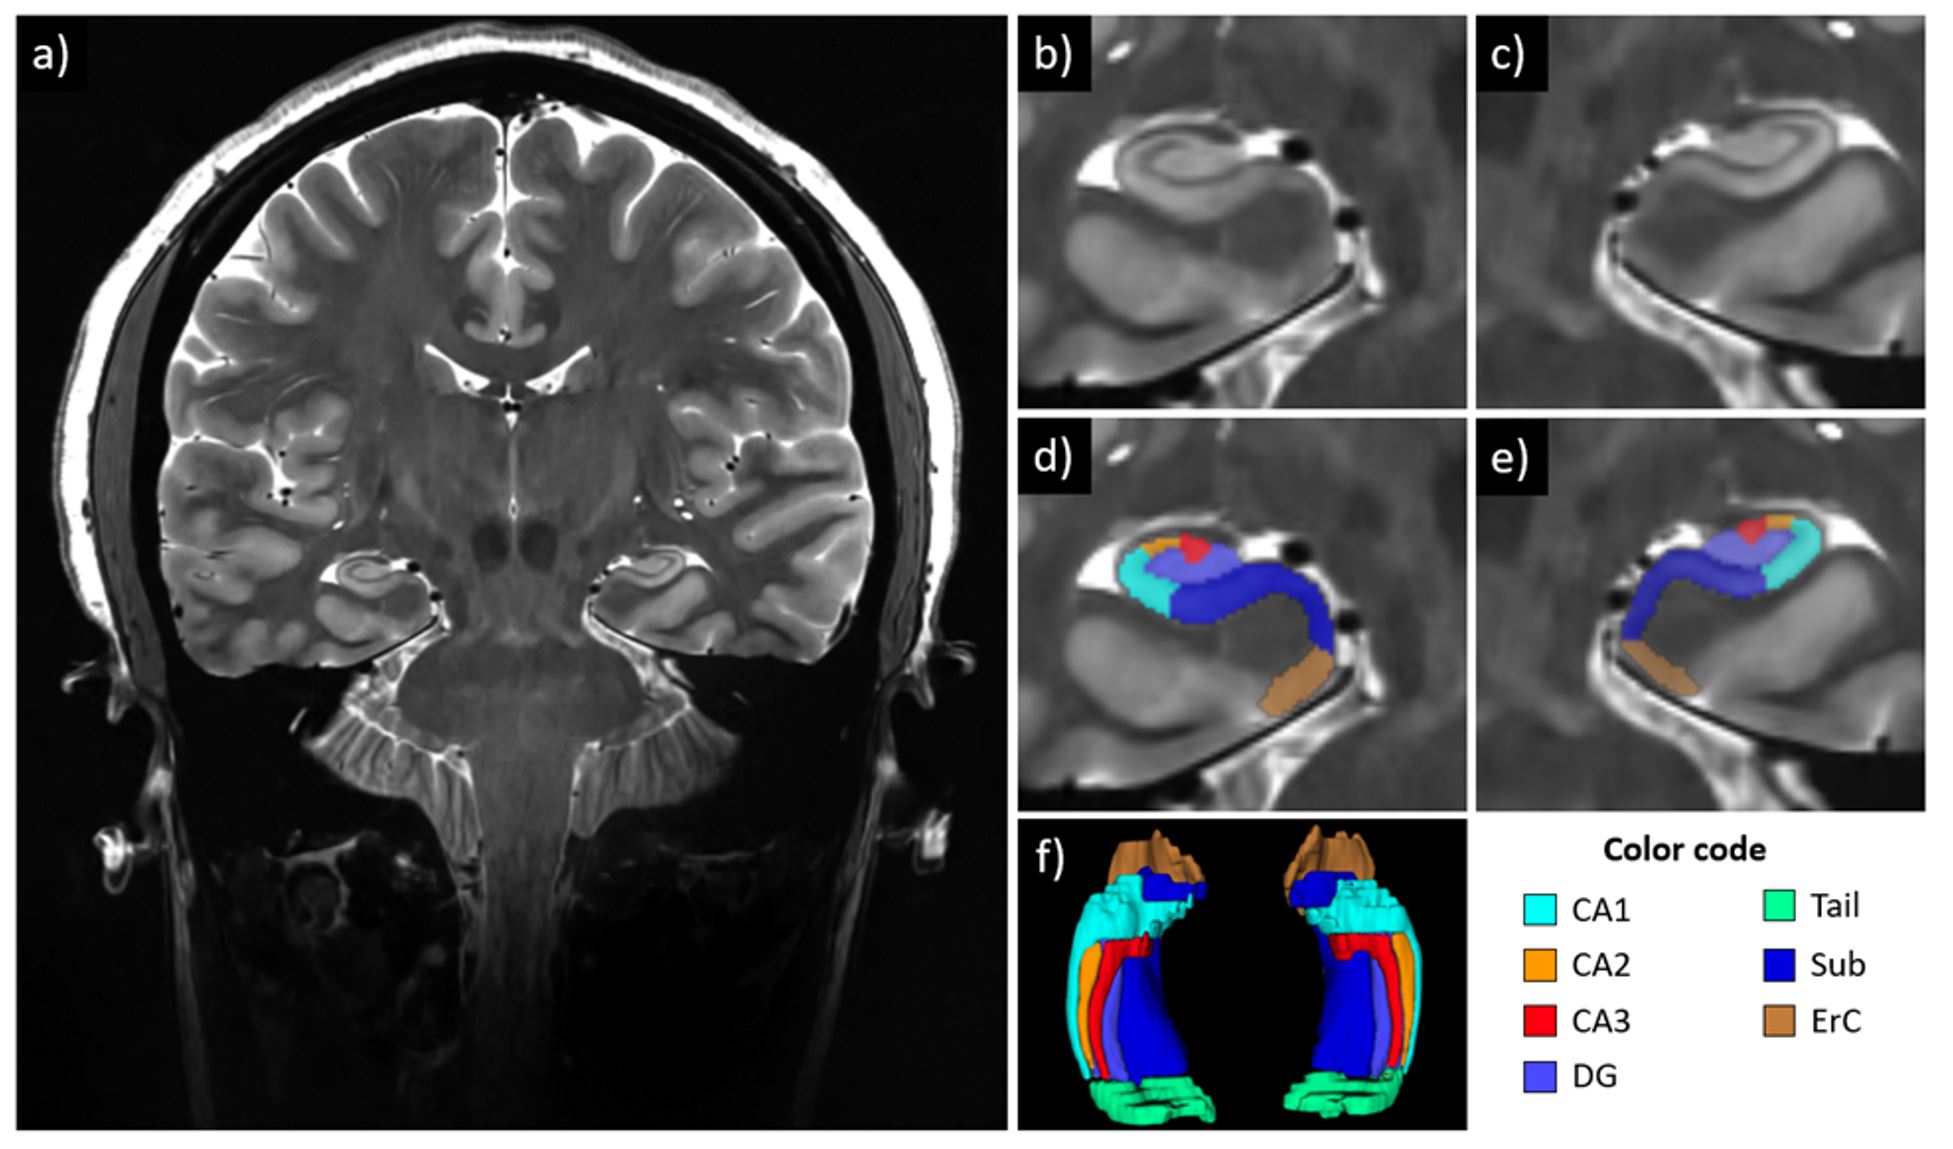
MRI images were acquired in a 7T scanner (Magnetom, Siemens, Germany) using a customized RF coil with 16 transmit Tic-Tac-Toe channels and 32-channel receive loop coil [4-6]. The sequences used are 1) MPRAGE, TE/TR/TI=2.17/1200/3000ms, resolution 0.75mm isotropic, acceleration factor 2, acquisition time of 5:02min; 2) TSE, TE/TR=61/10060ms, resolution 0.375x0.375x1.5mm3, acceleration factor 2, acquisition time 3:32 min; 3) GRE, TE/TR=8.16/24ms, resolution 0.375x0.375x0.75mm3, acceleration factor 2, acquisition time 8:20min. The images were bias-corrected using SPM12 and denoised using BM4D after proper noise transformations [7].Preprocessed MPRAGE and TSE images were used with the ASHS package [8] for the hippocampus subfields segmentation. The segmentations were manually inspected and corrected when the mistakes were obvious (i.e., deviates from clear hippocampus delineations) or excluded otherwise. An example is shown in Figure 1. Intracranial volumes (ICV) were estimated using SPM12 package with the MPRAGE and GRE images. The hippocampal subfields volumes from SCD and control groups were compared using ANCOVA, adjusting for age, gender, and ICV. Bonferroni correction was used to account for the multiple comparisons.
Results
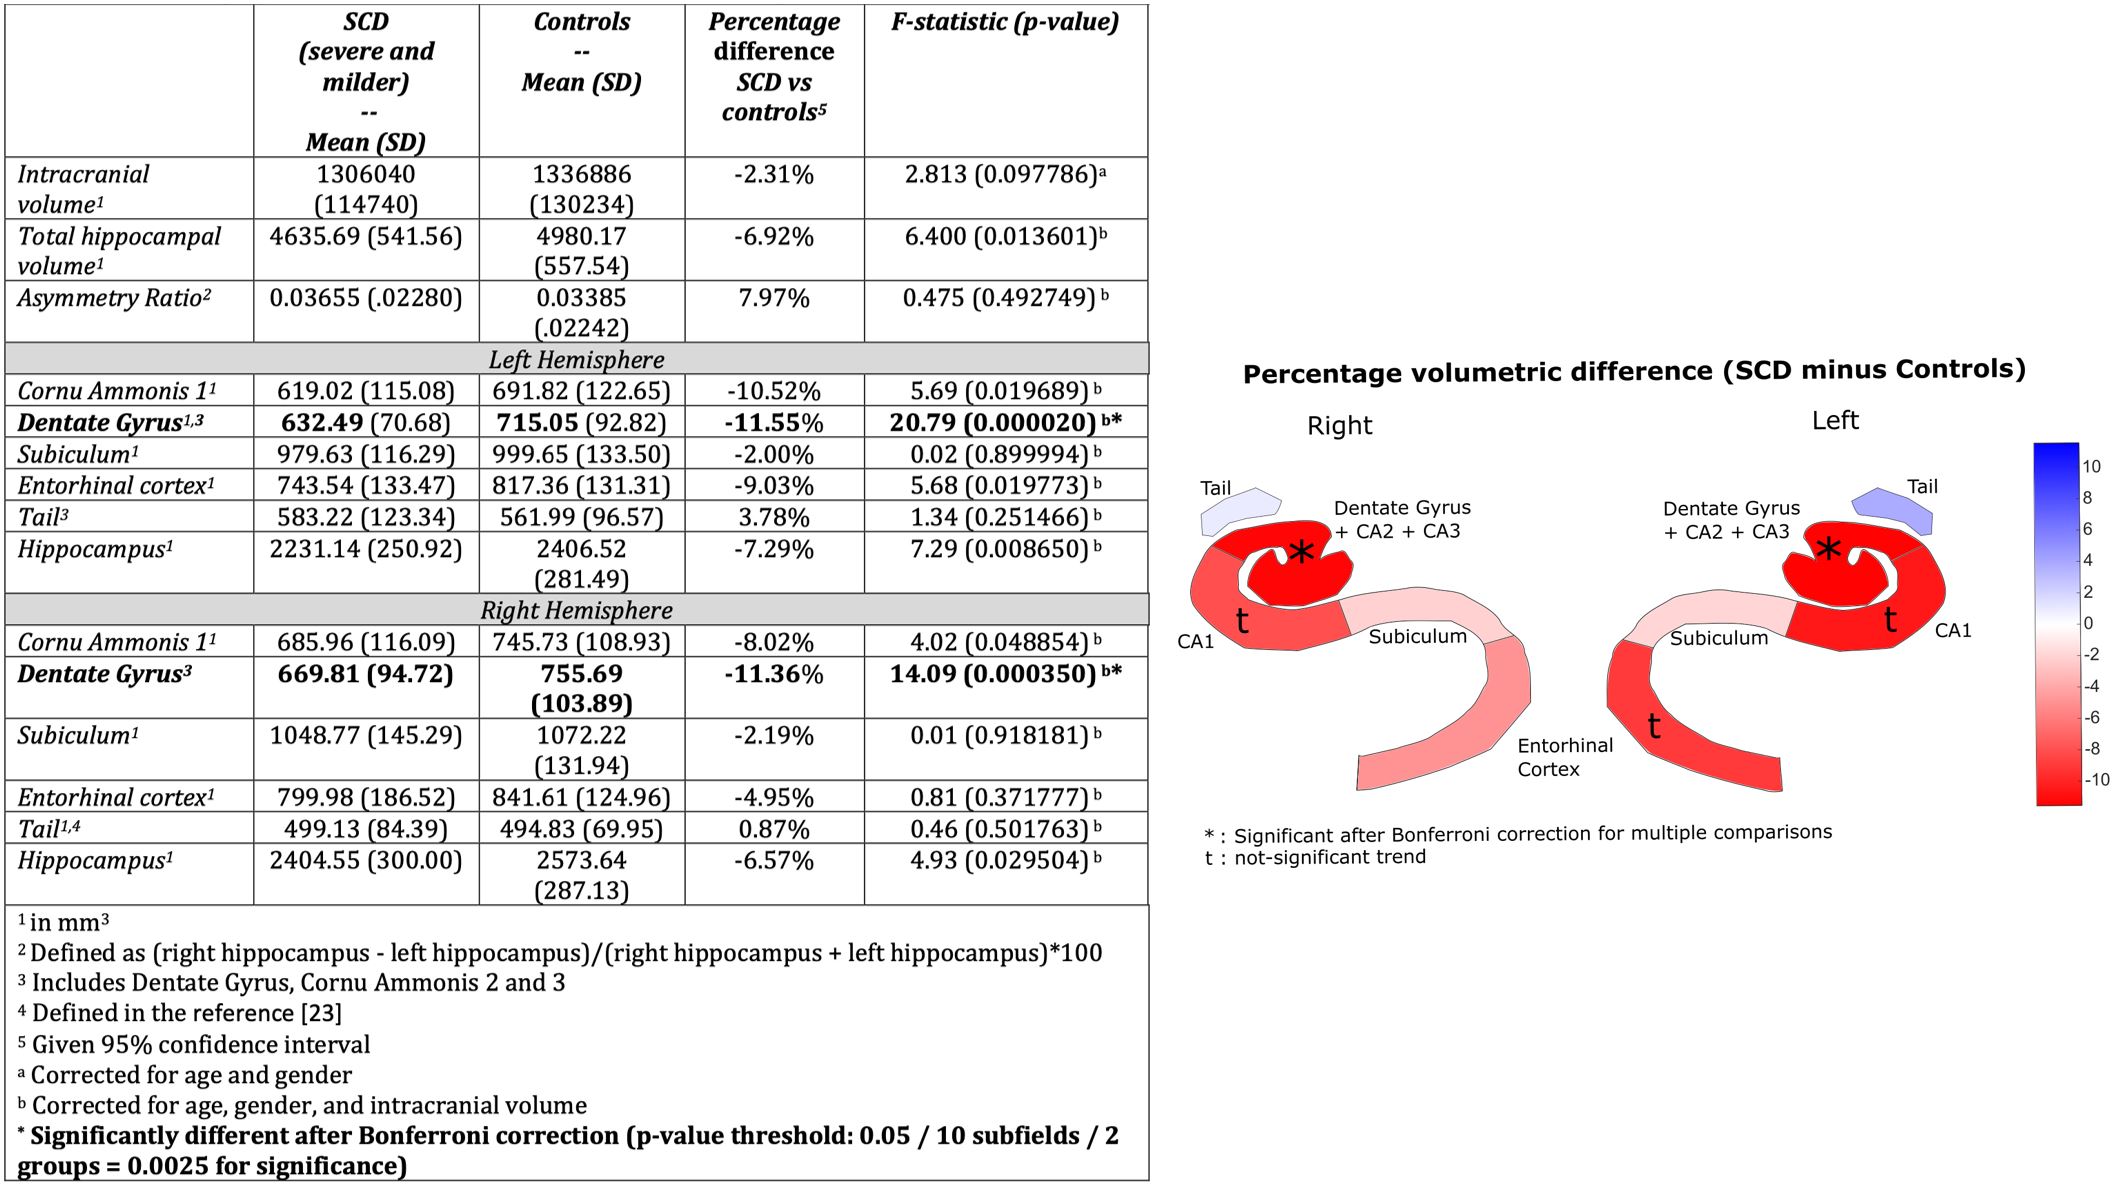
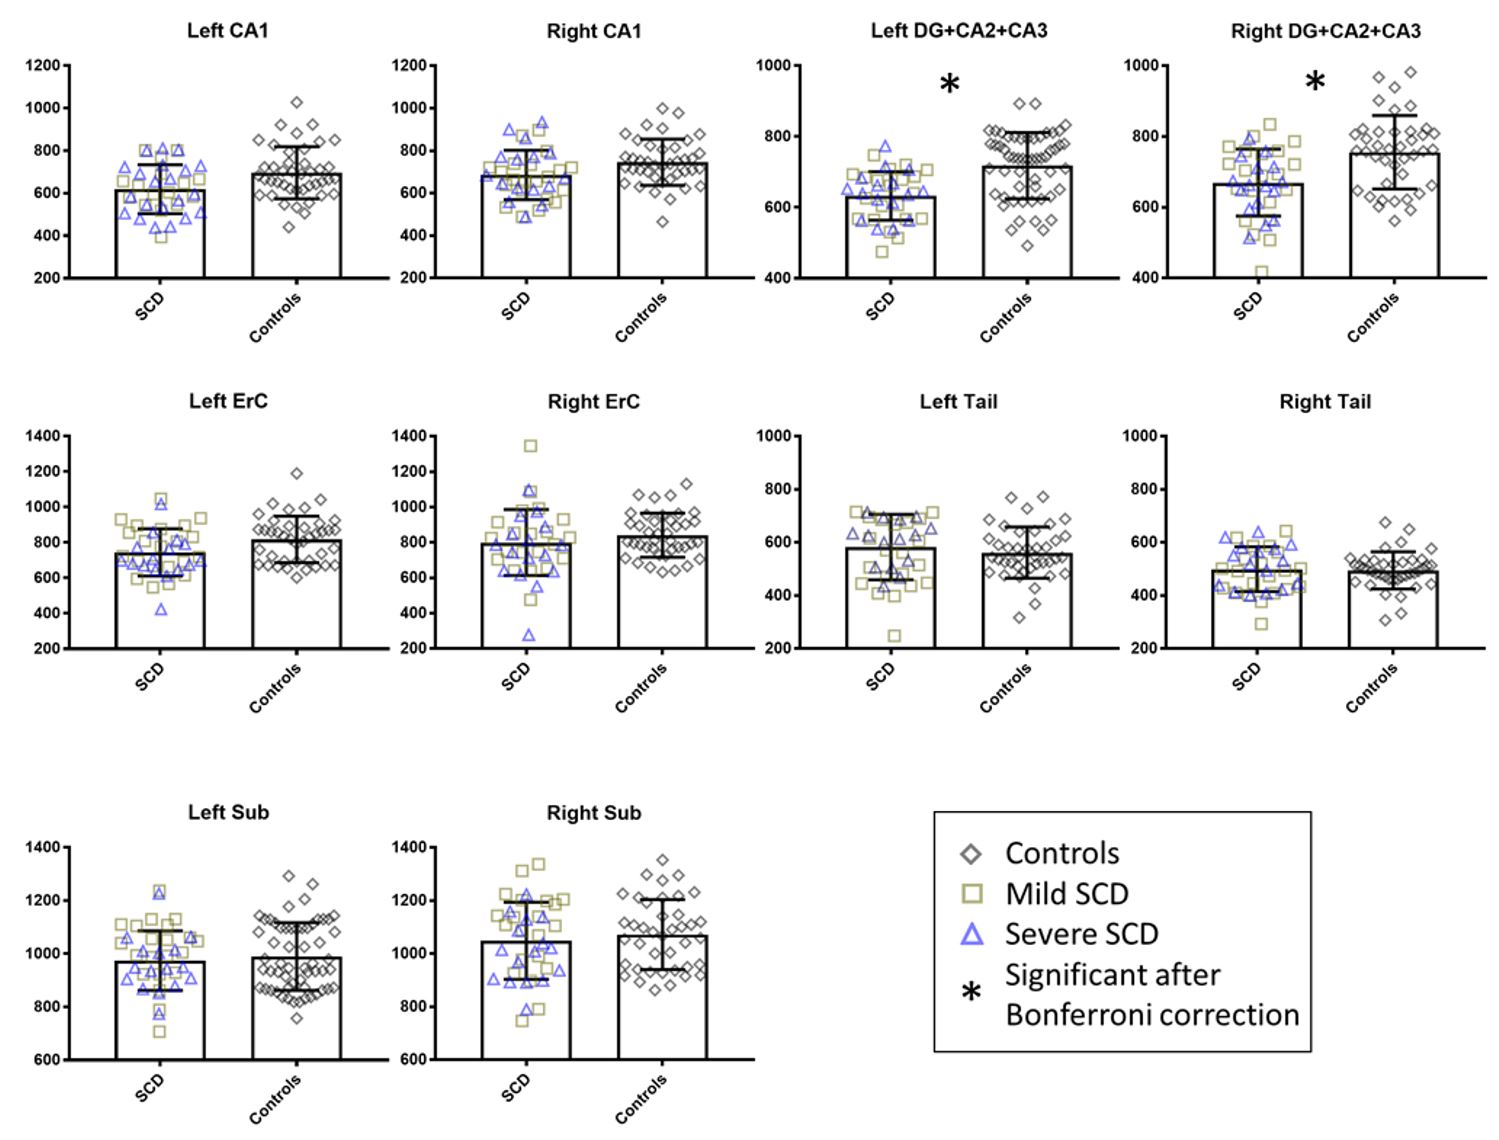
Results of the comparison of the hippocampal subfields volumes between SCD patients (severe n=16, mild n=21) and controls (n=40) are shown in Figure 2. Figure 3 shows the bar plots with the individual volumetric data points for all the subjects included in this study. Significant differences between the hippocampal volumes of the SCD and control groups were observed bilaterally in the region that encompasses the DG, CA2, and CA3: -11.55% (F=20.79, p=0.020×10⁻³) in the left hippocampus, and -11.36% (F=14.09, p=0.350×10⁻³) in the right hippocampus. There was also a trend towards a reduction of the left CA1 (-10.52%, F=5.69, p=0.020), right CA1 (-8.02%, F=4.02, p=0.049), and left ErC (-9.03%, F = 5.68, p-value 0.020), which was not statistically significant after Bonferroni correction. The other hippocampal subregions, including the right ErC, bilateral Tail, and bilateral Sub, did not significantly differ between SCD and control groups. The whole left (-7.29%, F=7.29, p=0.009) and right hippocampus (-6.57%, F=4.93, p=0.030) showed a trend that did not remain statistically significant after Bonferroni correction.Discussion
Our analysis shows that the region DG+CA2+CA3 is the most affected hippocampal subregion in the SCD group, an effect observed with a mean difference of -11.55% in volume on the left hemisphere and -11.36% on the right hemisphere. Moreover, the hippocampal subregions CA1 bilaterally, left ErC, and hippocampus bilaterally also show a trend towards smaller volumes in the SCD group, but the differences are not statistically significant after Bonferroni correction. These results are consistent with findings in pediatric populations with SCD. Kawadler et al.[2] reported a volume difference of -6.74% in the right hippocampus and -10.26% in the left hippocampus in pediatric HbSS subjects with silent cerebral infarction when compared with healthy controls. The hippocampus is particularly vulnerable to hypoxia and inflammation [9], which are common pathogenic mechanisms in SCD. Further studies will be necessary to clarify the mechanisms that lead to volume reduction in the hippocampal subfields and elucidate their significance as an imaging biomarker for cognitive deficits in individuals with SCD.Acknowledgements
This work was supported by the National Institutes of Health under award numbers: R01HL127107, R01MH111265, R01AG063525, and T32MH119168. The first author was partially supported by CAPES Foundation, Ministry of Education of Brazil, under the award number 13385/13-5. This research was also supported in part by the University of Pittsburgh Center for Research Computing through the resources provided.References
1. Mackin, R.S., et al., Neuroimaging abnormalities in adults with sickle cell anemia: associations with cognition. Neurology, 2014. 82(10): p. 835-41.
2. Kawadler, J.M., et al., Subcortical and cerebellar volumetric deficits in paediatric sickle cell anaemia. British journal of haematology, 2013. 163(3): p. 373-376.
3. Kirk, G.R., et al., Regionally specific cortical thinning in children with sickle cell disease. Cerebral Cortex, 2009. 19(7): p. 1549-1556.
4. Krishnamurthy, N., et al., Computational and experimental evaluation of the Tic-Tac-Toe RF coil for 7 Tesla MRI. PLoS One, 2019. 14(1): p. e0209663.
5. Santini, T., et al., In-vivo and numerical analysis of the eigenmodes produced by a multi-level Tic-Tac-Toe head transmit array for 7 Tesla MRI. PLoS One, 2018. 13(11): p. e0206127.
6. Santini, T., et al., Improved 7 Tesla Transmit Field Homogeneity with Reduced Electromagnetic Power Deposition Using Coupled Tic Tac Toe Antennas. bioRxiv, 2020: p. 2020.11.06.371328. Accepted for publication in Scientific Reports.
7. Santini, T., et al., Noise mitigation from high-resolution 7T MRI images, in In Proc. of the 26th International Society of Magnetic Resonance in Medicine Annual Meeting. 2018: Paris, France.
8. Yushkevich, P.A., et al., Automated volumetry and regional thickness analysis of hippocampal subfields and medial temporal cortical structures in mild cognitive impairment. Human brain mapping, 2015. 36(1): p. 258-287.
9. Iampietro, M., T. Giovannetti, and R. Tarazi, Hypoxia and inflammation in children with sickle cell disease: implications for hippocampal functioning and episodic memory. Neuropsychol Rev, 2014. 24(2): p. 252-65.
Figures