1290
GAN-based analysis for investigation of disease specific image pattern in SWI data of patients suffering from multiple sclerosis1Medical Physics Group / IDIR, Jena University Hospital, Jena, Germany, 2Michael-Stifel-Center for Data-Driven and Simulation Science, Jena, Germany, 3Department of Neurology, Medical University of Graz, Graz, Austria, 4Center of Medical Optics and Photonics Jena, Jena, Germany
Synopsis
We propose a method to transform susceptibility-weighted images of multiple sclerosis (MS) patients to images reflecting healthy volunteers based on generative adversarial networks (GANs). This method helps to identify MS by changing voxel information corresponding to the disease. The results showed that voxels around the central veins and ventricles are identified as MS-specific by the method. This finding may contribute to improvements in MS diagnosis and encourage future studies based on the presented findings.
Introduction
With their recent adoption in the medical field, generative adversarial networks (GANs) have shown significant performance in many image-related tasks1. We are interested in these neural networks to perform image-to-image translation between two domains, healthy and diseased, in a group of healthy controls (HC) and a group of multiple sclerosis (MS) patients. Specifically, we identify MS-specific features in magnetic resonance imaging (MRI) data by transforming an MS image into a healthy one. This GAN-based analysis is a promising technique to establish new methods to detect and localize disease-related image features, enabling studies that pay attention to MS-localized brain regions. In this study, we use Fixed-Point GAN (FPG)2 which was introduced for brain lesion detection and other purposes. We apply this method to susceptibility-weighted imaging (SWI)3 data, an MR-based contrast useful for identifying disease-related patterns such as iron deposition and lesion-vein relationships4.Materials and Methods
We used a database of T1-weighted multi-echo gradient-echo brain scans acquired on a 3T scanner (Prisma Fit, 20-channel head coil). The following sequence parameters were applied: α=35°; TE1-5= [8.12;13.19;19.26;24.33;29.40ms]; TR=37ms, matrix-size=168×224; FOV=168mm×224mm; slice- thickness=1mm; number of slices=192. We selected 3D T1w data of echo-time TE5 from 66 MS patients and 66 HC, respectively, and reconstructed SWI3 with subsequent sliding minimum intensity projection over 14 consecutive slices. For each subject, we kept 50 two-dimensional central slices of the corresponding 3D SWI data. Finally, we randomly selected 33 MS and 33 HC for training and the remaining subjects for testing. Thus, each dataset was composed of 3300 two-dimensional SWI images.To translate SWI images from one domain to another, we chose FPG2. We trained FPG to translate input images to a given target domain (HC or MS) and then used the trained model on the test set to generate new translated images. Subsequently, we computed the absolute difference between the newly translated and the original input images. The resulting difference maps were thresholded for the 3rd and the 97th percentile to locate image voxels that were most altered in intensity after translation. We computed the mean value of the localized voxels for one slice position of each MS subject in the test dataset to compare intensity changes between the input MS images and translated images. Moreover, we analyzed the significance of the differences by computing p-values in a two-sample t-test.
Results
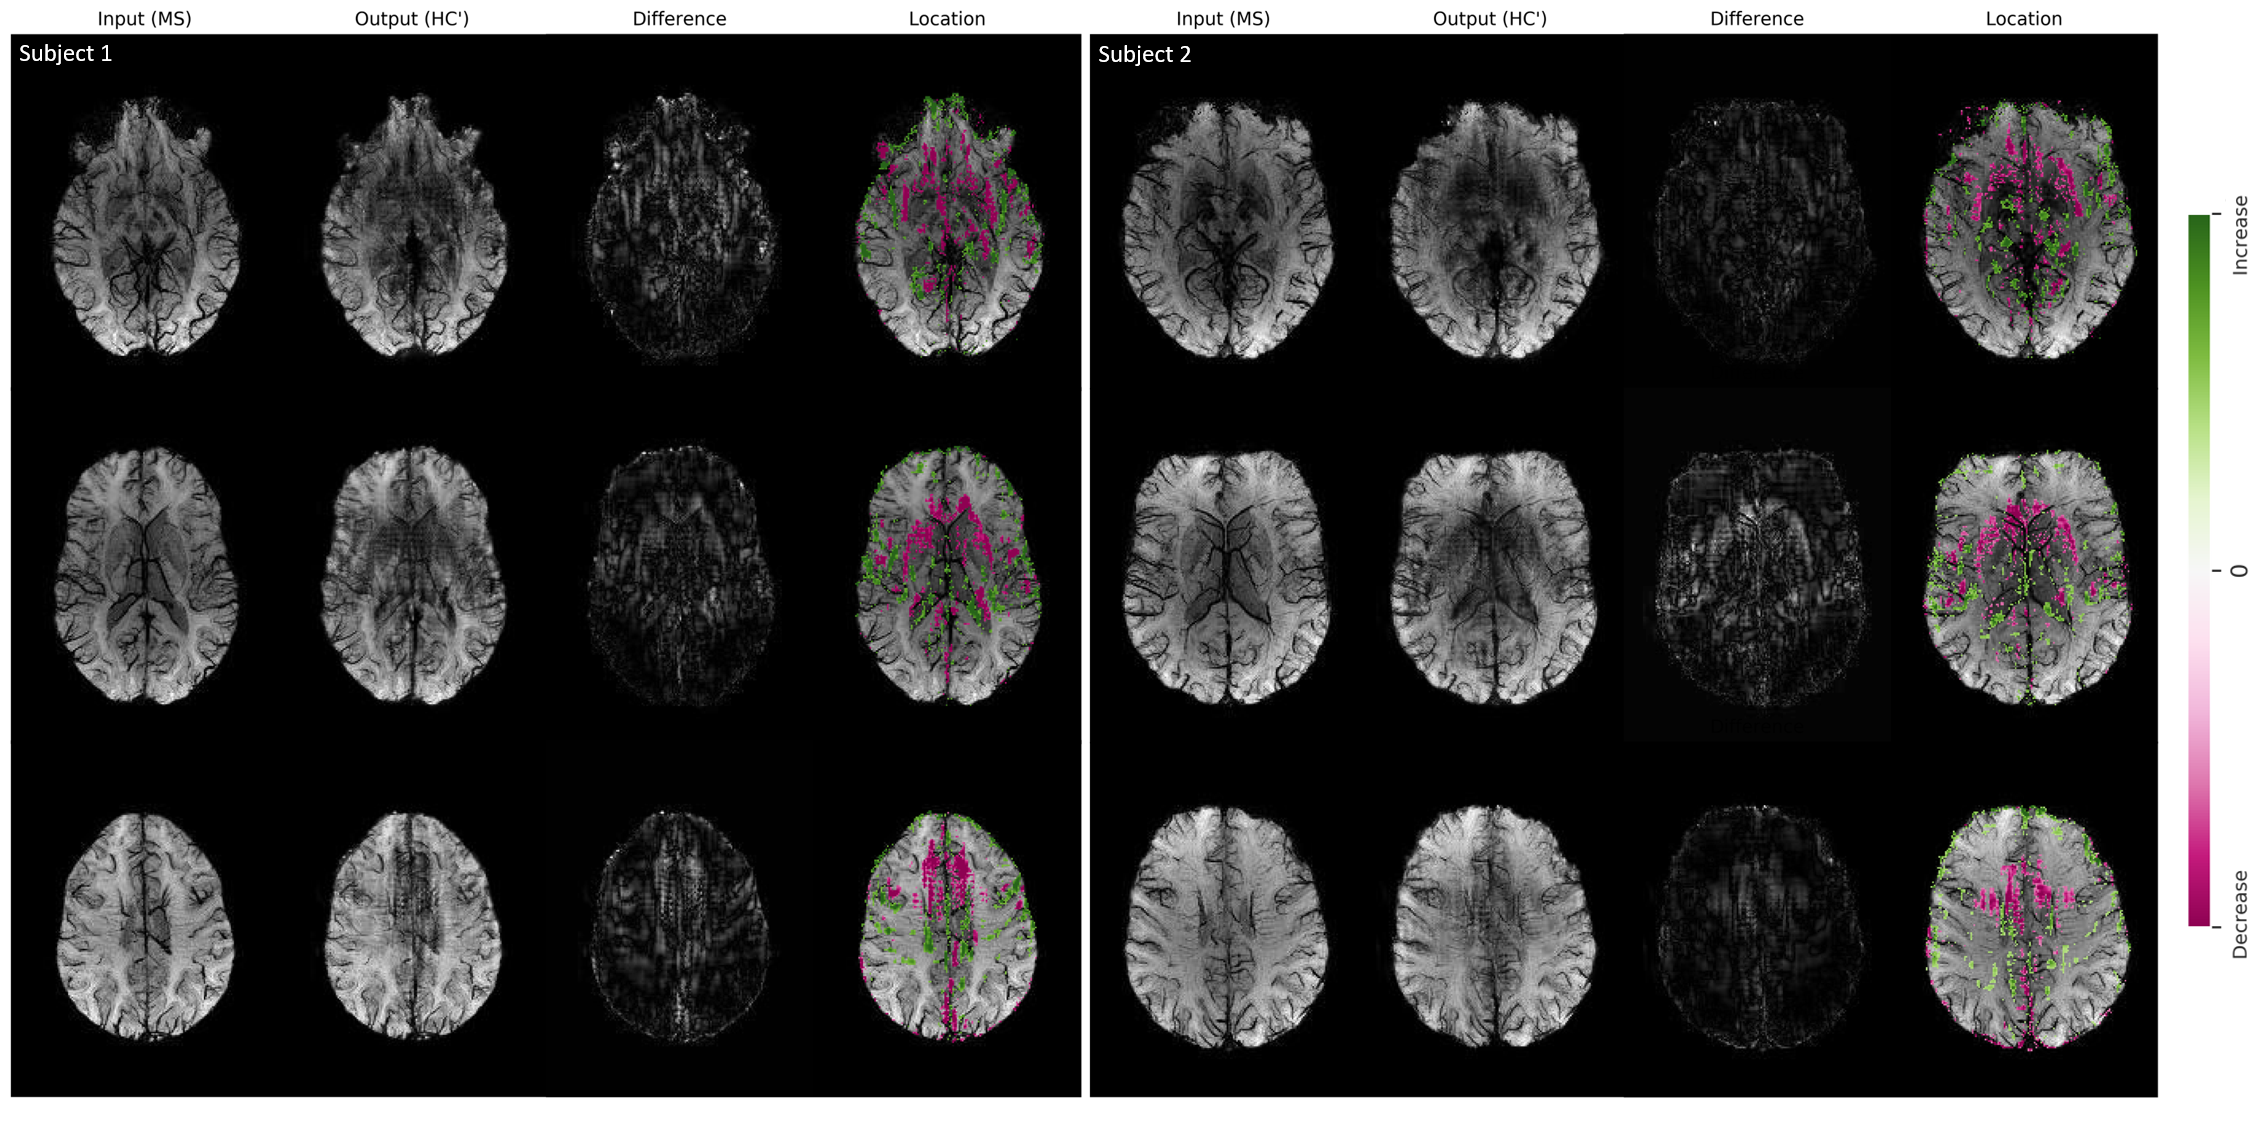
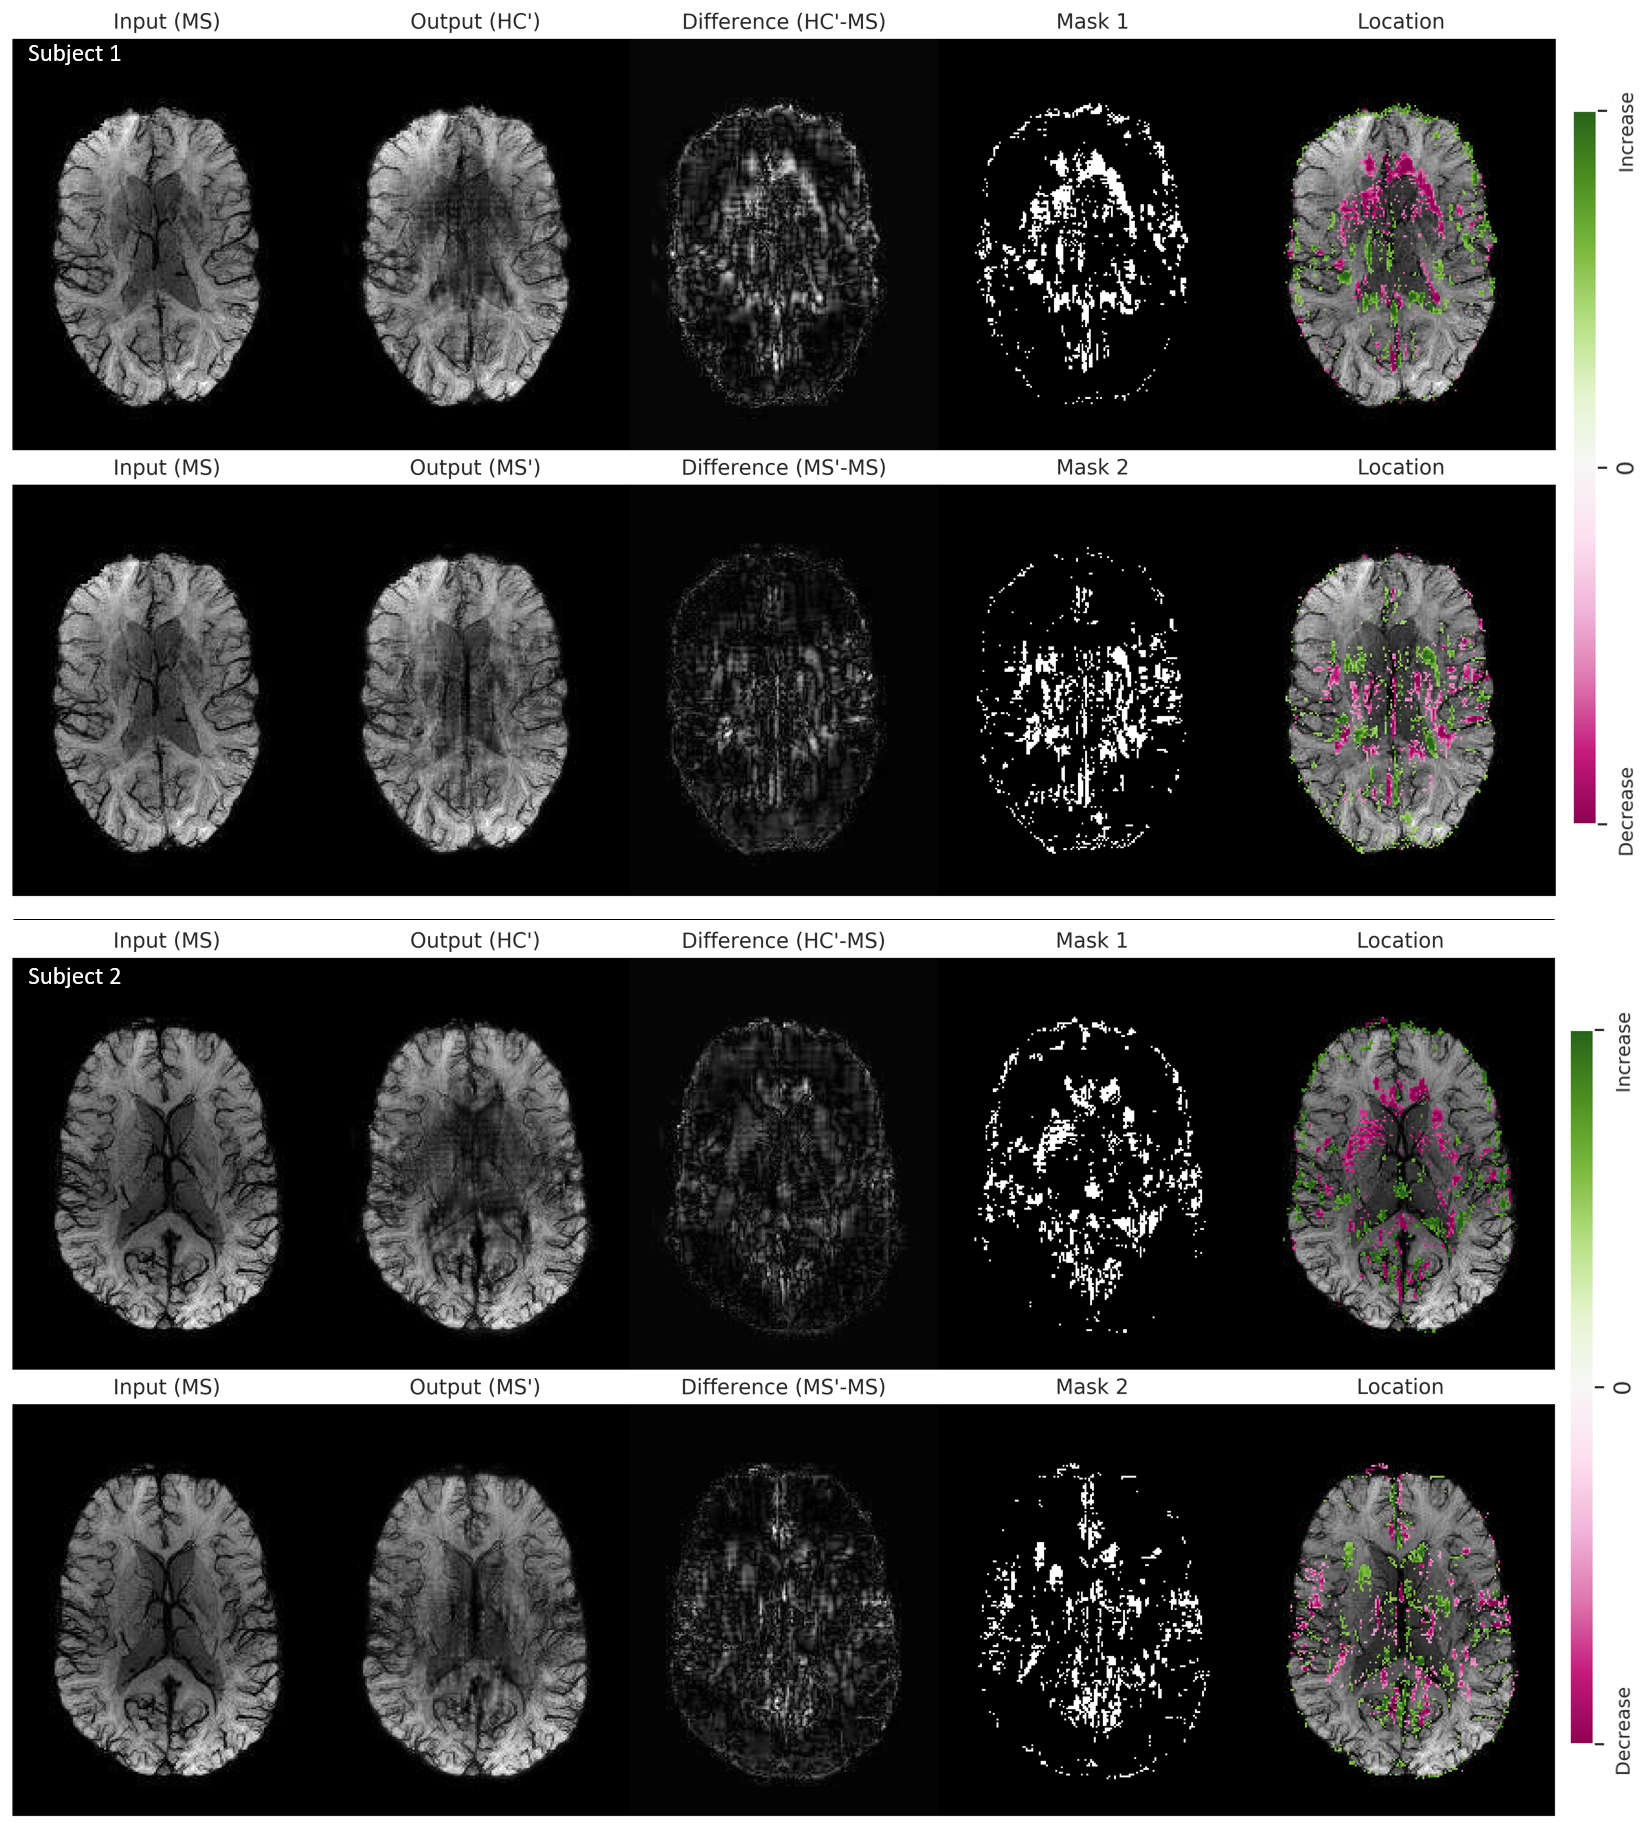
In Figure 1, we show example results of image-to-image translation for two MS subjects from the test set. For each subject, three input images associated with three different slice positions and their translated output images to the healthy domain (HC’) are shown. The difference maps indicate the absolute difference between the input and the output images. These maps are thresholded and overlaid with the input images to highlight the disease-related spatial image patterns. In both subjects, we observed voxel modifications to be located in the frontal and medial parts of the brain. A decrease in voxels intensity is mainly seen around the anterior horn of the ventricles whereas an increase in intensity is seen around the posterior horn of the ventricles.Figure 2 demonstrates the translation of two more MS subjects from the test set to the healthy domain (HC’) as well as to the same domain (MS’) for one selected slice position. Modification patterns for same-domain transformation are less pronounced and show an opposite pattern of intensity changes compared to the cross-domain transformation.
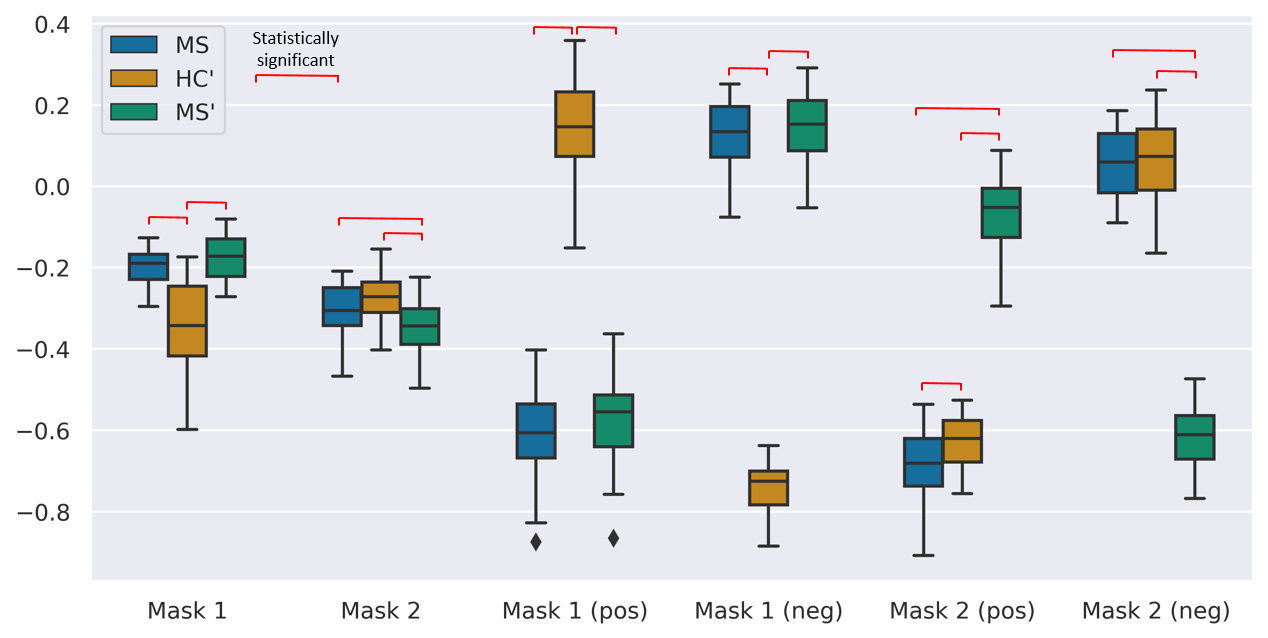
We visualized the differences in intensity between the three groups of images (MS, HC’, MS’) using box plots in Figure 3. The selection of the voxels is based on two masks (see Figure 2) and additionally separated by positive and negative intensity changes. Significant differences in selected voxels between MS and HC’ and between MS’ and HC’ are seen, when translating MS images to the healthy domain (based on Mask 1). The same is true when selecting voxels corresponding to positive and negative changes separately. When translating MS to the same domain (based on Mask 2), a significant difference is observed in MS/MS’ and HC’/MS’ pairs.
Discussion and Conclusion
In this study, we used FPG2 to generate images from SWI images of MS patients, which were no longer classified as MS after modification. By subtracting these translated images from their unmodified version, we obtained MS-related voxels in the SWI, which were mostly located around the ventricles of the brain and around some of the veins in the medial brain part. The statistical analysis of these voxels in the original MS images and the generated “healthy” images showed a significant intensity difference that supports our findings on disease-specific spatial brain regions. These findings might be helpful for future MS studies by focusing on certain brain regions.Although the proposed method appears promising for MS localization, it has some limitations. The generated images are subject to artifacts in some areas, especially pronounced and visible in the central part of the brain. Moreover, we observed image modifications in same-domain translation, indicating that not all changes performed by the generator on the input data were disease-specific. The limited number of training samples might be causing these limitations and for future studies, we suggest generating more data by synthesizing images using advanced deep learning techniques.
Acknowledgements
This study was supported in parts by the Carl-Zeiss-Foundation (CZ-Project: Virtual Workshop), the German Research Foundation (RE1123/21-1), and the Austrian Science Fund (FWF3001-B27).References
1. Yi X, Walia E, Babyn P. Generative Adversarial Network in Medical Imaging: A Review. Medical Image Analysis. 2019;58. doi:10.1016/j.media.2019.101552
2. Siddiquee MMR, Zhou Z, Tajbakhsh N, et al. Learning fixed points in generative adversarial networks: From image-to-image translation to disease detection and localization. Proc IEEE Int Conf Comput Vis. 2019:191-200. doi:10.1109/ICCV.2019.00028
3. Haacke EM, Xu Y, Cheng YCN, Reichenbach JR. Susceptibility weighted imaging (SWI). Magn Reson Med. 2004;52(3):612-618. doi:10.1002/mrm.20198
4. Chawla S, Kister I, Sinnecker T, et al. Longitudinal study of multiple sclerosis lesions using ultra-high field (7T) multiparametric MR imaging. PLoS One. 2018;13(9):1-16. doi:10.1371/journal.pone.0202918
Figures