1289
Improving T1-weighted MRI brain images by optimizing differential identifiability1Electrical & Computer Engineering, Purdue University, West Lafayette, IN, United States, 2Industrial Engineering, Purdue University, West Lafayette, IN, United States, 3Biomedical Engineering, University of Cincinnati, Cincinnati, OH, United States
Synopsis
Analysis of scan-rescan subject identifiability of T1 anatomical brain MRI could provide insight into intersession differences. Here we examine a principal component analysis-based method of maximizing differential identifiability and its effect on T1 brain images with and without added noise. We demonstrate that differential identifiability can be maximized via dataset reconstruction with reduced principle components. This reconstruction results in increased similarity between repeated scans for a given subject as well as apparent reduced intersession noise in images. We conclude that further analysis of maximized differential identifiability could provide insight for future applications in reducing intersession MRI noise.
Introduction
Functional Connectomes (FCs), estimated from functional MRI, have been shown to possess a reproducible subject fingerprint1, which can be improved by maximizing differential identifiability across repeated sessions (test-retest) by using a group-level principal component analysis (PCA) decomposition method2,3. Here, we explore the application of this framework to T1 anatomical brain images to enhance test-retest reliability with the goal of understanding the non-physiological differences present in repeated MRI measures of a subject, both within and across scanners, which is necessary to improve image harmonization in longitudinal and multi-site studies.Methods
This study utilized MRI data from 18 undergraduate and graduate students (9 female, age 18-28). For each subject, two T1 structural images were taken (test, retest) on the same day. Scans were conducted on a 3T GE Discovery MR750 with 32-channel brain array (Nova Medical) and used a T1-weighted protocol with 3D fast spoiled gradient recalled echo sequence (TR/TE = 5.7/1.976 msec; flip angle = 73°; 1 mm isotropic resolution).All images were processed using AFNI4 and FSL5 commands as described by Bari et al.3, registered to a common brain atlas6, and pooled to perform PCA. Registered images were subsequently reconstructed using varying numbers of principal components (PCs) to determine the subspace which produced maximum differential identifiability, 𝐼𝑑𝑖𝑓𝑓. For each iteration we first construct an 18 x 18 identifiability matrix 𝐼, where 𝐼𝑖,𝑗 is equal to the Euclidean distance between the subject 𝑖 test and the subject 𝑗 retest vectorized image. 𝐼𝑑𝑖𝑓𝑓 was computed as an average of two z-scores (associated with test and retest):
$$
I_{diff}=\frac{1}{2n}\sum\limits_{i=1}^n(\frac{\mu_{i,v}-I_{i,i}}{\sigma_{i,v}}+\frac{\mu_{i,h}-I_{i,i}}{\sigma_{i,h}})
$$
where 𝑛 is the number of subjects, 𝜇𝑖 is the mean of entries in the 𝑖𝑡ℎ row (indicated by ℎ) or column (indicated by 𝑣) of 𝐼, and 𝜎𝑖 is the standard deviation of data in the 𝑖𝑡ℎ row or column of 𝐼. Computation of both 𝜇𝑖 and 𝜎𝑖 exclude the 𝑖𝑡ℎ entry 𝐼𝑖,𝑖 of the corresponding row or column. The average distance between same-subject test and retest scans (Dself) and that between different-subject test and retest scans (Dothers) were computed as:
$$
D_{self}=\frac{1}{n}\sum\limits_{i=1}^n{I_{i,i}}
$$
$$
D_{others}=\frac{1}{n^2-n}\sum\limits_{i=1}^n\sum\limits_{j=1}^n{I_{i,j}} - D_{self}
$$
To see if Idiff optimization helps remove noise from images, a noisy dataset was simulated by adding random Gaussian noise (𝜎noise = standard deviation of all nonzero voxel intensities) to all images in the dataset. The PCA reconstruction method was then reapplied to the new noisy dataset.
Results
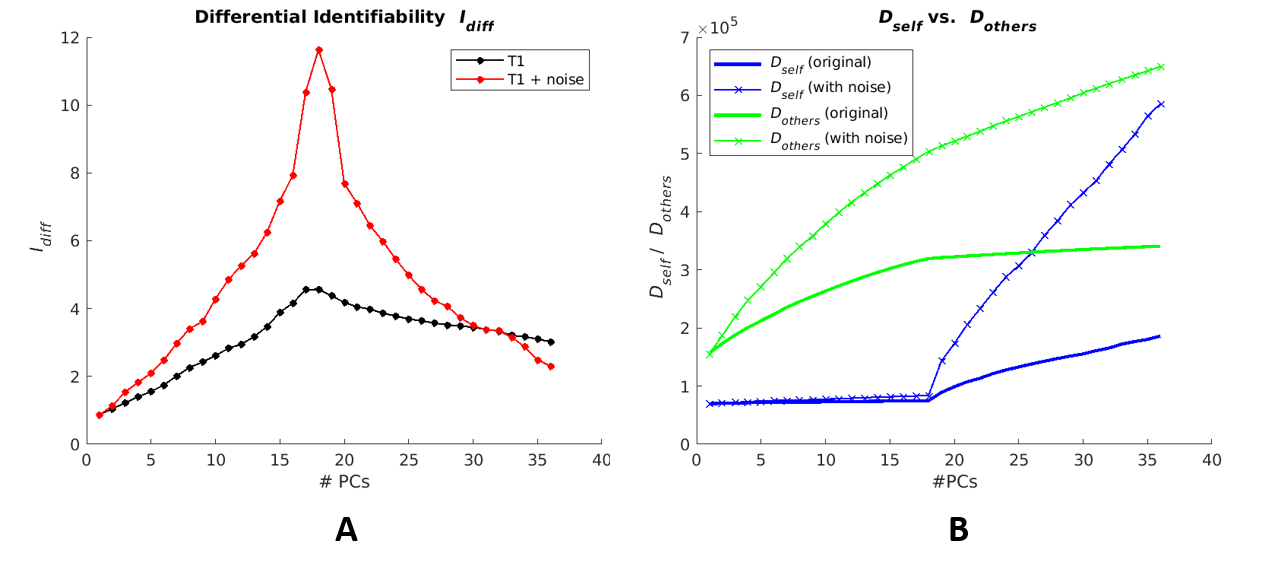
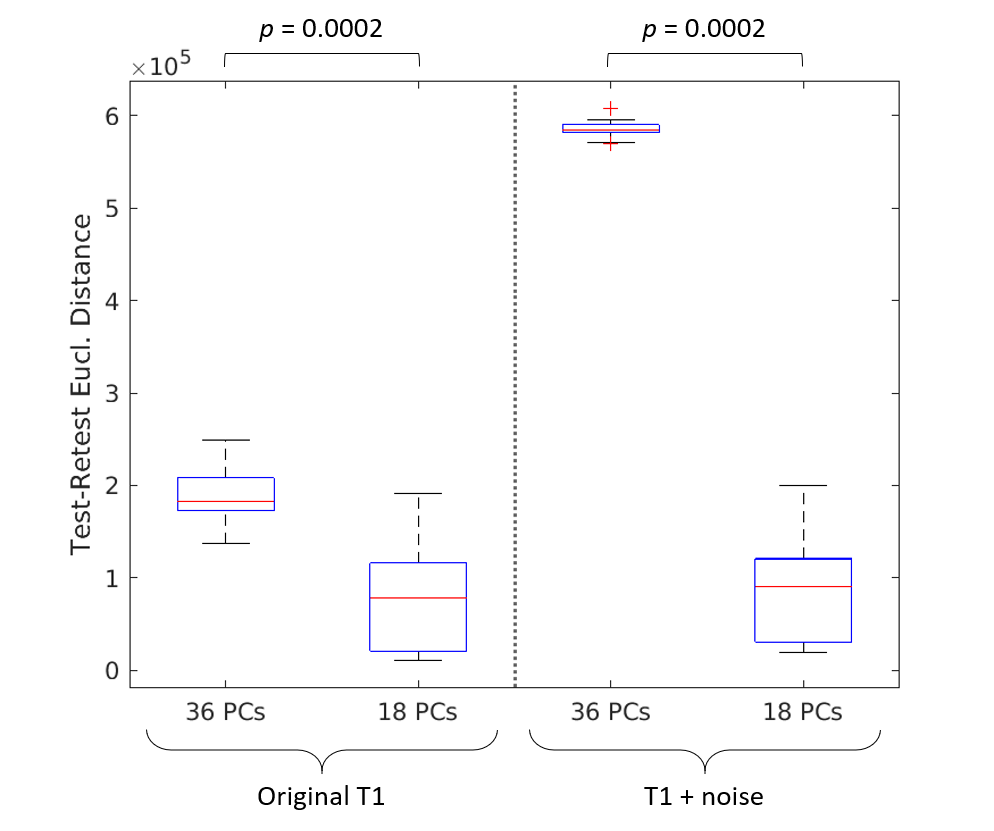
Reconstruction of both original and with-noise images at varying numbers of PCs results in variations in differential identifiability Idiff, with Idiff peaking at 18 PC reconstruction (Fig. 1A). The corresponding plots of Dself and Dothers are shown in Fig. 1B.The Euclidean distance (Ii,i) between same-subject test-retest images were grouped and compared between fully (36 PCs) and optimally (18 PCs) reconstructed images (Fig. 2), conducted separately for original images and images with added noise. A statistically significant difference (using Wilcoxon signed rank test) in medians was found between groups in both the original images (p=0.0002) and images with added noise (p=0.0002).
Discussion
Using group-level PCA decomposition of T1 images, we have shown that T1 images possess a test-retest fingerprint, and it can be enhanced by maximizing the differential identifiability (Idiff). The peak Idiff possible through PC reconstruction of the added-noise dataset is actually greater than that for the original images, which implies that the metric is dataset-specific and cannot necessarily be used to compare the quality of two separate datasets.Idiff, in essence, reflects the gap between the metrics Dself and Dothers. Fig. 1B illustrates that added noise results in notably higher Dothers at 18 PCs, while it has little effect on Dself at 18 PCs. This causes a greater gap between Dothers and Dself, hence the heightened Idiff peak observed for the noisy dataset. This observation implies that as the number of PCs is increased through the first 18 PCs, the increase in Idiff stems from increasing distance between test-retest images from different subjects.
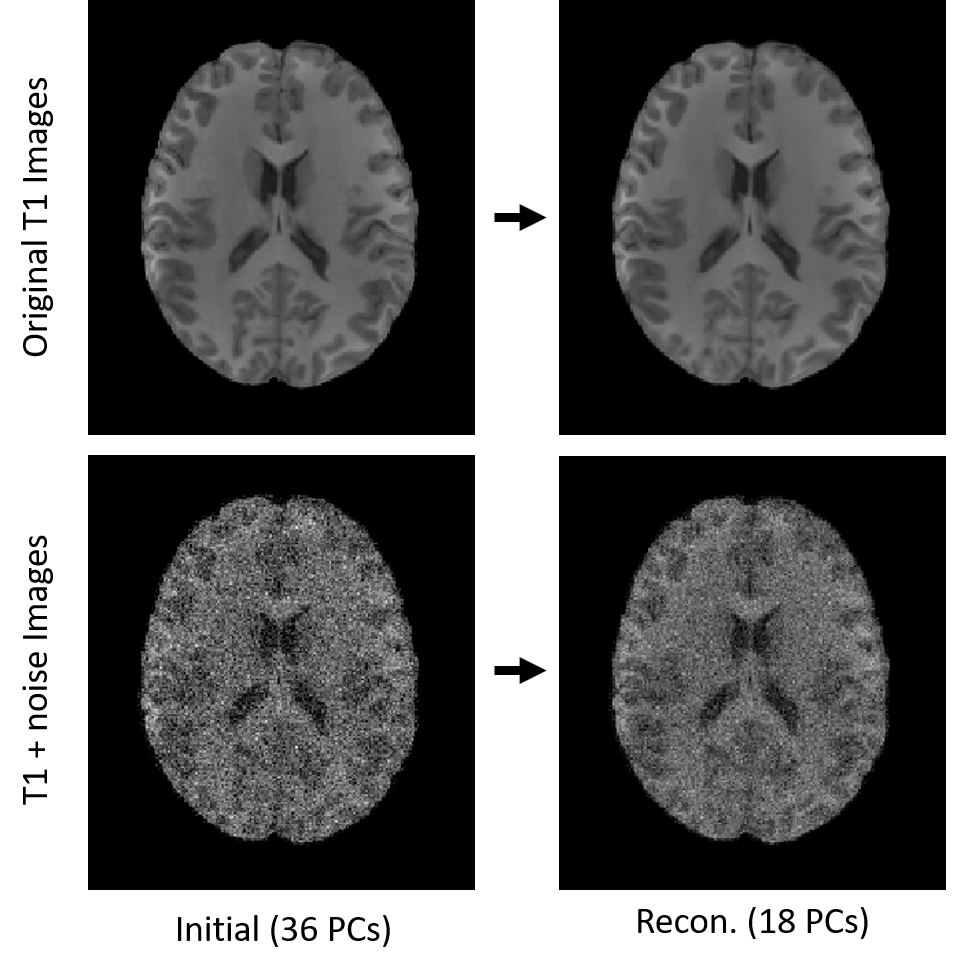
The analysis shown in Fig. 2 demonstrates that similarity between a subject’s test-retest images are significantly increased using the optimal PC reconstruction. Observation of the actual images related to 18 and 36 PC reconstruction (Fig. 3) shows that the optimal reconstruction results in decreased (though not completely removed) noise levels, implying that the method could be useful for improving reliability across repeated scans of the same subject. This method has potential to be useful in characterizing noise differences resulting from different scan sessions (both within and across scanners) through further analysis of the changes made during optimal Idiff reconstruction, but has drawbacks in that the resulting noise characteristics would be a function of the dataset used.
Conclusion
We demonstrate that differential identifiability can be maximized using reconstruction of images with an optimized number of PCs. This reconstruction results in significantly improved similarity between a given subject’s test-retest images and partially reduces noise present in the images, presenting potential future applications in reducing intersession noise. Deeper understanding of the Idiff metric requires concurrent observation of related metrics Dself and Dothers.Acknowledgements
This work was funded in part by the Purdue University Discovery Park Data Science Award "Fingerprints of the Human Brain: A Data Science Perspective”.References
1Finn, E. S. et al. (2015), ‘Functional connectome fingerprinting: identifying individuals using patterns of brain connectivity’, Nature Neuroscience, 18, 1664-1671, doi:10.1038/nn.4135.
2Amico, E. & Goñi, J. (2018), ‘The quest for identifiability in human functional connectomes’, Scientific Reports, 8, 8254, doi:10.1038/s41598-018-25089-1.
3Bari, S. et al. (2019), ‘Uncovering multi-site identifiability based on resting state functional connectomes’, NeuroImage, 202, 115967, doi: 10.1016/j.neuroimage.2019.06.045.
4Cox, R.W. (1996), ‘AFNI: Software for analysis and visualization of functional magnetic resonance neuroimages’, Computers and Biomedical Research, 29(3), 162-173, doi:10.1006/cbmr.1996.0014.
5Jenkinson, M. (2012), ‘FSL’, NeuroImage, 62(2), 782-790, doi:10.1016/j.neuroimage.2011.09.015.
6Fonov, V. S. (2009), ‘Unbiased nonlinear average age-appropriate brain templates from birth to adulthood’, NeuroImage, 47(supp. 1), S102, doi:10.1016/S1053-8119(09)70884-5.
Figures