1288
Reproducibility and Multi-vendor Accuracy Comparison of T1- and T2- Mapping Using 2D and 3D Synthetic MRI with GRAPPA, SENSE and Compressed Sense1Radiology, Universitair Ziekenhuis Brussel, Brussels, Belgium, 2SyntheticMR AB, Linköping, Sweden
Synopsis
To evaluate intra- and inter-scan repeatability of quantitative scans, T1-, T2- and PD maps were acquired simultaneously using the 2D multi-delay-multi-echo sequence and the 3D-QALAS sequence, for 3T scanners of three different manufacturers. All scans were acquired with and without acceleration factor of 2, using GRAPPA, SENSE or compressed sensing, depending on the vendor. On one scanner measurements were repeated 10 times. The estimated values using synthetic MRI were compared to the reference values of the ISMRM-NIST phantom. The results for T1- and T2- mapping show a linear curve close to the reference values, with good reproducibility.
Introduction
Quantitative MRI in the brain has recently become more feasible by the development of several new techniques, such as MR fingerprinting 1 or Synthetic MRI, which uses a multi-delay multi-echo (MDME) sequence. 2,3 Both techniques are 2D acquisitions and thus have a low through-slice resolution, which might hinder tissue characterization based on the quantitative data due to partial volume effects. Recently, synthetic MRI using a modified 3D-QALAS sequence has been introduced as a 3D synthetic MRI sequence, capable of simultaneously acquiring T1-, T2- and PD-maps in the human brain. 4,5 However, for quantitative MRI to be reliable, the resulting maps should be reproducible and not depend on the acquisition sequence, parameters, or scanner used. In this research, reproducibility was tested for the MDME and 3D-QALAS sequence using a phantom on scanners from different vendors and with different levels of parallel MRI or compressed sensing. Reproducibility of the 3D-QALAS sequence was evaluated by repeatedly scanning the phantom on a single scanner.Methods
An ISMRM-NIST phantom 6 was scanned on 3T scanners of 3 different vendors (Philips Ingenia, Siemens Skyra, and GE Discovery 750w) in our institution and quantitative maps were acquired using the MDME and 3D-QALAS sequences, varying the settings as little as possible between vendors. The 3D-QALAS sequence was not available for one vendor. All scans used a 256x256 FoV, 1 mm² in-plane resolution. The MDME sequence and 3D-QALAS used a 6mm and 1mm slice thickness, respectively. The FoV encompassed the T1-, T2- and PD-arrays of the phantom. To assess the influence of the varying acceleration techniques, including compressed sensing, scans were acquired both without acceleration and with an acceleration factor of 2 using GRAPPA, SENSE, or compressed sensing, depending on the vendor. The acquisition times were comparable for 2D and 3D scans: about 15min for R=1 and 7.5min for R=2. The phantom was placed in the scanner room at least 8 hours before each scan. The phantom temperature was measured just before scanning and had a range of 21.2 - 22.8 °C. For a single vendor, the phantom was scanned ten times, using R=2 and R=2.5, over the course of three days, with the phantom being repositioned between each repetition. The ISMRM-NIST phantom contains a T1, T2 and PD array, each consisting of 14 spheres with known calibrated values for the respective property. Quantitative T1 and T2 maps were created in the respective arrays using a prototype version of the SyMRI software (SyntheticMR, Linköping, Sweden). ROI’s of a 6mm radius were drawn within the spheres of the T1 and T2 arrays of the phantom using Matlab 2016b (Mathworks, Natick, MA, USA). For 3D-QALAS data, the ROI’s extended over 6 slices. Only the spheres with values relevant for neurological MRI were used (200-1500ms for the T1 array and 30-300ms for the T2 array).Results
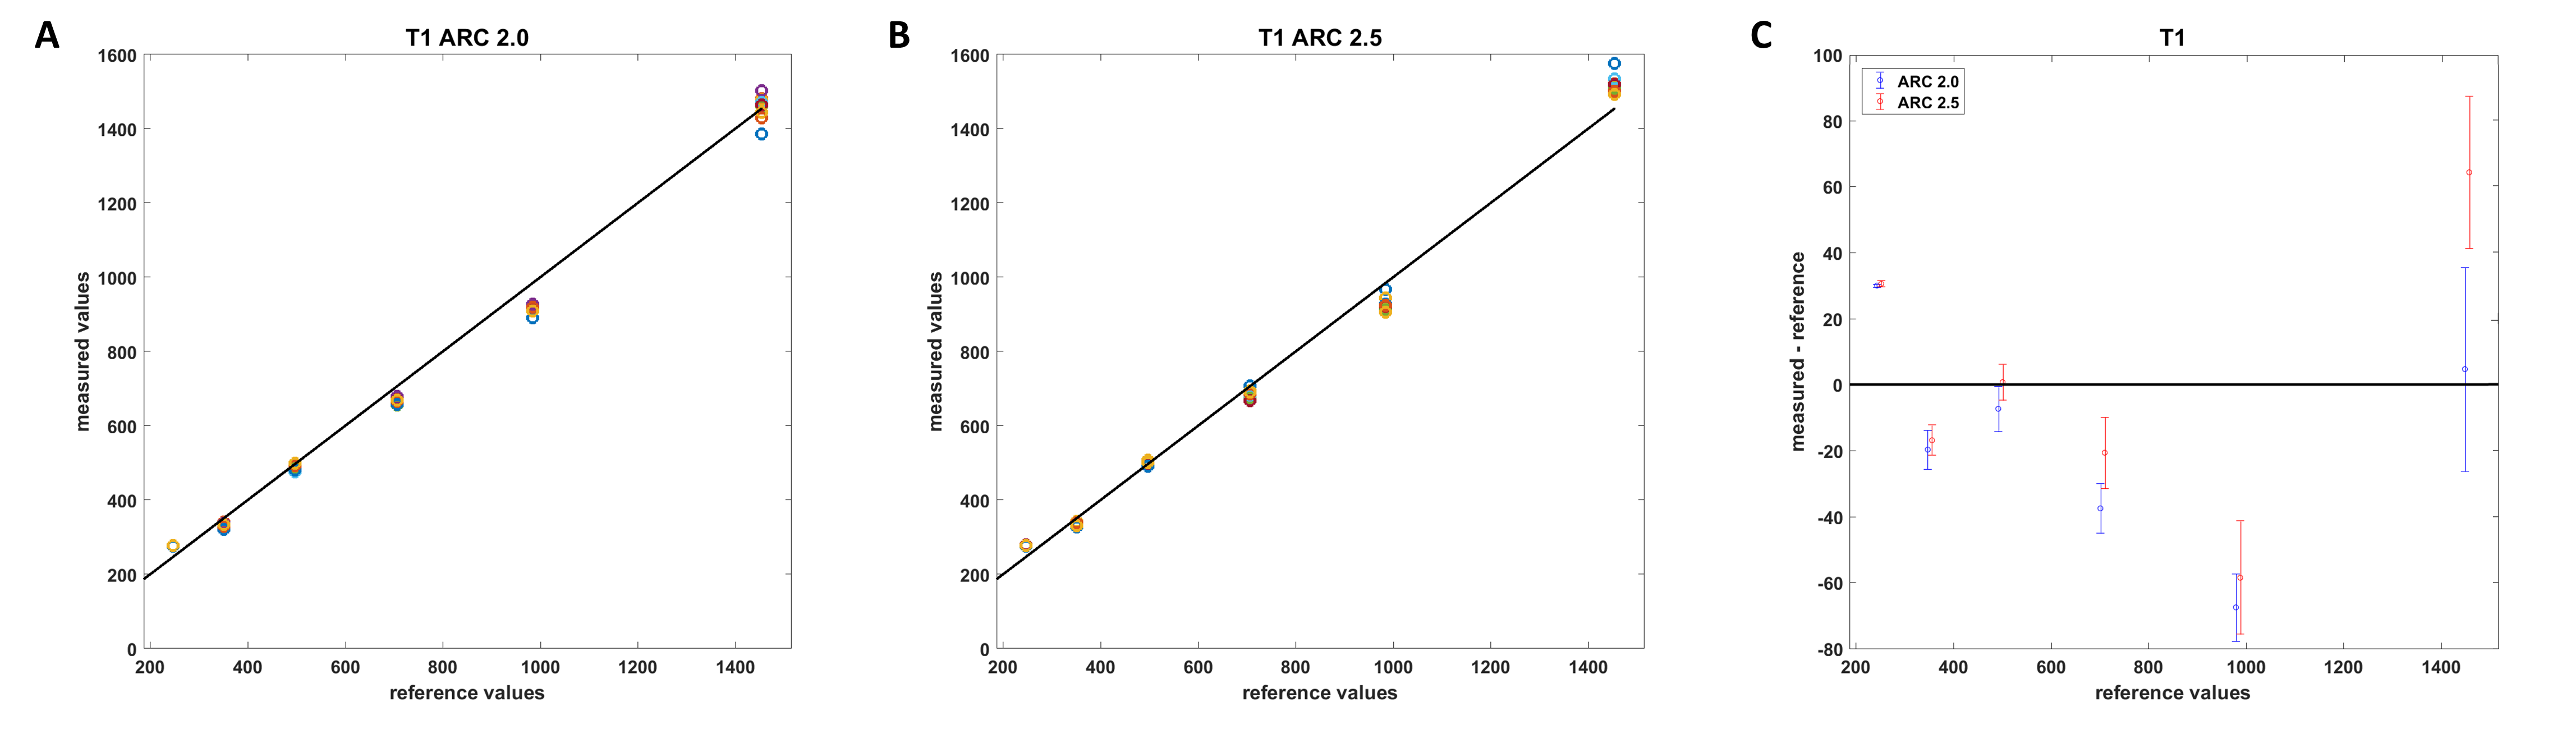
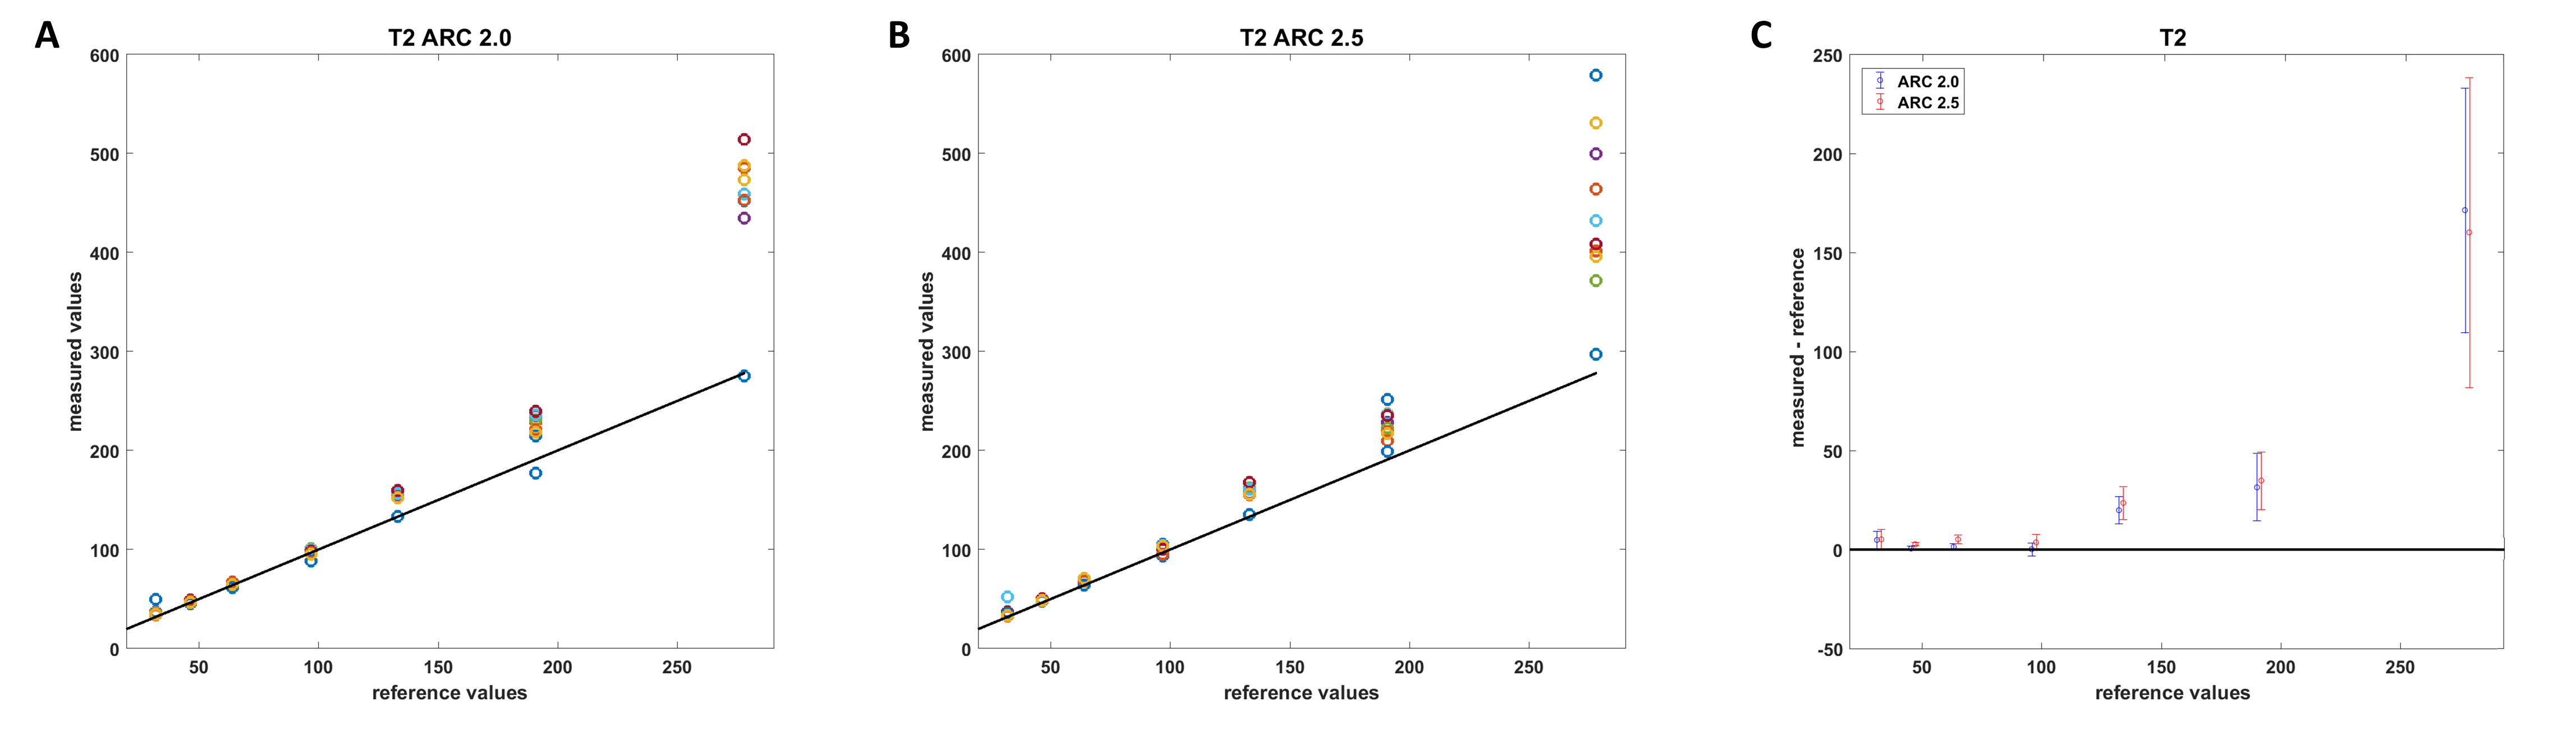
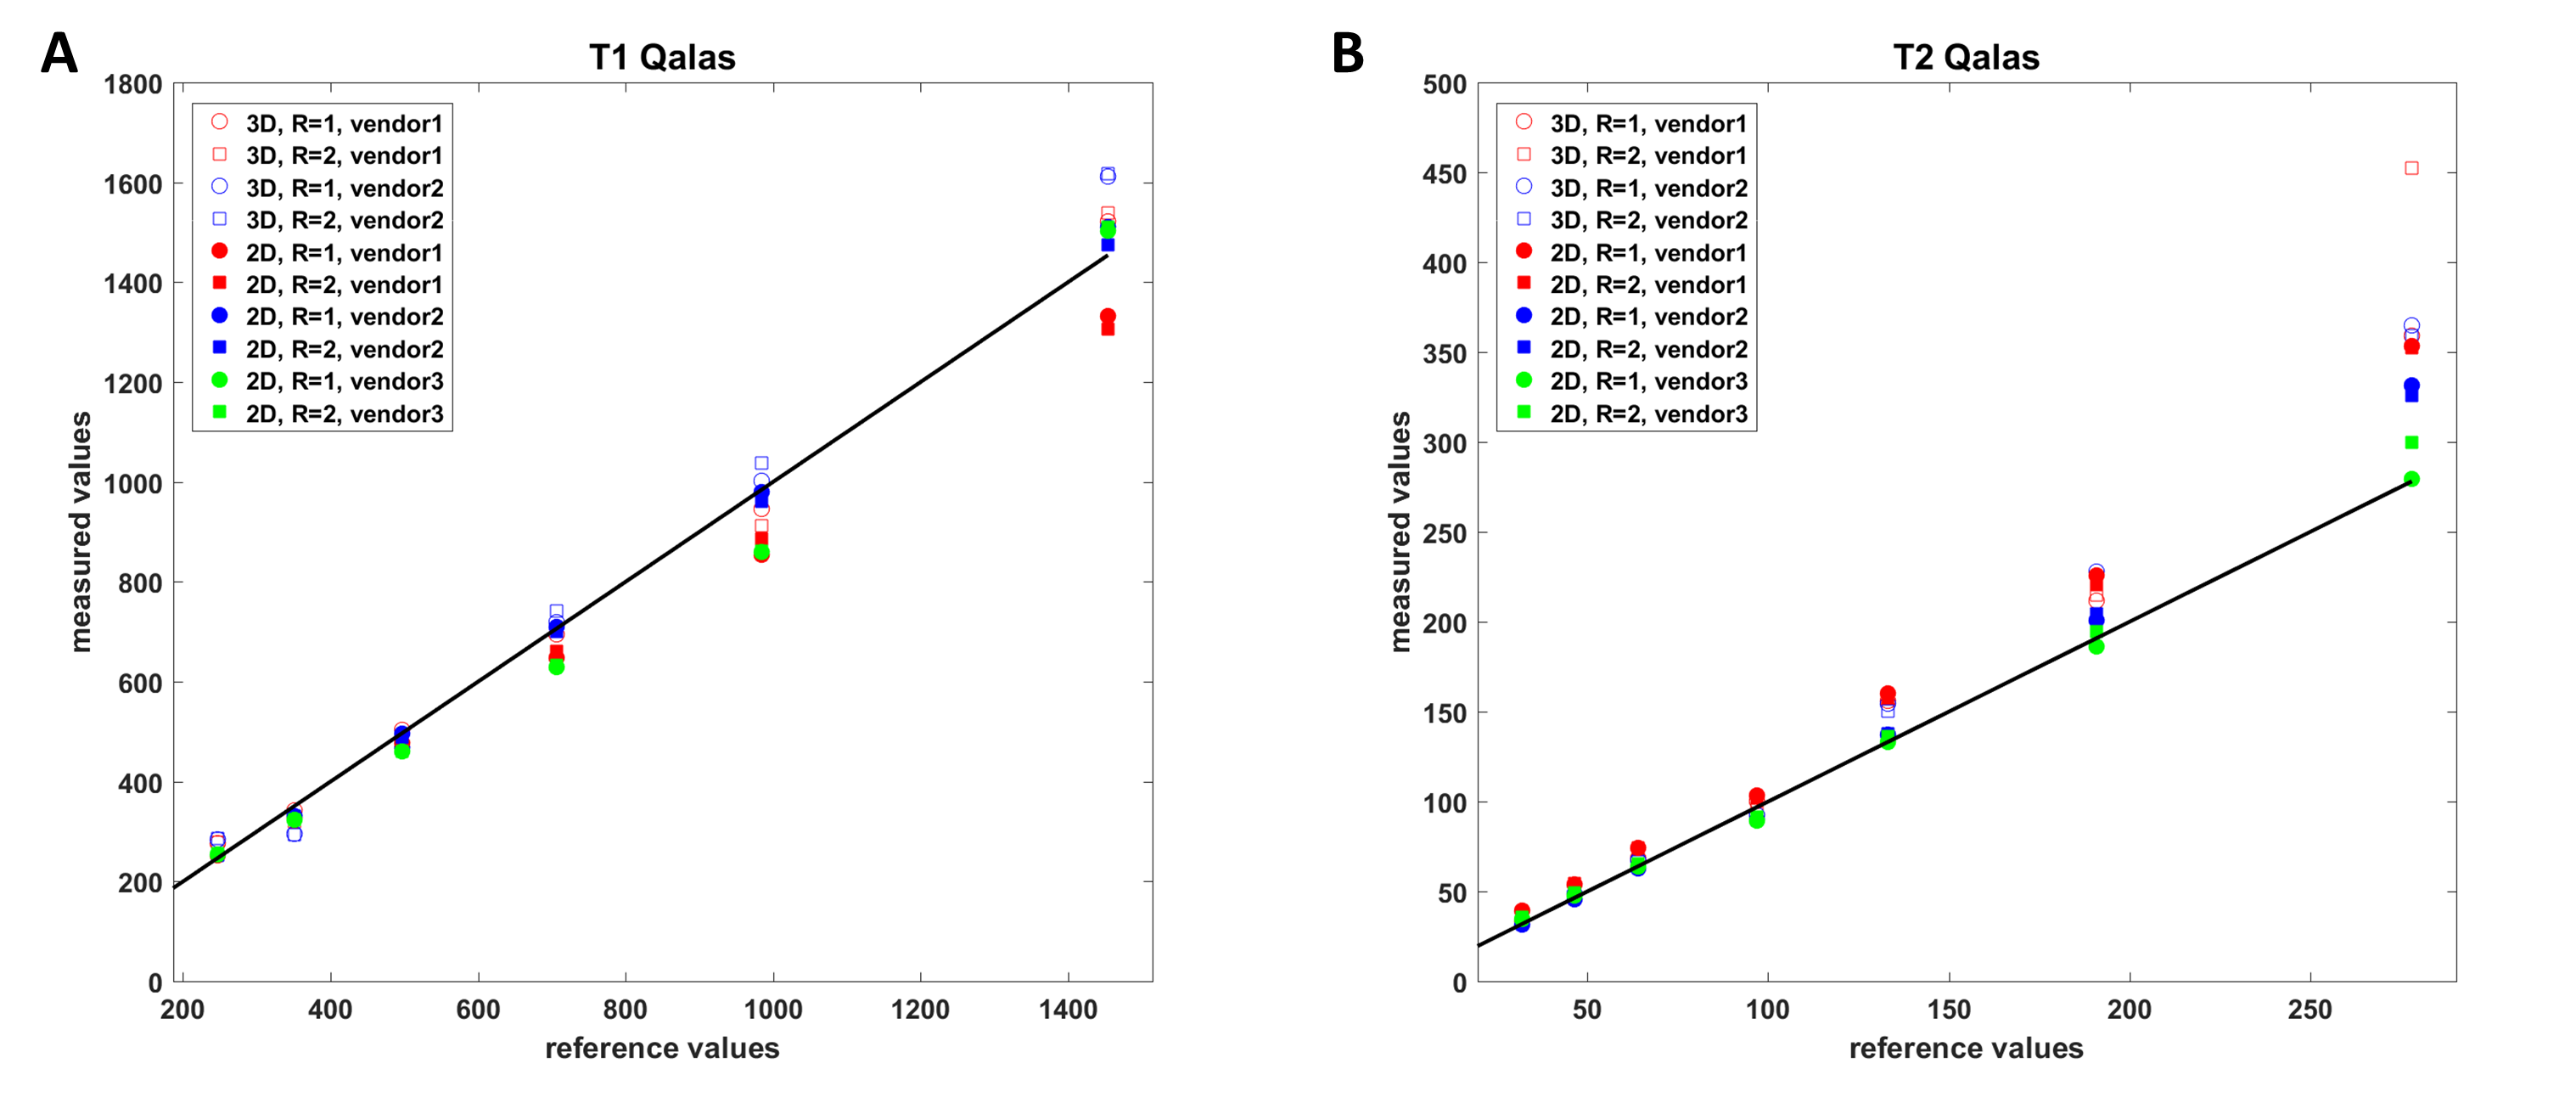
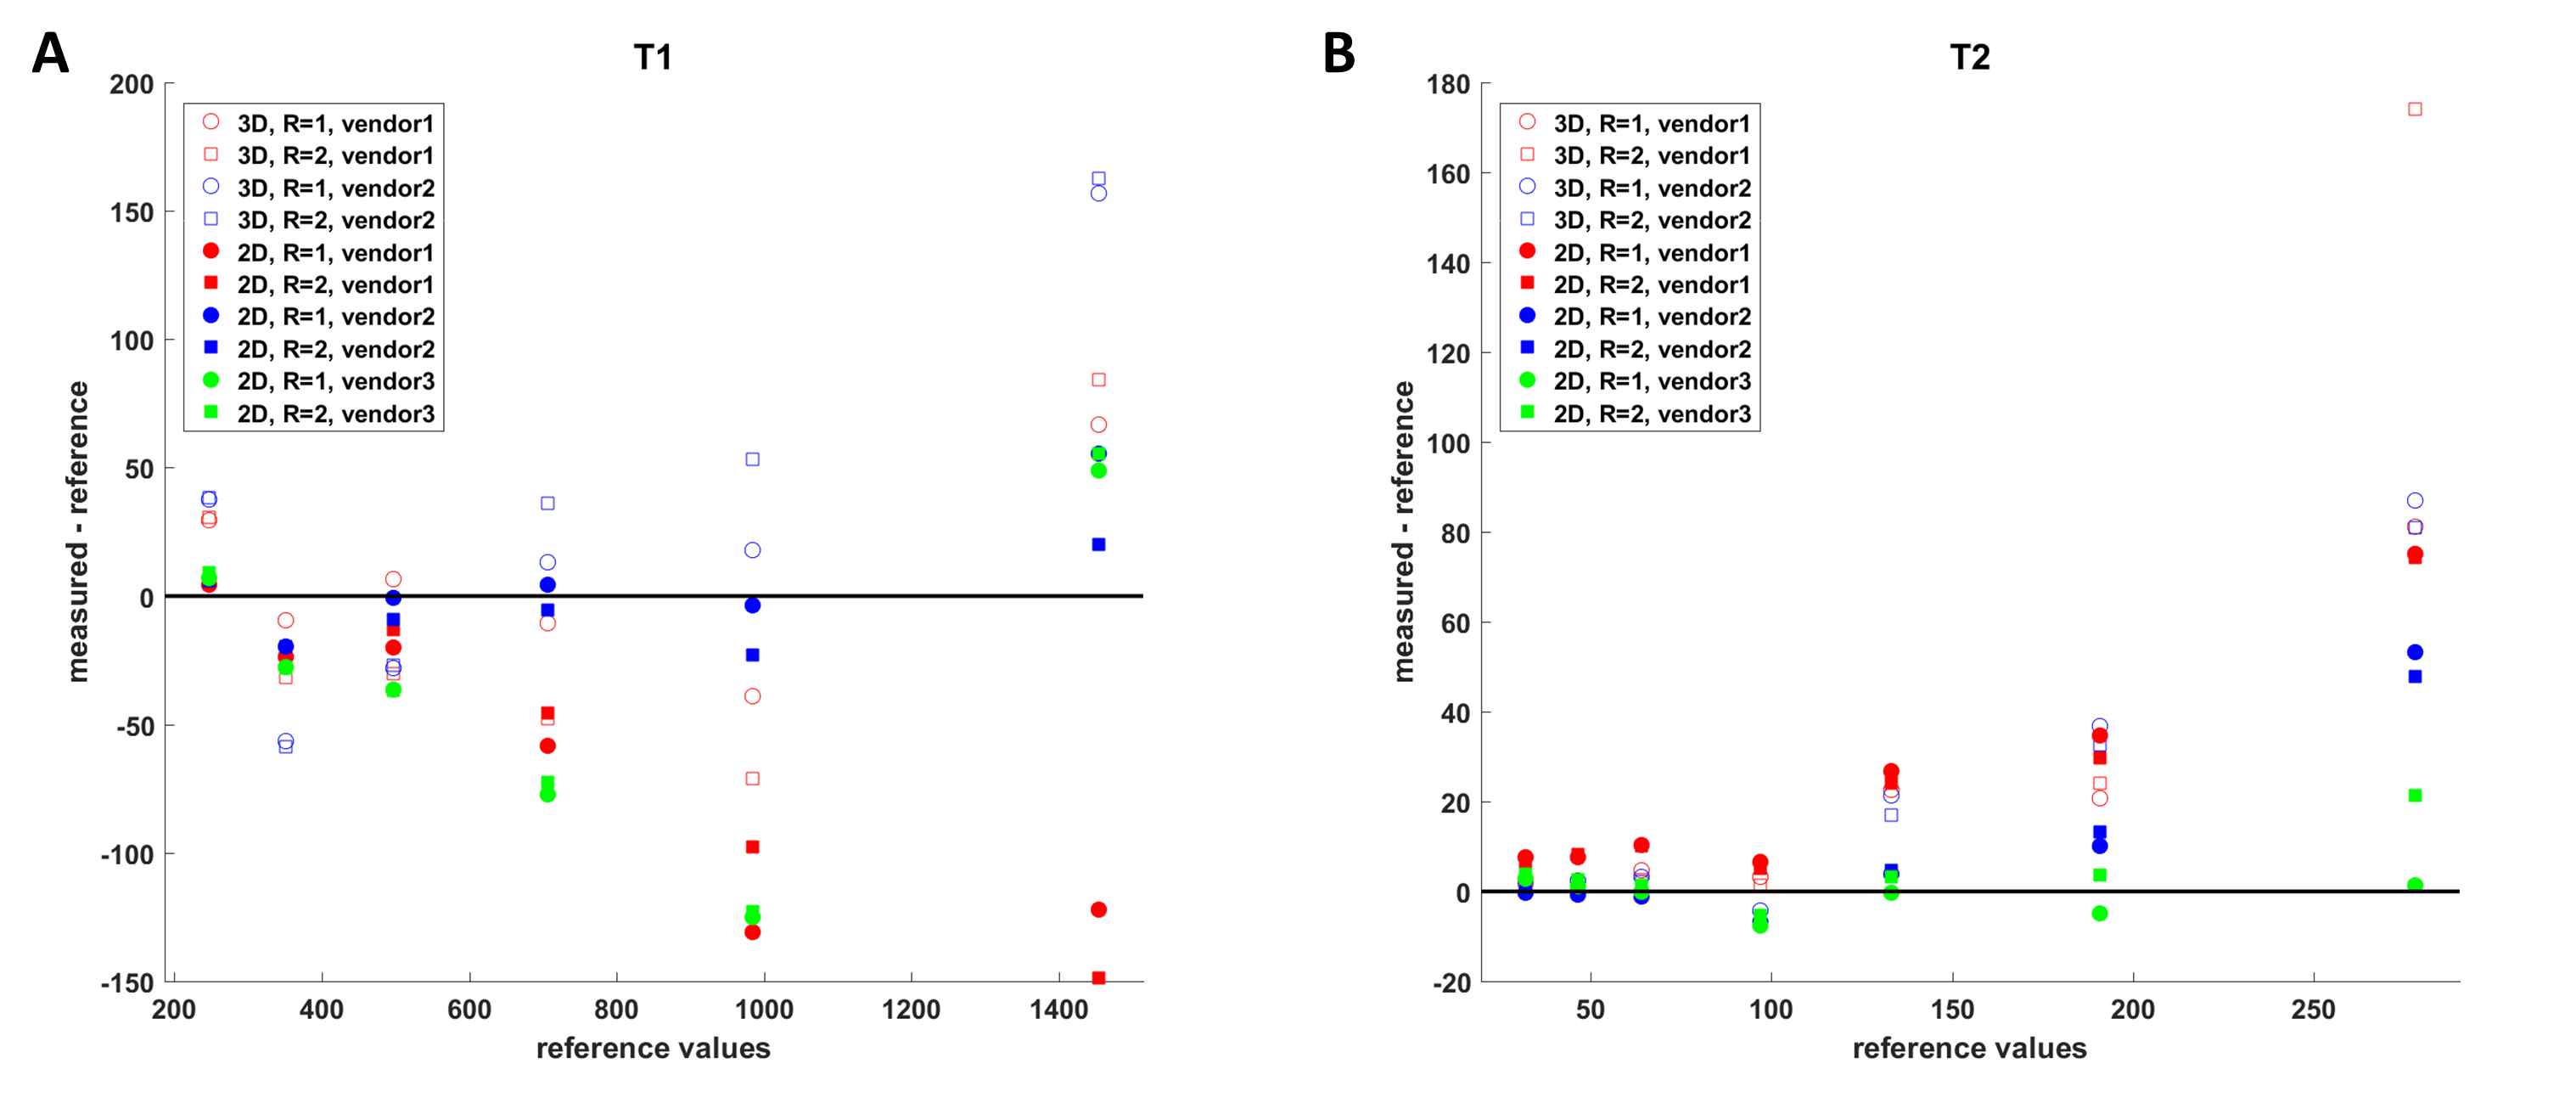
Figures 1 and 2 show the results of the individual repeated measurements and the averaged results with their deviation, for T1 and T2 respectively. These results show no systematic difference in precision between both settings for neither T1 and T2, nor any difference in accuracy for T2 (fig. 1C, 2C). Precision, indicated by the SD of the measurements, is lower for higher T1 and T2 values. T1 values are estimated somewhat higher using ARC=2.5, indicating a slight effect of acceleration. Figure 3 shows the measured values compared to the reference values for all properties, while figure 4 shows the differences between measurements and reference values. Figure 3A shows that all scanners can estimate T1 accurately, while figure 4a allows for a more in-depth investigation of the residual estimation errors, showing an overestimation of T1 at the extreme points and a v-shaped curve for all measurements except for the MDME scans of vendor 1. T2 values, shown in figure 3B and 4B, are estimated well for low values but are less accurate at higher T2-values, and more so with the 3D-QALAS sequence, which slightly overestimates them.Discussion
For T2, the difference between vendors (fig. 3B, 4B) is about equal to the reproducibility error (fig. 2C), indicating the absence of a vendor or sequence effect. T1 has a maximal error of about 15% for all vendors, which is larger than the reproducibility error found (fig. 1C). This is also larger than the previously reported error within a single vendor.7 The acceleration has a minimal effect for all vendors, irrespective of the acceleration technique used, at least in this geometrically simple phantom, as was also found recently in other research.8Conclusion
Magnetic parameter mapping using the synthetic MDME and 3D-QALAS sequences is reproducible and can be reproduced between vendors. Acceleration has a limited effect. For T2 estimations, the effects of vendor and sequence fall within the measurement error of repeated experiments. For the T1 measurements, the effect is larger but still acceptable.Acknowledgements
We thank Paul de Bruin (Philips), Michael Burke (GE), Thomas Janssens (Siemens) and Pieternel van der Tol (HollandPTC) for their help during this project.References
1. Ma, D., Gulani, V., Seiberlich, N., Duerk, J. & Griswold, M. MR Fingerprinting : Rapid Simultaneous Quantification of T1, T2, Proton Density and Off-resonance using a Spiral Trajectory. in Proceedings of the International Society of Magnetic Resonance in Medicine annual meeting 21, 0018 (2013).
2. Blystad, I. et al. Synthetic MRI of the brain in a clinical setting. Acta radiol. 53, 1158–1163 (2012).
3. Warntjes, J. B. M., Dahlqvist Leinhard, O., West, J. & Lundberg, P. Rapid magnetic resonance quantification on the brain: Optimization for clinical usage. Magn. Reson. Med. 60, 320–329 (2008).
4. Hwang, K.-P., Banerjee, S., Zhang, T. & Warntjes, J. B. M. 3D isotropic multi-parameter mapping and synthetic imaging of the brain with 3D-QALAS: comparison with 2D MAGIC. in Proceedings of the International Society of Magnetic Resonance in Medicine annual meeting 26, 5627 (2018).
5. Kvernby, S. et al. Simultaneous three-dimensional myocardial T1 and T2 mapping in one breath hold with 3D-QALAS. J. Cardiovasc. Magn. Reson. 16, 106 (2014).
6. Russek Stephen E et al. Characterization of NIST/ISMRM MRI system phantom. in Proceedings of the International Society of Magnetic Resonance in Medicine annual meeting 20, 2456 (2012).
7. Fujita, S. et al. Three-dimensional high-resolution simultaneous quantitative mapping of the whole brain with 3D-QALAS: An accuracy and repeatability study. Magn. Reson. Imaging 63, 235–243 (2019).
8. Fujita, S. et al. Accelerated Isotropic Multiparametric Imaging by High Spatial Resolution 3D-QALAS With Compressed Sensing. Invest. Radiol. Publish Ah, (2020).
Figures