1287
Rapid Whole-Brain Myelin Mapping via Selective Inversion Recovery and Compressed SENSE1Barrow Neurological Institute, Phoenix, AZ, United States
Synopsis
There is a significant need for specific biomarkers of myelin damage and repair. Quantitative magnetization transfer (qMT) using selective inversion recovery (SIR) is able to quantify the macromolecular-to-free proton pool size ratio (PSR), which has been shown to relate closely with myelin content and disability. For clinical applications, SIR is often hampered by long scan times. As a result, we employed compressed sensing and parallel imaging to significantly reduce scan times, with little effect on the precision and accuracy of PSR estimates in white matter.
INTRODUCTION
There is a significant need for specific biomarkers of myelin damage and repair in persons with multiple sclerosis (MS).1 Quantitative magnetization transfer (qMT) using selective inversion recovery (SIR) is able to quantify the macromolecular-to-free proton pool size ratio (PSR), which has been shown to relate closely with myelin content and disability2-4. Although SIR allows one to perform the qMT experiment using conventional inversion recovery sequences, it is hampered by the long scan5. Therefore, a faster, reliable SIR protocol is needed to enable widespread clinical translation. Compressed sensing sensitivity encoding (CS-SENSE) is a promising method that accelerates MRI acquisitions by combining the undersampling of k-space with compressed sensing reconstructions and parallel imaging6. In this work, we employed CS-SENSE and SIR-qMT imaging in phantoms and healthy subjects to investigate the effect of this acceleration on the linearity, signal-to-noise ratio (SNR), scan time, and the precision of PSR and R1f (the R1 of the free pool).METHODS
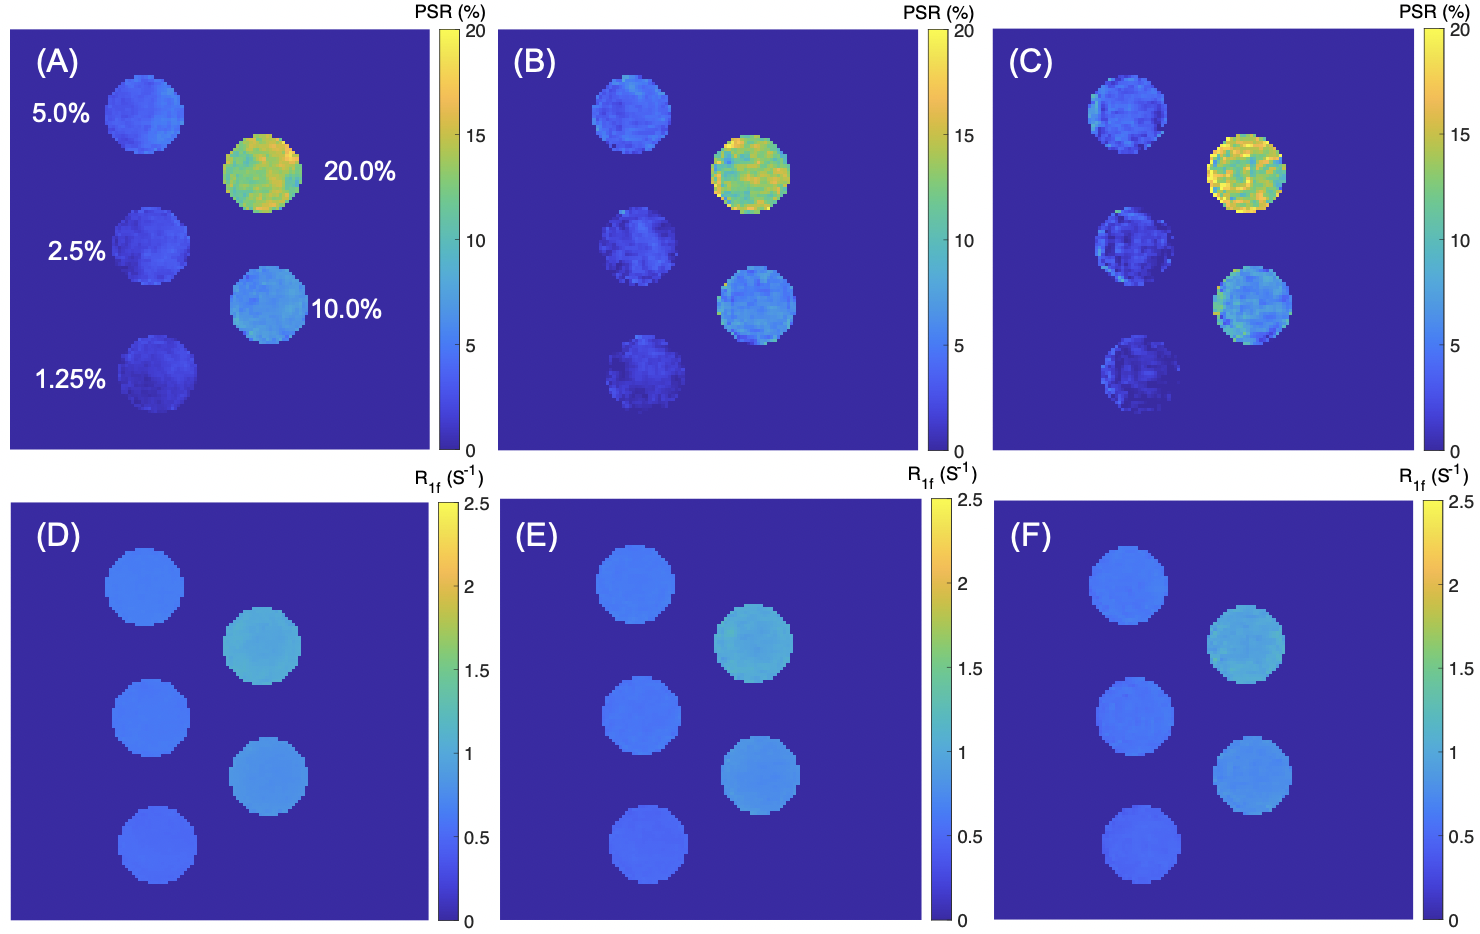
MRI: SIR was performed via an inversion recovery prepared 3D turbo spin-echo (TSE) sequence7 on a Philips 3T Ingenia scanner with a 32-channel head coil (Philips Healthcare, Best, The Netherlands). Additional parameters included: TI (inversion time) = [15, 15, 278, 1007] ms , TD (delay time) = [684, 4171, 2730, 10] ms, field-of-view = 210 x 210 x 114 mm3, resolution = 1.5 x 1.5 x 3 mm3, slices = 38, TSE factor = 22 (low-high profile). Three CS-SENSE factors (3, 8, and 12) were prospectively utilized to compare the acceleration performance. The resulting data were fit to a two-pool model of the MT effect to estimate PSR and the R1f3,8.Phantom Studies: SIR was first performed on a series of cross-linked bovine serum albumin (BSA) phantoms with varying macromolecular contents (concentrations: 1.25%, 2.5%, 5.0%, 10.0%, and 20.0%) to systematically evaluate the effect of CS-SESNE acceleration on the parameter estimates, including PSR and R1f. For each phantom and acceleration factor, the mean±SD parameter estimates, as well as the SNRs were tabulated for comparison. In addition, the linearity of the PSR vs. BSA content was examined.
Human Studies: Four healthy volunteers (age: 35.5±8.0, median±SD) underwent the whole-brain SIR qMT to evaluate the effect of CS-SESNE acceleration on SIR parameters in healthy brain. More specifically, manually drawn regions-of-interest (ROIs) were drawn for white matter (WM) and gray matter (GM) for each subject and acceleration factor, from which mean±SD parameter estimates were derived.
RESULTS
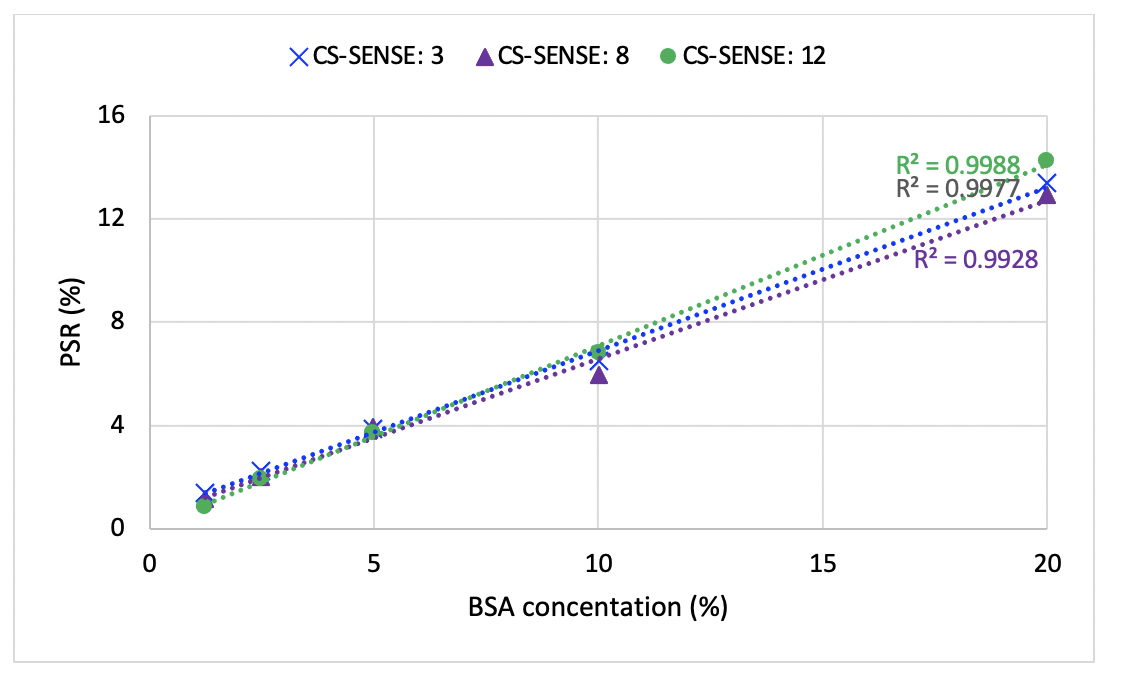
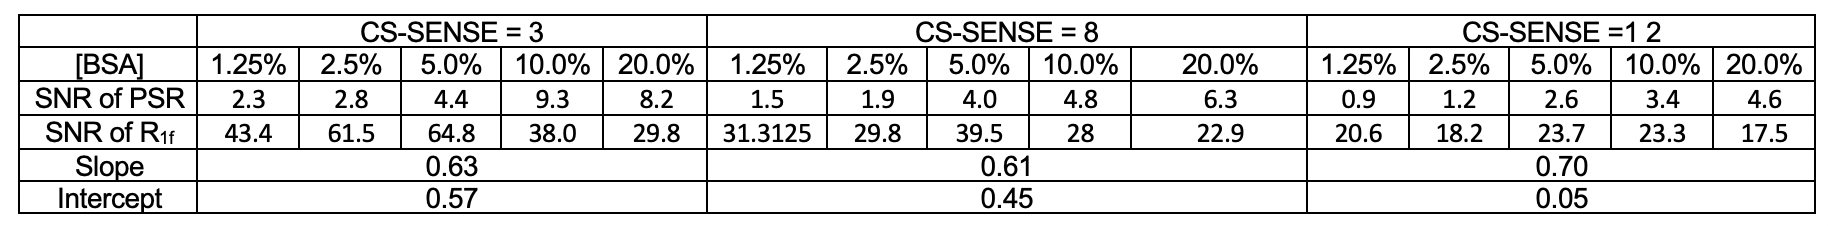
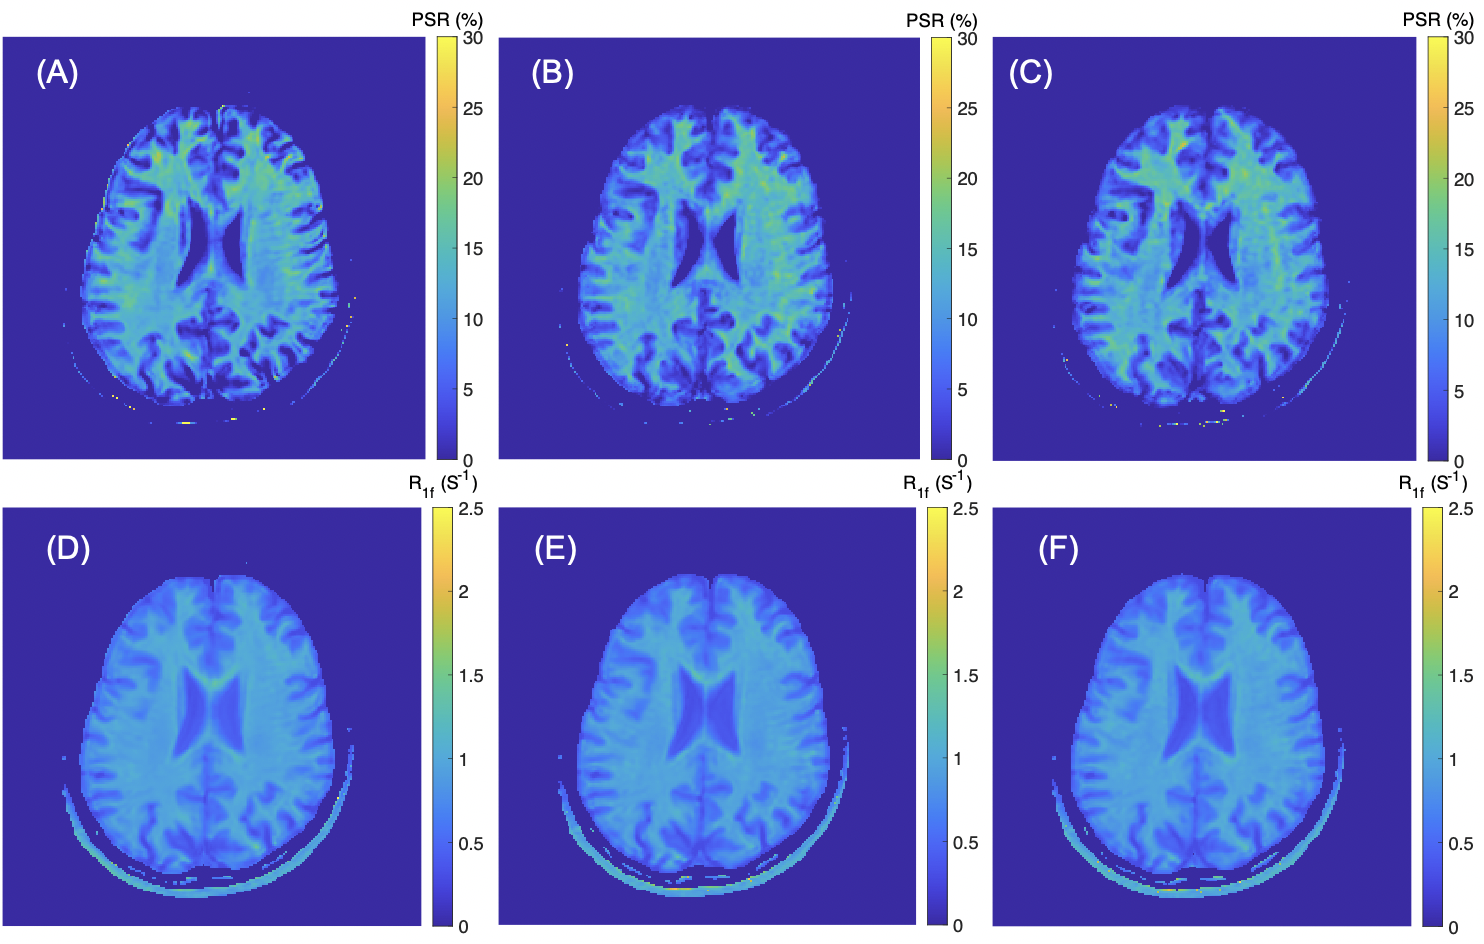
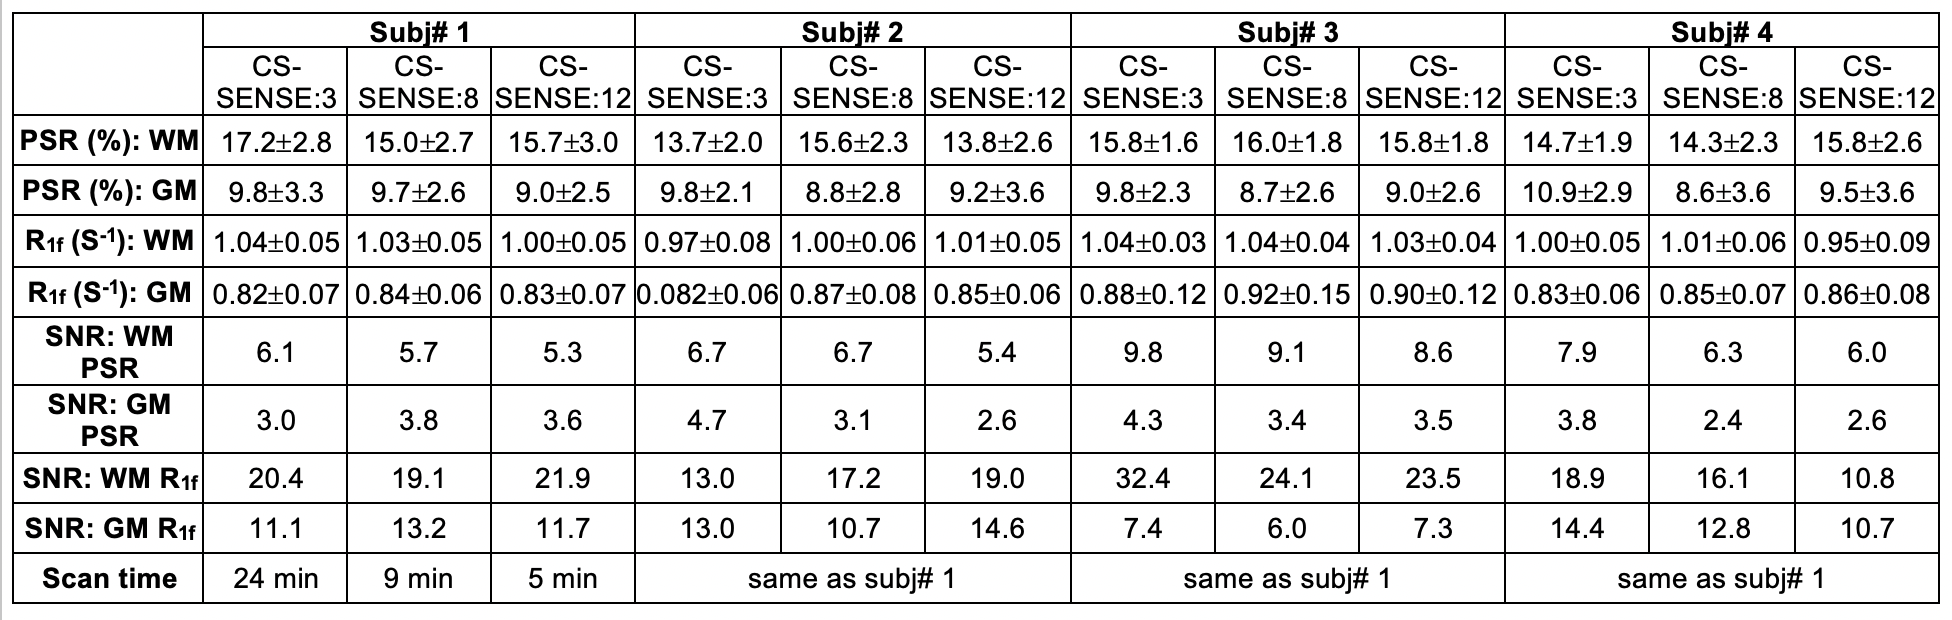
The PSR and R1f maps of the BSA phantoms acquired with the three CS-SENSE factors are shown in Fig. 1. As shown in Fig. 2, PSR exhibited strong linear correlation with BSA concentration (R2 > 0.99) for all three acquisitions. The corresponding slope and intercept of the linear fitting were similar across acceleration factors along with mean parameter estimates for each phantom (Table 1). As expected, the SNR of the parameter estimates decreased with increasing acceleration factor.The acquisition times for the volunteer scan were about 24 minutes, 9 minutes, and 5 minutes for the acceleration factors of 3, 8, and 12. Fig. 3 shows an example of PSR and R1f maps of a volunteer at the acceleration factors. These resulting SNR and mean parameter estimates for WM and GM regions are summarized in Table 2.
For all four subjects, the average percent change of PSR in WM is 7.6% from CS-SENSE=3 to 8, and is 4.2% from CS-SENSE=3 to 12; in GM the changes are 10.8% and 8.3% accordingly. Similarly, for R1f data, the percent change from CS-SENSE=3 to 8 is 1.2%, and is 2.75% when CS-SENSE factor reaches 12 for WM; in GM, the corresponding changes are 3.45% and 2.5% respectively.
The average SNR reduction in PSR in WM is 9.8% when the CS-SENSE factor increases from 3 to 8, and is 17.0% when the CS-SENSE factor reaches 12. In contrast in GM, the SNR reduction is markedly large (29.5% and 28.7 % accordingly). For the human R1f data, the SNR change in WM from CS-SENSE=3 to 8 is 19.0%, and is 31.3% when CS-SENSE increases to 12; in GM, the SNR change is 16.8% and 11.2% accordingly.
DISCUSSION
Looking at trade-offs between scan time and the precision of the parameter estimates, a compressed SENSE of 8 seems to be a practical option with a small SNR reduction (<10%) and small differences relative to lower compressed SENSE factors for both PSR and R1f (both <10%). This results in a whole-brain protocol of 9 minutes, which would greatly expand the clinically viability of SIR-qMT imaging. Future work will focus on collecting data in a larger cohort (including persons with MS) and investigating regularization methods across scans with different TI/TD values to achieve further accelerations. Nevertheless, the study shows that compressed SENSE is a promising method to accelerate 3D whole brain SIR scans (<10 minutes) with high precision in WM.CONCLUSION
Compressed SENSE yields significantly reduced scan times with little effect on the precision and accuracy of PSR and R1f estimates in WM. Future work will evaluate the effect of CS-SESNSE on scan-rescan repeatability, and enroll MS patients to evaluate the method in focal lesions.Acknowledgements
The authors would like to thank the Philips Healthcare’s support.References
1. Reich D, Lucchinetti C, Calabresi P. Multiple Sclerosis. N Engl J Med. 2018; 378(2): 169-180.
2. Gochberg D, Gore J. Quantitative Magnetization Transfer Imaging via Selective Inversion Recovery With Short Repetition Times. Magn Reson Med. 2009; 57(2): 437-441.
3. Dortch R, Gochberg D, Welch E, et al. Quantitative magnetization transfer imaging in human brain at 3T via selective inversion recovery. Magn Reson Med. 2011; 66(5): 1346-1352.
4. Dortch R, Moore J, Li K, et al. Quantitative magnetization transfer imaging of human brain at 7T. NeuroImage. 2013; 64: 640-649.
5. Cronin M, Xu J, Bagnato F, et al. Rapid whole-brain quantitative magnetization transfer imaging using 3D selective inversion recovery sequences. Magn Reson Imaging. 2020; 68: 66-74.
6. McLean M, Lebel R, MacDonald M, et al. Accelerated quantitative magnetization transfer (qMT) imaging using compressed sensing and parallel imaging. ISMRM 2019.
7. Dortch R, Bagnato F, Gochberg D, et al. Optimization of Selective Inversion Recovery Magnetization Transfer Imaging for Macromolecular Content Mapping in the Human Brain. Magn Reson Med. 2018; 80(5): 1824-1835.
8. Li K, Zu Z, Xu J, et al. Optimized inversion recovery sequences for quantitative T1 and magnetization transfer imaging. Magn Reson Med. 2010; 64(2):491-500.
Figures